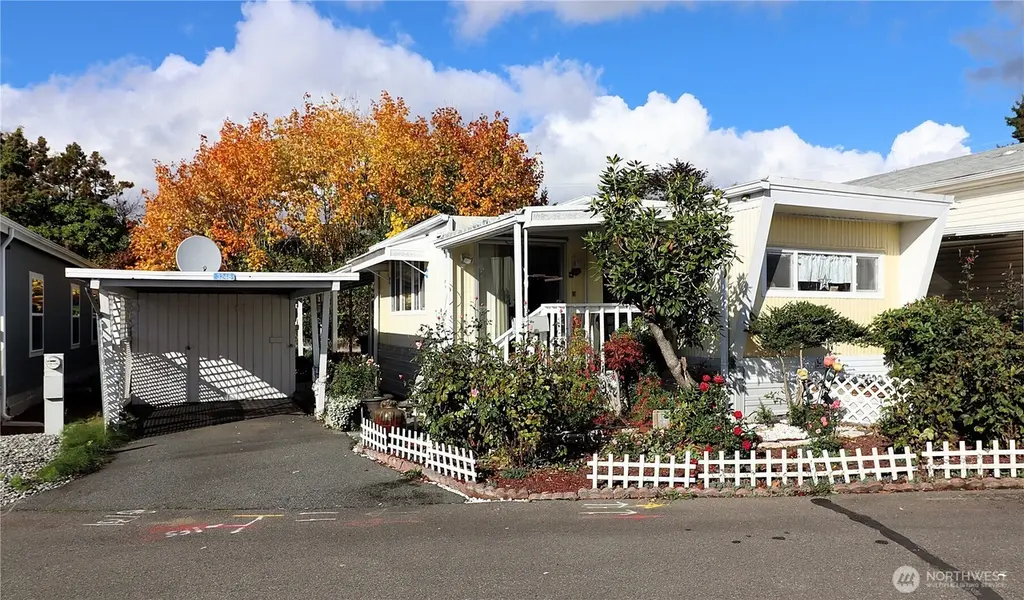
3248 S 180th Pl #34 · SeaTac, WA
Flood risk 1/10 · Minimal
- FEMA flood zone
- X (unshaded)
- Chance of flooding over 30 yrs
- 0.0%
- Est. flood insurance / yr
- $507 – $1,088
Fire risk 1/10 · Minimal
- Est. fire insurance / yr
- $604 – $1,122
Heat risk 3/10 · Minor
- Hot days now (above 88°F)
- 7 days/yr
- Hot days in 30 yrs
- 15 days/yr
Wind risk 1/10 · Minimal
- Chance of severe wind over 30 yrs
- —
Air-quality risk 7/10 · Major
- Unhealthy air days now
- 9 days/yr
- Unhealthy air days in 30 yrs
- 10 days/yr
Risk factors via First Street. Map © Google.
Why this score? — see what drove the D grade
The composite is a weighted blend of 9 inputs, each scored 0–100. Each bar is that input's sub-score; the figure is the points it added to the 100-point composite (weight × sub-score).
- Cash flow +15.0/30.0
- ARV discount +7.5/15.0
- 1% rule +5.0/10.0
- DSCR +5.0/10.0
- Schools +3.9/10.0
- Livability +3.9/5.0
- Rent growth +2.3/5.0
- Condition / age +2.2/5.0
- Appreciation +0.0/10.0
$34,900
🖨 Deal sheet 📄 Offer letter ✓ Due diligence
Listing remarks
Come see this adorable singlewide for sale at Bow Lake (55+) This 1961 singlewide has a lot to offer. 1 bedroom / 1 full bathroom at 550 sq. ft. Enjoy a large living room, large bedroom, and a kitchen with plenty of storage. The back has a private feel with plenty of space to make your own. Beautiful landscaping out front, a large storage shed, a covered back patio, and covered parking. Bow Lake is a wonderful community with amazing amenities including a pool and secured access! Come make it yours!
Key facts
- Covered parking
- Large living room
- Covered back patio
Tags
Neighborhood map
What this means for you Summary
Snapshot
- This is a 1-bed/1.0-bath manufactured listed at $35k. Condition is rated fair.
Deal economics
- At list price, monthly cash flow is $994 ($12k/yr) — positive.
- The deal already cash-flows at list — no discount required.
- Meets the 1% rule at list price ($2k rent vs $35k).
- Recommended offer: $31k (12.0% below list) — sets the bar for market timing.
- Cap rate 40.5% vs local median 3.1% in SeaTac — top-decile yield for the area; either an underpriced asset or a hidden risk that comps aren't pricing in. Stress-test before assuming the spread holds.
Location & tenants
- Location reads 78/100 on livability (#118 in WA, #2,417 nationally) — a middle-class / working-renter tenant base. Strengths: commute A+, housing A+, health & safety A+; Watch: schools F, crime F, cost of living F.
- Highline School District (suburban): math 36% / reading 49% proficiency, ranked #200 of 291 in WA (top 69%) — families likely to look elsewhere, expect single-tenant / working-renter base with shorter leases.
- Market conditions: Rents soft (-0.7%/yr); 96 active listings in the ZIP; 20 comparable units currently listed for rent nearby; rentals at typical pace (median 15d on market — plan ~3-4 weeks tenant-placement turnaround); solid renter incomes; 10,555 units permitted in King County in 2024 (7,119 in 5+ unit buildings).
Forward outlook
- Local home prices are declining (-3.0%/yr); year-one equity from $241 of loan paydown is wiped out by about $1k of value loss. Plan a longer hold.
- King County population projected at +44% by 2050 — long-run rental-demand tailwind backs the buy-and-hold thesis.
- At projected returns (-3.0% appreciation + 0.0% rent growth), your $10k cash investment doubles in ~1 year — after that, you're playing with house money.
Negotiation context
- It's been on market 220 days — a 12% lower offer ($31k) is reasonable based on typical stale-listing flexibility.
- 2 sale attempts; this cycle's ask has dropped $4k (11%) from the opening price — seller is motivated, your offer sets the floor, not the list.
Questions for the listing agent
- It's been on market 220 days. Have you received any prior offers? Is the seller open to a 12% concession, seller financing, or rate buy-down credit?
- Have any recent inspections been done? Can we get a copy of the seller's disclosures and any deferred-maintenance estimates?
- Built in 1961 — when were the roof, HVAC, electrical panel, plumbing, and water heater last replaced?
- Why hasn't it sold? Are there any deal-killer items the seller is aware of (foundation, flood, title, zoning, code violations)?
- Is there a deadline driving the sale (1031 exchange, divorce, estate, relocation)? That informs how much negotiation room exists.
- Schools are F-rated, which usually means shorter tenancies and higher turnover. Who's the typical renter profile here, and what's been the actual vacancy rate?
- Crime grade is F in this area — have there been break-ins, vandalism, or insurance claims at this property in the last 3 years? What carrier currently insures it and at what premium?
- The area grade is low — what's the realistic commute time and amenity access for the typical tenant pool here? Any planned neighborhood developments (good or bad) we should know about?
- What's the average days-on-market for RENTAL listings here right now (not sales)? A rising rental-DOM trend means longer vacancies and softer asking-rent achievability than the comps imply.
- What's the recent tenant-quality profile in this submarket — average credit score on applications, eviction rate, late-payment / NSF rate, and stable-employment percentage? A property-management company in the area should have these aggregated.
- How much new for-sale + rental construction is in the pipeline within 1–3 miles? Heavy new supply typically softens prices + rents 12–24 months out; constrained supply supports both.
Investment metrics
- 1% rule
- 4.48% ✓
- Cap rate
- 40.48%
- Cash-on-cash
- 122.09%
- DSCR
- 6.43
- GRM
- 1.9
CMA / ARV
- ARV (median comp)
- $72,571
- List price
- $34,900
- Delta
- -51.91%
- Verdict
- UNDERPRICED
- Comps
- 6 within 1.0 mi
Show comp detail 1 sale within ~0.75 mi
| Address | Dist | Beds/Ba | Sqft | Sold | Price | $/sf | Match |
|---|---|---|---|---|---|---|---|
| 18305 35th Ave S #357 | 0.19mi | 2/1.5 (+1) | 540 (-2%) | 4mo | $23,500 | $44 | 78 |
Match score weights: distance 35% · size 25% · config 20% · recency 20%. Top-matched comps best support the ARV.
Projected returns pro-forma
-3.0% appreciation · 0.0% rent growth · sell at horizon
- IRR
- —
- Equity multiple
- 6.43×
- Total profit
- $53,109
- Equity at exit
- $5,204
- IRR
- —
- Equity multiple
- 12.27×
- Total profit
- $110,171
- Equity at exit
- $3,018
Cash invested: $9,772 (down + closing). Projections, not guarantees.
Landlord ↔ Tenant lean methodology
- Overall (STATE)
- 28 Tenant-Leaning
- State Washington
- 28 Tenant-Leaning · D+8
- County
- — inherits STATE
- City
- — inherits STATE
ZIP-level market 98188
- Rents YoY
- -0.7%
- Active inventory
- 96
- Price-to-rent
- 1.9×
Monthly cashflow live
- Estimated rent
- $1,564 high interval (Pro) →
- Mortgage (P&I)
- −$183
- Tax est. 1.5%
- −$44 /mo · $524/yr
- Insurance
- −$15
- HOA
- −$0
- Vacancy / Maint / Mgmt
- −$328
- Net cashflow
- $994
Break-even live
UW: 25.0% down · 7.5% · 30yr · 1.5% tax · 5.0% vac · 8.0% maint · 8.0% mgmt
Financing live
Cash to close
- Down payment
- $8,725
- Closing costs
- $1,047
- Reserves months
- —
- Total cash needed
- —
Loan-product check · same deal, 3 products live
Conventional
25% down · 7.5% · 30yr
- Down + closing
- —
- Monthly P&I
- —
- Monthly cashflow
- —
- DSCR
- —
- Eligible?
- —
Personal DTI + credit; lowest rate.
DSCR
20% down · 8.5% · 30yr
- Down + closing
- —
- Monthly P&I
- —
- Monthly cashflow
- —
- DSCR
- —
- Eligible?
- —
No personal income docs; deal must DSCR.
Hard money
10% down · 12.0% · 12mo
- Down + closing
- —
- Monthly P&I
- —
- Monthly cashflow
- —
- DSCR
- —
- Eligible?
- —
Short-term bridge; refi at stabilization.
Rent comps 20 comps
| Address | Beds | Baths | Sqft | Rent | $/sqft | DOM | Units | Dist |
|---|---|---|---|---|---|---|---|---|
| 17840 32nd Ave S Seatac, WA | 1.0–2.0 | 1.0–1.5 | 757 | $1,425 | $1.88 | 12d | 3 | 0.10mi |
| 3508 S 180th St Seatac, WA | 1.0–2.0 | 1.0–2.0 | 793 | $1,450 | $1.83 | 12d | 4 | 0.15mi |
| 3425 S 176th St #128 Seatac, WA | 1.0 | 1.0 | 534 | $1,500 | $2.81 | 43d | 1 | 0.25mi |
| 3445 S 176th St #401 Seatac, WA | 1.0 | 1.0 | 608 | $1,450 | $2.38 | 43d | 1 | 0.30mi |
| 3445 S 176th St #401 Seatac, WA | 1.0 | 1.0 | 608 | $1,400 | $2.30 | 14d | 1 | 0.30mi |
| 3351 S 175th St Seatac, WA | 1.0 | 1.0 | 665 | $1,850 | $2.78 | 1d | 4 | 0.33mi |
| 4410 S 173rd St Seatac, WA | 2.0 | 1.0 | 723 | $2,100 | $2.90 | 43d | 1 | 0.74mi |
| 3117 S 192nd St Seatac, WA | 1.0 | 1.0 | 676 | $1,722 | $2.55 | 1d | 2 | 0.75mi |
| 16700 31st Ave S Seatac, WA | 1.0 | 1.0 | 750 | $1,498 | $2.00 | 43d | 2 | 0.87mi |
| 4807 S 172nd Pl Seatac, WA | 2.0 | 1.0 | 700 | $2,550 | $3.64 | 43d | 1 | 0.95mi |
| 19707 International Blvd Seatac, WA | 2.0 | 1.0 | 614 | $1,399 | $2.28 | 1d | 20 | 1.14mi |
| 19800 International Blvd Seatac, WA | 1.0–2.0 | 1.0–1.5 | 790 | $1,545 | $1.96 | 1d | 13 | 1.16mi |
| 19912 Military Rd S SeaTac, WA | 1.0 | 1.0 | 656 | $1,495 | $2.28 | 43d | 1 | 1.26mi |
| 3445 S 160th St Seattle, WA | 1.0–2.0 | 1.0 | 730 | $1,550 | $2.12 | 3d | 5 | 1.29mi |
| 2929 S 200th St Seatac, WA | 2.0 | 1.0–2.0 | 703 | $2,288 | $3.25 | 16d | 12 | 1.31mi |
| 2929 S 200th St Seatac, WA | 2.0 | 1.0–2.0 | 703 | $2,335 | $3.32 | 1d | 7 | 1.31mi |
| 2650 S 200th St Seatac, WA | 1.0 | 1.0 | 566 | $1,767 | $3.12 | 43d | 1 | 1.31mi |
| 20036 30th Ave S Unit S9 SeaTac, WA | 2.0 | 1.0 | 750 | $1,795 | $2.39 | 10d | 1 | 1.36mi |
| 20036 30th Ave S Unit S8 SeaTac, WA | 2.0 | 1.0 | 750 | $1,795 | $2.39 | 24d | 1 | 1.36mi |
| 15805 40th Pl S Tukwila, WA | 1.0 | 1.0 | 700 | $1,499 | $2.14 | 1d | 2 | 1.39mi |
Listing history 17 events
-
2026-06-18days on market $34,900 Active 220 DOM
-
2026-06-17days on market $34,900 Active 219 DOM
-
2026-06-16days on market $34,900 Active 218 DOM
-
2026-06-15days on market $34,900 Active 217 DOM
-
2026-06-13days on market $34,900 Active 215 DOM
-
2026-06-09days on market $34,900 Active 211 DOM
-
2026-06-08days on market $34,900 Active 210 DOM
-
2026-06-07days on market $34,900 Active 209 DOM
-
2026-06-04days on market $34,900 Active 206 DOM
-
2026-06-03days on market $34,900 Active 205 DOM
-
2026-06-02days on market $34,900 Active 204 DOM
-
2026-06-01days on market $34,900 Active 203 DOM
-
2026-05-31days on market $34,900 Active 202 DOM
-
2026-03-10price $34,900
-
2026-02-13status Active
-
2026-02-10status Pending
-
2025-11-07$39,000 Active
ⓘ Source: listings_history table (triggers on properties + properties_extension) + one-shot
backfill from property_details.listing_events for pre-trigger history.
Climate risk First Street
- Flood 1/10 Low FEMA zone X (unshaded) · 0% chance over 30 yrs
- Wildfire 1/10 Low
- Heat 3/10 Moderate 7 d/yr ≥88°F today · 15 d/yr by 30 yrs out
- Wind 1/10 Low
- Air quality 7/10 Severe 9 unhealthy d/yr today · 10 by 30 yrs out
Nearby sold comps map
Loading sold comps map…
Walkable amenities ~0.75 mi
Loading nearby amenities…
Taxation est. · year 1
- Rental income
- $18,766
- − Mortgage interest
- −$1,955
- − Property taxes
- −$524
- − Insurance
- −$174
- − Repairs & maintenance
- −$1,501
- − Management
- −$1,501
- − Depreciation
- −$1,015
- Taxable income
- $12,095
- Est. tax owed @ 24.0%
- −$2,903
- After-tax cash flow
- $9,028/yr
For passive investors: Depreciation is non-cash, so a rental often shows a tax loss while cash-flowing — sheltering income. Rental losses are passive: they offset passive income freely, and up to $25,000/yr can offset ordinary (W-2) income if you actively participate and your MAGI is under $100k (phasing out to $0 by $150k); unused losses carry forward. On sale, claimed depreciation is recaptured at up to 25%, and gains may owe capital-gains tax (a 1031 exchange can defer both). Figures are a year-1 estimate at your 24.0% rate — not tax advice; consult a CPA.
Condition & rehab AI · 12 photos
This singlewide has potential for significant value increase with moderate renovations to the kitchen and bathroom. The home is in fair condition with good landscaping and curb appeal.
Repairs flagged
- Moderate kitchen cabinets — dated and in need of updating
- Moderate kitchen countertops — dated and in need of updating
- Moderate bathroom fixtures — dated and in need of updating
- Moderate bathroom tile — dated and in need of updating
Value-add opportunities
- Both update kitchen cabinets and countertops — modernizing the kitchen will increase both resale and rental value
- Both update bathroom fixtures and tile — modernizing the bathroom will increase both resale and rental value
Renovation cost estimate screening
| Repair item | Severity | Est. cost |
|---|---|---|
| kitchen cabinets · dated and in need of updating | Moderate | $3,000–15,000 |
| kitchen countertops · dated and in need of updating | Moderate | $3,000–15,000 |
| bathroom fixtures · dated and in need of updating | Moderate | $3,000–15,000 |
| bathroom tile · dated and in need of updating | Moderate | $3,000–15,000 |
| Total estimated repair cost · 4 items | $12,000–60,000 |
Value-add ROI direction
- Both update kitchen cabinets and countertops — modernizing the kitchen will increase both resale and rental value ↑
- Both update bathroom fixtures and tile — modernizing the bathroom will increase both resale and rental value ↑
ⓘ Cost ranges are severity-bucket heuristics (US national rule-of-thumb). Get contractor quotes + a written scope before underwriting a rehab budget.
Schools (NCES district)
- District
- Highline School District
- NCES district ID
- 5303540
- Math proficiency
- 36% ▼ -4.00%
- Reading proficiency
- 49% ▼ -1.00%
- Median HH income
- $52,697
- Composite
- 39.12/100
- National rank
- #8245
- State rank
- #200 of 291 in WA
Livability — SeaTac
- Score
- 78/100
- State rank
- #118
- US rank
- #2417
Category grades
Schools grade is shown separately in the Schools card above.
Census & demographics
- Census place
- SeaTac, WA
- County
- King County · 2,251,916 people
- City population
- 62,839
- Metro
- Seattle-Tacoma-Bellevue, WA
- Population (ZIP)
- 27,311
- Household income
- $76,438
- Rent vs Own
- Severe rent burden
- 1341.0
Population outlook (King County) Hauer SSP2
- Today (2025)
- 2,576,485 people
- By 2030
- 2,803,316 · +8.8%
- By 2040
- 3,255,921 · +26.4%
- By 2050
- 3,706,444 · +43.9%
- By 2075
- 4,746,063 · +84.2%
- By 2100
- 5,407,730 · +109.9%
Race, ethnicity, and origin ACS 2023
- Neighborhood character
- Highly diverse neighborhood (Simpson 0.79)
- Race & ethnicity
- White 28% Black 26% Hispanic / Latino 21% Asian 15% Two or more races 10% Pacific Islander 3%
- Hispanic origin (detail)
- Mexican 16%
- Common ancestry
- Lithuanian 2% Portuguese 2% Italian 1%
- Foreign-born
- 41% · Canada, Vietnam, Philippines
- Languages at home
- 52% English-only · Spanish 15% Other Asian/Pacific 6% Other Indo-European 3%
Political lean MEDSL · King
- 2024 margin
- Solid D (+51.7) · D 74.2% · R 22.5% · Other 3.4%
- 2008→2024 swing
- +9.6pp toward D · 2008: 42.1pp · 2024: 51.7pp
- All cycles
- 2024: D+51.7 2020: D+52.7 2016: D+50.4 2012: D+39.9 2008: D+42.1
Not yet ingested
- Civics
- —
Market trends
- HPI YoY
- ▼ -595.95%
- Current HPI
- 334.4203
- Rent YoY
- ▼ -0.68%
- Metro
- Seattle-Tacoma-Bellevue, WA
- State GDP YoY
- ▲ 4.65%
- F500 in state
- 22
Industry mix (Fortune 500 HQ in WA)
| Industry | F500 HQs | Revenue |
|---|---|---|
| Retail | 2 | $269B |
|
||
| Technology / Retail | 1 | $638B |
|
||
| Technology | 1 | $245B |
|
||
| Telecommunications | 1 | $38B |
|
||
| Food / Beverage | 1 | $36B |
|
||
| Automotive / Trucks | 1 | $34B |
|
||
Price history
-10.5% since first listed4 events — show timeline
- 2026-03-10 Price Changed $34,900 NWMLS as Distributed by MLS Grid
- 2026-02-13 Relisted — NWMLS as Distributed by MLS Grid
- 2026-02-10 Pending — NWMLS as Distributed by MLS Grid
- 2025-11-07 Listed $39,000 NWMLS as Distributed by MLS Grid
Cash-flow waterfall
monthlySold comps — $/sqft
last 12 mo · ≤1 miLoading sold comps…