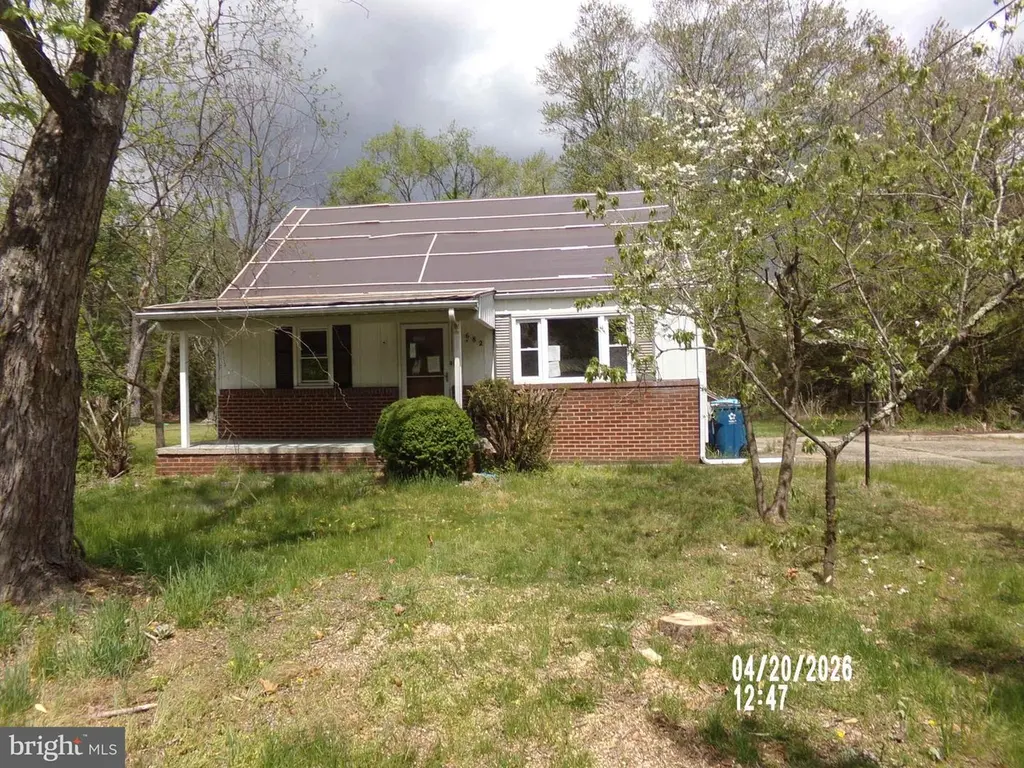
682 Jackson Rd · Atco, NJ
Flood risk 1/10 · Minimal
- FEMA flood zone
- X (unshaded)
- Chance of flooding over 30 yrs
- 0.0%
- Est. flood insurance / yr
- $507 – $1,088
Fire risk 6/10 · Moderate
- Est. fire insurance / yr
- $526 – $976
Heat risk 6/10 · Moderate
- Hot days now (above 104°F)
- 7 days/yr
- Hot days in 30 yrs
- 15 days/yr
Wind risk 6/10 · Moderate
- Chance of severe wind over 30 yrs
- 65.0%
Air-quality risk 4/10 · Minor
- Unhealthy air days now
- 4 days/yr
- Unhealthy air days in 30 yrs
- 6 days/yr
Risk factors via First Street. Map © Google.
Why this score? — see what drove the C grade
The composite is a weighted blend of 9 inputs, each scored 0–100. Each bar is that input's sub-score; the figure is the points it added to the 100-point composite (weight × sub-score).
- Cash flow +19.6/30.0
- ARV discount +15.0/15.0
- 1% rule +6.6/10.0
- DSCR +6.2/10.0
- Schools +2.8/10.0
- Rent growth +2.5/5.0
- Livability +2.5/5.0
- Condition / age +2.5/5.0
- Appreciation +0.0/10.0
$210,000
🖨 Deal sheet (PDF) 📄 Offer letter ✓ Due diligence
Listing remarks MLS
Retired, And Tired Of Working Around The House-Want To Sell As-Is. Recent Work Includes Newer Roof, Newer Well/Water Treatment System, Newer Wiring, Some New Windows. Great Opportunity. Beautiful 1 Acre Lot. Call Today! Poss:Settlement
Key facts
- Second floor
- First floor bedroom
- 1 acre lot
Tags
Property features AI
Exterior
- Parking: Driveway parking (3 spaces)
- Utilities: Well water; On-site septic; Electric available; Municipal trash service
- Home design: Detached structure; Two floors; Main entrance faces east; Fee simple ownership
- Construction: Frame construction; Asphalt roof; Block foundation; Building winterized; Estimated year built
- Exterior features: Outbuilding(s); Crushed stone driveway
Interior
- Bedrooms: One bedroom on the main level; Two bedrooms on the upper level
- Flooring: Hardwood flooring; Laminate flooring; Vinyl flooring
- Bathrooms: Two full bathrooms (one on main level, one on upper level)
- Heating & cooling: Oil heating; Oil hot water
- Interior features: Dry wall walls and ceilings; Basement with poured concrete
Neighborhood map
What this means for you Summary
Snapshot
- This is a 3-bed/2.0-bath single-family listed at $210k.
Deal economics
- At list price, monthly cash flow is $240 ($3k/yr) — positive.
- The deal already cash-flows at list — no discount required.
- Meets the 1% rule at list price ($2k rent vs $210k).
- Recommended offer: $204k (3.0% below list) — sets the bar for market timing.
- Cap rate 7.7% vs local median 4.0% in Atco — top-decile yield for the area; either an underpriced asset or a hidden risk that comps aren't pricing in. Stress-test before assuming the spread holds.
Location & tenants
- Location reads: area grade C — affects rentability + tenant quality, not the cash-flow math above.
- Waterford Township School District (suburban): math 22% / reading 35% proficiency, ranked #334 of 472 in NJ (top 71%) — low school quality limits family demand, transient renter base, plan for 1-2y turnover.
- Zoned schools: Thomas Richards Early Childhood Center (267 students, 21% FRL); Waterford Elementary School (math 23% / reading 36%, grade F, #731 of 1,303 statewide, top 59%, 466 students, 20% FRL) — zoned schools at 21% FRL track the district average.
- Market conditions: 53 active listings in the ZIP; 1,018 units permitted in Camden County in 2024 (509 in 5+ unit buildings).
Forward outlook
- Local home prices are declining (-3.0%/yr); year-one equity from $1k of loan paydown is wiped out by about $6k of value loss. Plan a longer hold.
- Camden County population projected to shrink 8% by 2050 — rents likely to lag national; underwrite the cash flow, not the appreciation.
Negotiation context
- It's been on market 43 days — a 3% lower offer ($204k) is reasonable based on typical stale-listing flexibility.
- 2 sale attempts since 28y ago with the ask held roughly flat each time — persistent listings suggest the price (not the market) is what's stuck; bring a comps-based counter.
- Current owner paid $88k; list at $210k implies a 139% gain — meaningful room to come down on a strong offer.
Risks & watch-outs
- Watch-outs: property tax is 2.8% of price.
- Climate carrying-cost: major wind risk, 65% chance of damaging wind over 30y; major wildfire risk; extreme-heat days projected 7→15/yr by 2055 (HVAC capex compounding) — expect insurance premiums to compound above CPI over the hold.
Questions for the listing agent
- It's been on market 43 days. Have you received any prior offers? Is the seller open to a 3% concession, seller financing, or rate buy-down credit?
- Built in 1960 — when were the roof, HVAC, electrical panel, plumbing, and water heater last replaced?
- Property tax is high relative to price — has the assessment been appealed recently, and will the sale trigger a re-assessment?
- Is there a deadline driving the sale (1031 exchange, divorce, estate, relocation)? That informs how much negotiation room exists.
- What's the average days-on-market for RENTAL listings here right now (not sales)? A rising rental-DOM trend means longer vacancies and softer asking-rent achievability than the comps imply.
- What's the recent tenant-quality profile in this submarket — average credit score on applications, eviction rate, late-payment / NSF rate, and stable-employment percentage? A property-management company in the area should have these aggregated.
- How much new for-sale + rental construction is in the pipeline within 1–3 miles? Heavy new supply typically softens prices + rents 12–24 months out; constrained supply supports both.
Investment metrics
- 1% rule
- 1.16% ✓
- Cap rate
- 7.67%
- Cash-on-cash
- 4.91%
- DSCR
- 1.22
- GRM
- 7.2
CMA / ARV
- ARV (on-the-fly)
- $335,790
- Comps found
- 1
Show comp detail 1 sale within ~0.75 mi
| Address | Dist | Beds/Ba | Sqft | Sold | Price | $/sf | Match |
|---|---|---|---|---|---|---|---|
| 2410 Louden Ln | 0.22mi | 3/1.0 | 1,284 (+4%) | 17mo | $350,000 | $273 | 64 |
Match score weights: distance 35% · size 25% · config 20% · recency 20%. Top-matched comps best support the ARV.
Projected returns pro-forma
-3.0% appreciation · 3.0% rent growth · sell at horizon
- IRR
- -8.6%
- Equity multiple
- 0.68×
- Total profit
- $-18,541
- Equity at exit
- $31,312
- IRR
- 1.0%
- Equity multiple
- 1.07×
- Total profit
- $4,298
- Equity at exit
- $18,157
Cash invested: $58,800 (down + closing). Projections, not guarantees.
Landlord ↔ Tenant lean methodology
- Overall (STATE)
- 21 Tenant-Leaning
- State New Jersey
- 21 Tenant-Leaning · D+6
- County
- — inherits STATE
- City
- — inherits STATE
ZIP-level market 08004
- Home prices YoY
- -15.5%
- Active inventory
- 53
- Price-to-rent
- 7.2×
Monthly cashflow live
- Estimated rent
- $2,436 medium interval (Pro) →
- Mortgage (P&I)
- −$1,101
- Tax from tax record
- −$496 /mo · $5,946/yr
- Insurance
- −$88
- HOA
- −$0
- Vacancy / Maint / Mgmt
- −$512
- Net cashflow
- $240
Break-even live
Sensitivity live
| Price | -10% $359 | -5% $300 | +0% $240 | +5% $181 | +10% $121 |
|---|---|---|---|---|---|
| Rent | -10% $48 | -5% $144 | +0% $240 | +5% $337 | +10% $433 |
| Rate | -1.0pp $346 | -0.5pp $294 | base $240 | +0.5pp $186 | +1.0pp $131 |
UW: 25.0% down · 7.5% · 30yr · 1.5% tax · 5.0% vac · 8.0% maint · 8.0% mgmt
Financing live
Cash to close
- Down payment
- $52,500
- Closing costs
- $6,300
- Reserves months
- —
- Total cash needed
- —
Loan-product check · same deal, 3 products live
Conventional
25% down · 7.5% · 30yr
- Down + closing
- —
- Monthly P&I
- —
- Monthly cashflow
- —
- DSCR
- —
- Eligible?
- —
Personal DTI + credit; lowest rate.
DSCR
20% down · 8.5% · 30yr
- Down + closing
- —
- Monthly P&I
- —
- Monthly cashflow
- —
- DSCR
- —
- Eligible?
- —
No personal income docs; deal must DSCR.
Hard money
10% down · 12.0% · 12mo
- Down + closing
- —
- Monthly P&I
- —
- Monthly cashflow
- —
- DSCR
- —
- Eligible?
- —
Short-term bridge; refi at stabilization.
Listing history 10 events
-
2026-06-04status $210,000 Pending 43 DOM
-
2026-06-03days on market $210,000 Active 43 DOM
-
2026-06-02days on market $210,000 Active 42 DOM
-
2026-06-01days on market $210,000 Active 41 DOM
-
2026-05-31days on market $210,000 Active 40 DOM
-
2026-04-21$210,000 Active
-
1999-01-21soldstatus $88,000
-
1998-12-15soldstatus $88,000 235-char remark
Show marketing remark (235 chars)
Retired, And Tired Of Working Around The House-Want To Sell As-Is. Recent Work Includes Newer Roof, Newer Well/Water Treatment System, Newer Wiring, Some New Windows. Great Opportunity. Beautiful 1 Acre Lot. Call Today! Poss:Settlement
-
1998-11-06historical 235-char remark
Show marketing remark (235 chars)
Retired, And Tired Of Working Around The House-Want To Sell As-Is. Recent Work Includes Newer Roof, Newer Well/Water Treatment System, Newer Wiring, Some New Windows. Great Opportunity. Beautiful 1 Acre Lot. Call Today! Poss:Settlement
-
1998-08-05$88,000 235-char remark
Show marketing remark (235 chars)
Retired, And Tired Of Working Around The House-Want To Sell As-Is. Recent Work Includes Newer Roof, Newer Well/Water Treatment System, Newer Wiring, Some New Windows. Great Opportunity. Beautiful 1 Acre Lot. Call Today! Poss:Settlement
ⓘ Source: listings_history table (triggers on properties + properties_extension) + one-shot
backfill from property_details.listing_events for pre-trigger history.
Tax reassessment forecast NJ · Partial reset (capped growth)
- Current annual tax
- $5,946 · $496/mo
- Projected year-2 tax
- $5,946 · $496/mo
- Expected delta
- $0/yr ($0/mo · 0.0%)
ⓘ Screening estimate from a state-policy table — verify with the county assessor before closing.
Climate risk First Street
- Flood 1/10 Low FEMA zone X (unshaded) · 0% chance over 30 yrs
- Wildfire 6/10 Major
- Heat 6/10 Major 7 d/yr ≥104°F today · 15 d/yr by 30 yrs out
- Wind 6/10 Major 65% chance of damaging wind over 30 yrs
- Air quality 4/10 Moderate 4 unhealthy d/yr today · 6 by 30 yrs out
Nearby sold comps map
Loading sold comps map…
Walkable amenities ~0.75 mi
Loading nearby amenities…
Taxation est. · year 1
- Rental income
- $29,235
- − Mortgage interest
- −$11,763
- − Property taxes
- −$5,946
- − Insurance
- −$1,050
- − Repairs & maintenance
- −$2,339
- − Management
- −$2,339
- − Depreciation
- −$6,109
- Taxable loss
- −$311
- Est. tax savings @ 24.0%
- +$75
- After-tax cash flow
- $2,959/yr
For passive investors: Depreciation is non-cash, so a rental often shows a tax loss while cash-flowing — sheltering income. Rental losses are passive: they offset passive income freely, and up to $25,000/yr can offset ordinary (W-2) income if you actively participate and your MAGI is under $100k (phasing out to $0 by $150k); unused losses carry forward. On sale, claimed depreciation is recaptured at up to 25%, and gains may owe capital-gains tax (a 1031 exchange can defer both). Figures are a year-1 estimate at your 24.0% rate — not tax advice; consult a CPA.
Schools (NCES district)
- District
- Waterford Township School District
- NCES district ID
- 3417250
- Math proficiency
- 22% ▼ -17.00%
- Reading proficiency
- 35% ▼ -7.00%
- Median HH income
- $77,964
- Composite
- 27.58/100
- National rank
- #6939
- State rank
- #334 of 472 in NJ
Livability — Atco
No livability data for this city. (Only ~50 U.S. cities are tracked.)
Census & demographics
- Census place
- Atco, NJ
- City population
- 10,946
- Population (ZIP)
- 10,946
Population outlook (Camden County) Hauer SSP2
- Today (2025)
- 507,964 people
- By 2030
- 502,182 · -1.1%
- By 2040
- 485,602 · -4.4%
- By 2050
- 465,630 · -8.3%
- By 2075
- 419,986 · -17.3%
- By 2100
- 369,492 · -27.3%
Race, ethnicity, and origin ACS 2023
- Neighborhood character
- Predominantly White (75%)
- Race & ethnicity
- White 75% Black 11% Hispanic / Latino 9% Two or more races 8%
- Hispanic origin (detail)
- Mexican 1% Puerto Rican 6% Dominican 2%
- Common ancestry
- Romanian 8% Serbian 2% Iranian 1%
- Foreign-born
- 2% · Canada, China
- Languages at home
- 93% English-only · Spanish 4% Other Indo-European 1%
Political lean MEDSL · Camden
- 2024 margin
- Strong D (+27.4) · D 63.0% · R 35.5% · Other 1.5%
- 2008→2024 swing
- -8.8pp toward R · 2008: 36.2pp · 2024: 27.4pp
- All cycles
- 2024: D+27.4 2020: D+33.5 2016: D+32.4 2012: D+36.6 2008: D+36.2
Not yet ingested
- Civics
- —
Market trends
- HPI YoY
- ▼ -60.00%
- Current HPI
- 325.9847
- Rent YoY
- —
- Metro
- —
- State GDP YoY
- ▲ 2.05%
- F500 in state
- 34
Industry mix (Fortune 500 HQ in NJ)
| Industry | F500 HQs | Revenue |
|---|---|---|
| Consumer Goods | 3 | $31B |
|
||
| Pharmaceuticals | 2 | $153B |
|
||
| Technology | 2 | $21B |
|
||
| Insurance | 2 | $20B |
|
||
| Healthcare | 2 | $19B |
|
||
| Financial Services | 1 | $70B |
|
||
Price history
+138.6% since first listed5 events — show timeline
- 2026-04-21 Listed $210,000 BRIGHT MLS
- 1999-01-21 Sold (Public Records) $88,000 Public Records
- 1998-12-15 Sold (MLS) $88,000 BRIGHT MLS
- 1998-11-06 Listing Removed — BRIGHT MLS
- 1998-08-05 Listed $88,000 BRIGHT MLS
Property tax history
+2.0%/yrLatest (2025): $5,946 · +3.5% YoY. Source: county tax records.
Cash-flow waterfall
monthlySold comps — $/sqft
last 12 mo · ≤1 miLoading sold comps…