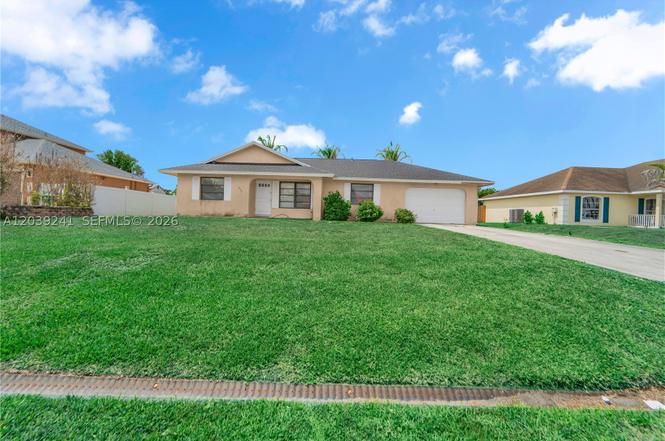
1074 SW Alcantarra · Port St. Lucie, FL
Flood risk 1/10 · Minimal
- FEMA flood zone
- X (unshaded)
- Chance of flooding over 30 yrs
- 0.0%
- Est. flood insurance / yr
- $507 – $1,088
Fire risk 1/10 · Minimal
- Est. fire insurance / yr
- $947 – $1,759
Heat risk 10/10 · Severe
- Hot days now (above 106°F)
- 7 days/yr
- Hot days in 30 yrs
- 25 days/yr
Wind risk 10/10 · Severe
- Chance of severe wind over 30 yrs
- 99.0%
Air-quality risk 1/10 · Minimal
- Unhealthy air days now
- 0 days/yr
- Unhealthy air days in 30 yrs
- 0 days/yr
Risk factors via First Street. Map © Google.
Why this score? — see what drove the D+ grade
The composite is a weighted blend of 9 inputs, each scored 0–100. Each bar is that input's sub-score; the figure is the points it added to the 100-point composite (weight × sub-score).
- Cash flow +16.9/30.0
- ARV discount +8.7/15.0
- DSCR +5.3/10.0
- Schools +3.7/10.0
- 1% rule +3.5/10.0
- Rent growth +2.6/5.0
- Livability +2.5/5.0
- Condition / age +2.5/5.0
- Appreciation +0.0/10.0
$340,000
🖨 Deal sheet 📄 Offer letter ✓ Due diligence
Listing remarks MLS
LOOKING FOR AN UPDATED HOUSE FROM HEAD TO TOE AT A GREAT PRICE-WELL YOUR SEARCH IS OVER...THIS 3/2 HAS IT ALL..NEW CERAMIC TILE THROUGHOUT,BIG LIVING AREA,DINING RM,NEW PAINT, NEW FIXTURES,KITCHEN HAS EATIN AREA,MAPLEWOOD CABINETS, GRANITE COUNTERTOPS,HIGH HAT LIGHTING, BIG KITCHEN CLOSET,DOUBLE SINKS,2 CAR GARAGE,VAC SYSTEM,150 AMP PANEL,NEW VANITY AND TOLIETS IN BATH RMS, OUTSIDE PATIO-HUGE FENCED IN YARD,WITH PLENTY OF ROOM FOR A POOL, SPRINKLER SYSTEM..NO FLOOD ZONE!! NO HOA FEES!!THIS PROPERTY IS JUST LIKE NEW!!COME SEE FOR YOURSELF..BRING US YOUR OFFERS.
Key facts
- Breakfast nook
- Tile flooring
- Expansive backyard
Tags
Property features AI
Finance
- Other: Zoning: RS-2 PSL; Quarter to half acre lot
Exterior
- Parking: 1-car garage; Driveway; 1 covered parking space
- Utilities: Public water; Public sewer
- Home design: Single-story; Faces northeast
- Construction: Block construction; Flat and tile roof
- Exterior features: Storm/security shutters
Interior
- Kitchen: Dishwasher; Electric range; Self-cleaning oven; Microwave; Refrigerator
- Bedrooms: Bedroom on main level
- Flooring: Tile
- Bathrooms: 2 full bathrooms
- Heating & cooling: Central heating; Central air; Ceiling fan(s)
- Interior features: First floor entry; Bedroom on main level; Walk-in closet(s)
- Laundry & utility: Washer and dryer; Laundry in garage
Neighborhood map
What this means for you Summary
Snapshot
- This is a 3-bed/2.0-bath single-family listed at $340k.
Deal economics
- At list price, monthly cash flow is $225 ($3k/yr) — positive.
- The deal already cash-flows at list — no discount required.
- To meet the 1% rule (rent ≥ 1% of price), the offer needs to be $289k (15.1% below list).
- Recommended offer: $289k (15.1% below list) — sets the bar for 1% rule.
- Cap rate 7.1% vs local median 3.9% in Port St. Lucie — top-decile yield for the area; either an underpriced asset or a hidden risk that comps aren't pricing in. Stress-test before assuming the spread holds.
Location & tenants
- Location reads: area grade D — affects rentability + tenant quality, not the cash-flow math above.
- St. Lucie (urban): math 40% / reading 48% proficiency, ranked #51 of 73 in FL (top 70%) — families likely to look elsewhere, expect single-tenant / working-renter base with shorter leases.
- Market conditions: Rents flat; 758 active listings in the ZIP; 12 comparable units currently listed for rent nearby; rentals at typical pace (median 23d on market — plan ~3-4 weeks tenant-placement turnaround); solid renter incomes; 4,868 units permitted in St. Lucie County in 2024 (268 in 5+ unit buildings).
- This rent runs 40% of the median local income ($86k/yr) — at the standard rent-burdened threshold; future hikes will face affordability resistance.
Forward outlook
- Local home prices are declining (-3.0%/yr); year-one equity from $2k of loan paydown is wiped out by about $10k of value loss. Plan a longer hold.
- St. Lucie County population projected at +20% by 2050 — long-run rental-demand tailwind backs the buy-and-hold thesis.
Negotiation context
- Only 1 days on market — expect competitive offers; lowballing is unlikely to land.
- 5 sale attempts since 21y ago with the ask held roughly flat each time — persistent listings suggest the price (not the market) is what's stuck; bring a comps-based counter.
- Current owner paid $95k; list at $340k implies a 258% gain — meaningful room to come down on a strong offer.
Risks & watch-outs
- Climate carrying-cost: severe wind risk, 99% chance of damaging wind over 30y; extreme-heat days projected 7→25/yr by 2055 (HVAC capex compounding) — expect insurance premiums to compound above CPI over the hold.
Questions for the listing agent
- Is there a deadline driving the sale (1031 exchange, divorce, estate, relocation)? That informs how much negotiation room exists.
- The area grade is low — what's the realistic commute time and amenity access for the typical tenant pool here? Any planned neighborhood developments (good or bad) we should know about?
- What's the average days-on-market for RENTAL listings here right now (not sales)? A rising rental-DOM trend means longer vacancies and softer asking-rent achievability than the comps imply.
- What's the recent tenant-quality profile in this submarket — average credit score on applications, eviction rate, late-payment / NSF rate, and stable-employment percentage? A property-management company in the area should have these aggregated.
- How much new for-sale + rental construction is in the pipeline within 1–3 miles? Heavy new supply typically softens prices + rents 12–24 months out; constrained supply supports both.
Investment metrics
- 1% rule
- 0.85% ✗
- Cap rate
- 7.09%
- Cash-on-cash
- 2.83%
- DSCR
- 1.13
- GRM
- 9.8
CMA / ARV
- ARV (on-the-fly)
- $349,002
- Comps found
- 9
Show comp detail 9 sales within ~0.75 mi
| Address | Dist | Beds/Ba | Sqft | Sold | Price | $/sf | Match |
|---|---|---|---|---|---|---|---|
| 1097 SW Majorca Ave | 0.13mi | 3/2.0 | 1,264 (+2%) | 4mo | $275,000 | $218 | 88 |
| 1092 SW Alcantarra Blvd | 0.05mi | 3/2.0 | 1,337 (+8%) | 1mo | $325,000 | $243 | 84 |
| 1008 SW Liberty Ave | 0.15mi | 3/2.0 | 1,247 (+0%) | 16mo | $350,000 | $281 | 79 |
| 1226 SW Emerald Ave | 0.46mi | 3/2.0 | 1,312 (+6%) | 3mo | $379,000 | $289 | 66 |
| 902 SW Mccracken Ave | 0.44mi | 3/2.0 | 1,243 (+0%) | 16mo | $379,990 | $306 | 66 |
| 1013 SW Mataro Ave | 0.25mi | 2/2.0 (-1) | 1,120 (-10%) | 5mo | $255,000 | $228 | 63 |
| 1022 SW Deauville Ave | 0.37mi | 4/2.0 (+1) | 1,270 (+2%) | 15mo | $393,900 | $310 | 62 |
| 826 SW Trouville Ave | 0.48mi | 3/2.0 | 1,370 (+10%) | 16mo | $349,999 | $255 | 47 |
| 869 SW Mccomb Ave | 0.56mi | 2/2.0 (-1) | 1,147 (-8%) | 20mo | $325,000 | $283 | 40 |
Match score weights: distance 35% · size 25% · config 20% · recency 20%. Top-matched comps best support the ARV.
Projected returns pro-forma
-3.0% appreciation · 0.22% rent growth · sell at horizon
- IRR
- -14.7%
- Equity multiple
- 0.49×
- Total profit
- $-48,782
- Equity at exit
- $50,695
- IRR
- -10.8%
- Equity multiple
- 0.42×
- Total profit
- $-55,113
- Equity at exit
- $29,397
Cash invested: $95,200 (down + closing). Projections, not guarantees.
Landlord ↔ Tenant lean methodology
- Overall (STATE)
- 87 Strongly Landlord-Friendly
- State Florida
- 87 Strongly Landlord-Friendly · R+3
- County
- — inherits STATE
- City
- — inherits STATE
ZIP-level market 34953
- Home prices YoY
- -10.1%
- Rents YoY
- 0.2%
- Active inventory
- 758
- Price-to-rent
- 9.8×
Monthly cashflow live
- Estimated rent
- $2,887 high interval (Pro) →
- Mortgage (P&I)
- −$1,783
- Tax from tax record
- −$132 /mo · $1,581/yr
- Insurance
- −$142
- HOA
- −$0
- Vacancy / Maint / Mgmt
- −$606
- Net cashflow
- $225
Break-even live
UW: 25.0% down · 7.5% · 30yr · 1.5% tax · 5.0% vac · 8.0% maint · 8.0% mgmt
Financing live
Cash to close
- Down payment
- $85,000
- Closing costs
- $10,200
- Reserves months
- —
- Total cash needed
- —
Loan-product check · same deal, 3 products live
Conventional
25% down · 7.5% · 30yr
- Down + closing
- —
- Monthly P&I
- —
- Monthly cashflow
- —
- DSCR
- —
- Eligible?
- —
Personal DTI + credit; lowest rate.
DSCR
20% down · 8.5% · 30yr
- Down + closing
- —
- Monthly P&I
- —
- Monthly cashflow
- —
- DSCR
- —
- Eligible?
- —
No personal income docs; deal must DSCR.
Hard money
10% down · 12.0% · 12mo
- Down + closing
- —
- Monthly P&I
- —
- Monthly cashflow
- —
- DSCR
- —
- Eligible?
- —
Short-term bridge; refi at stabilization.
Rent comps 12 comps
| Address | Beds | Baths | Sqft | Rent | $/sqft | DOM | Units | Dist |
|---|---|---|---|---|---|---|---|---|
| 1025 SW Majorca Ave Port Saint Lucie, FL | 3.0 | 2.0 | 1480 | $3,300 | $2.23 | 23d | 1 | 0.12mi |
| 902 SW McCracken Ave Port St. Lucie, FL | 3.0 | 2.0 | 1245 | $2,800 | $2.25 | 23d | 1 | 0.42mi |
| 1021 SW Dubois Ave Port Saint Lucie, FL | 3.0 | 2.0 | 1331 | $2,400 | $1.80 | 23d | 1 | 0.76mi |
| 273 SW Sterret Cir Port St. Lucie, FL | 2.0 | 1.0 | 933 | $1,775 | $1.90 | 23d | 1 | 0.86mi |
| 3201 SW Collings Dr Port Saint Lucie, FL | 3.0 | 2.0 | 1389 | $2,616 | $1.88 | 13d | 1 | 0.96mi |
| 1342 SW Wampler Ave Port Saint Lucie, FL | 3.0 | 2.0 | 1282 | $2,400 | $1.87 | 23d | 1 | 0.96mi |
| 602 SW Jeanne St Port Saint Lucie, FL | 3.0 | 2.0 | 1061 | $2,100 | $1.98 | 23d | 1 | 1.02mi |
| 3912 SW McCrory St Port Saint Lucie, FL | 3.0 | 2.0 | 1159 | $2,350 | $2.03 | 23d | 1 | 1.05mi |
| 449 SW Fifer Ave Port Saint Lucie, FL | 3.0 | 2.0 | 1435 | $2,500 | $1.74 | 13d | 1 | 1.15mi |
| 962 SW Kappa Ave Port Saint Lucie, FL | 3.0 | 2.0 | 1275 | $3,000 | $2.35 | 23d | 1 | 1.38mi |
| 4262 SW Jared St Port Saint Lucie, FL | 3.0 | 2.0 | 1240 | $2,350 | $1.90 | 23d | 1 | 1.43mi |
| 353 SW Belmont Cir Port Saint Lucie, FL | 3.0 | 2.0 | 1176 | $2,095 | $1.78 | 23d | 1 | 1.49mi |
Listing history 2 events
-
2026-06-18remarks 693-char remark
-
2026-06-18$340,000 Active 1 DOM
ⓘ Source: listings_history table (triggers on properties + properties_extension) + one-shot
backfill from property_details.listing_events for pre-trigger history.
Tax reassessment forecast FL · Resets to sale price
- Current annual tax
- $1,581 · $132/mo
- Projected year-2 tax
- $2,822 · $235/mo
- Expected delta
- +$1,241/yr (+$103/mo · 78.5%)
ⓘ Screening estimate from a state-policy table — verify with the county assessor before closing.
Climate risk First Street
- Flood 1/10 Low FEMA zone X (unshaded) · 0% chance over 30 yrs
- Wildfire 1/10 Low
- Heat 10/10 Extreme 7 d/yr ≥106°F today · 25 d/yr by 30 yrs out
- Wind 10/10 Extreme 99% chance of damaging wind over 30 yrs
- Air quality 1/10 Low 0 unhealthy d/yr today · 0 by 30 yrs out
Nearby sold comps map
Loading sold comps map…
Walkable amenities ~0.75 mi
Loading nearby amenities…
Taxation est. · year 1
- Rental income
- $34,649
- − Mortgage interest
- −$19,045
- − Property taxes
- −$1,581
- − Insurance
- −$1,700
- − Repairs & maintenance
- −$2,772
- − Management
- −$2,772
- − Depreciation
- −$9,891
- Taxable loss
- −$3,112
- Est. tax savings @ 24.0%
- +$747
- After-tax cash flow
- $3,443/yr
For passive investors: Depreciation is non-cash, so a rental often shows a tax loss while cash-flowing — sheltering income. Rental losses are passive: they offset passive income freely, and up to $25,000/yr can offset ordinary (W-2) income if you actively participate and your MAGI is under $100k (phasing out to $0 by $150k); unused losses carry forward. On sale, claimed depreciation is recaptured at up to 25%, and gains may owe capital-gains tax (a 1031 exchange can defer both). Figures are a year-1 estimate at your 24.0% rate — not tax advice; consult a CPA.
Schools (NCES district)
- District
- St. Lucie
- NCES district ID
- 1201770
- Math proficiency
- 40% ▼ -11.00%
- Reading proficiency
- 48% ▼ -4.00%
- Median HH income
- $44,737
- Composite
- 37.28/100
- National rank
- #4449
- State rank
- #51 of 73 in FL
Livability — Port St. Lucie
No livability data for this city. (Only ~50 U.S. cities are tracked.)
Census & demographics
- Census place
- Port St. Lucie, FL
- County
- Saint Lucie County · 337,150 people
- City population
- 221,051
- Metro
- Port St. Lucie, FL
- Population (ZIP)
- 86,875
- Household income
- $85,667
- Rent vs Own
- Severe rent burden
- 857.0
Population outlook (St. Lucie County) Hauer SSP2
- Today (2025)
- 338,016 people
- By 2030
- 355,687 · +5.2%
- By 2040
- 385,521 · +14.1%
- By 2050
- 406,106 · +20.1%
- By 2075
- 441,054 · +30.5%
- By 2100
- 436,885 · +29.2%
Race, ethnicity, and origin ACS 2023
- Neighborhood character
- Diverse neighborhood (Simpson 0.69)
- Race & ethnicity
- White 42% Hispanic / Latino 28% Black 23% Two or more races 15% Asian 2%
- Hispanic origin (detail)
- Mexican 2% Puerto Rican 8% Cuban 4% Dominican 3%
- Common ancestry
- Hispanic 4% Romanian 2% Estonian 2%
- Foreign-born
- 24% · Canada, Jamaica, China
- Languages at home
- 69% English-only · Spanish 19% French/Haitian/Cajun 6% Other Indo-European 3%
Political lean MEDSL · St. Lucie
- 2024 margin
- Lean R (+9.1) · D 45.1% · R 54.2%
- 2008→2024 swing
- -21.2pp toward R · 2008: 12.1pp · 2024: -9.1pp
- All cycles
- 2024: R+9.1 2020: R+1.6 2016: R+2.5 2012: D+7.9 2008: D+12.1
Not yet ingested
- Civics
- —
Market trends
- HPI YoY
- ▼ -44.19%
- Current HPI
- 392.7681
- Rent YoY
- ▲ 0.22%
- Metro
- Port St. Lucie, FL
- State GDP YoY
- ▲ 3.28%
- F500 in state
- 36
Industry mix (Fortune 500 HQ in FL)
| Industry | F500 HQs | Revenue |
|---|---|---|
| Industrial Technology | 2 | $29B |
|
||
| Insurance | 2 | $17B |
|
||
| Retail | 1 | $60B |
|
||
| Technology Distribution | 1 | $58B |
|
||
| Homebuilding | 1 | $35B |
|
||
| Technology Manufacturing | 1 | $35B |
|
||
Price history
+467.6% since first listed16 events — show timeline
- 2026-06-17 Listed $340,000 MARMLS
- 2017-05-25 Listing Removed — Beaches MLS
- 2009-07-02 Sold (Public Records) $95,000 Public Records
- 2009-06-25 Sold (MLS) $95,000 Beaches MLS
- 2009-05-22 Listing Removed — Beaches MLS
- 2009-05-09 Listed $98,000 Beaches MLS
- 2008-12-08 Sold (MLS) $65,000 Beaches MLS
- 2008-11-13 Listing Removed — Beaches MLS
- 2008-11-06 Listed $65,000 Beaches MLS
- 2007-10-27 Listed $120,000 Beaches MLS
- 2005-10-04 Sold (Public Records) $215,000 Public Records
- 2005-09-30 Sold (MLS) $215,000 Beaches MLS
- 2005-09-21 Listing Removed — Beaches MLS
- 2005-08-21 Listed $215,000 Beaches MLS
- 2003-01-14 Sold (Public Records) $67,300 Public Records
- 1995-12-20 Sold (Public Records) $59,900 Public Records
Property tax history
+2.7%/yrLatest (2025): $1,581 · +4.5% YoY. Source: county tax records.
Cash-flow waterfall
monthlySold comps — $/sqft
last 12 mo · ≤1 miLoading sold comps…