400 Adell Cir · Garner, TX
Flood risk No data
- FEMA flood zone
- —
- Chance of flooding over 30 yrs
- —
- Est. flood insurance / yr
- —
Fire risk No data
- Est. fire insurance / yr
- —
Heat risk No data
- Hot days now (above threshold)
- —
- Hot days in 30 yrs
- —
Wind risk No data
- Chance of severe wind over 30 yrs
- —
Air-quality risk No data
- Unhealthy air days now
- —
- Unhealthy air days in 30 yrs
- —
Risk factors via First Street. Map © Google.
Why this score? — see what drove the D+ grade
The composite is a weighted blend of 9 inputs, each scored 0–100. Each bar is that input's sub-score; the figure is the points it added to the 100-point composite (weight × sub-score).
- Cash flow +19.0/30.0
- DSCR +6.0/10.0
- ARV discount +5.0/15.0
- 1% rule +4.3/10.0
- Schools +4.3/10.0
- Rent growth +2.5/5.0
- Livability +2.5/5.0
- Condition / age +2.5/5.0
- Appreciation +0.0/10.0
$539,000
🖨 Deal sheet (PDF) 📄 Offer letter ✓ Due diligence
Listing remarks
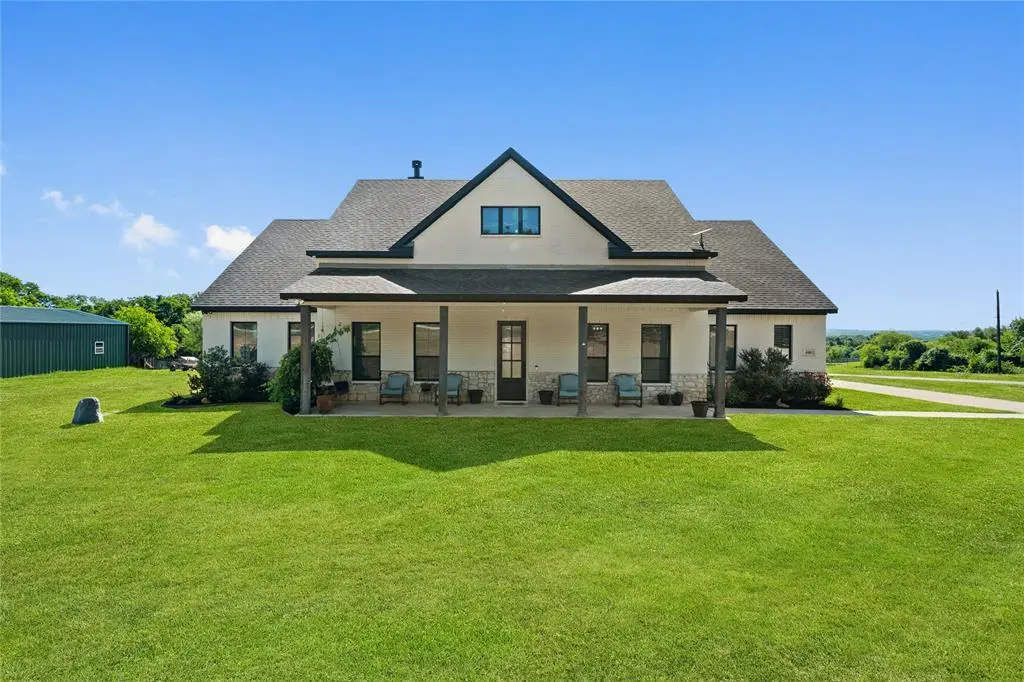
This stunning 2021-built masterpiece blends sophisticated design with freedom and functionality. From the moment you arrive, the gorgeous brick exterior with stone accents and generous covered front porch invite you to slow down and stay awhile. Inside, the thoughtfully designed floor plan offers 4 spacious bedrooms and 3 full baths, with finishes that impress at every turn. The heart of the home is a true gourmet kitchen. Its sleek black cabinetry, double ovens, and a layout made for the home chef who loves to entertain and the family that loves to gather. Built with long-term comfort in mind, this home features full interior winterization completed during construction, so you'll stay warm
Key facts
- Covered front porch
- Gourmet kitchen
- Stone accents
Tags
Property features AI
Finance
- Other: Lot of approximately 2.0013 acres (will not subdivide); Directions: From FM 920 head NW to FM 1885 and go west to Adell Circle and turn right. The property will be on your right.; Exclusions: Refrigerator, electric fence.
- Financial info: Listing accepts Cash, Conventional, FHA, VA Assumable, and VA Loan
- HOA & community: No association
Exterior
- Parking: Attached garage with 3 garage spaces; Covered parking for 3 vehicles; Additional parking; Garage with 2-car double doors and 2-car single door; garage faces side
- Security: Prewired; Smoke detector(s)
- Utilities: Aerobic septic; Co-op electric; Propane; Well (private water)
- Home design: Single family residence; One story; Residential property; Smart home features present
- Construction: Built in 2021; Brick and rock/stone construction; Shingle roof; Slab foundation
- Exterior features: Covered patio/porch; Grassed vegetation
Interior
- Kitchen: Dishwasher; Disposal; Gas cooktop; Double oven; Eat-in kitchen with pantry
- Bedrooms: Primary bedroom on level 1 with dual sinks and ensuite bath; Total of 4 bedrooms
- Flooring: Carpet; Ceramic tile; Tile
- Bathrooms: 3 full bathrooms
- Heating & cooling: Central heating (electric); Central air; Ceiling fan(s)
- Interior features: Decorative lighting; Double vanity; Eat-in kitchen; High-speed internet available; Open floorplan; Pantry; Walk-in closet(s); Two living areas; One dining area; Fireplace in living room (wood burning with gas starter)
- Laundry & utility: Utility room with full-size washer/dryer area
Neighborhood map
What this means for you Summary
Snapshot
- This is a 4-bed/3.0-bath land listed at $539k.
Deal economics
- At list price, monthly cash flow is $560 ($7k/yr) — positive.
- The deal already cash-flows at list — no discount required.
- To meet the 1% rule (rent ≥ 1% of price), the offer needs to be $500k (7.2% below list).
- Recommended offer: $500k (7.2% below list) — sets the bar for 1% rule.
Location & tenants
- Location reads: area grade D — affects rentability + tenant quality, not the cash-flow math above.
- Peaster ISD (rural): math 45% / reading 51% proficiency, ranked #168 of 826 in TX (top 20%) — families likely to look elsewhere, expect single-tenant / working-renter base with shorter leases.
- Zoned schools: Peaster El (math 43% / reading 45%, grade F, #1,243 of 4,322 statewide, top 29%, 862 students, 27% FRL); Peaster J H (math 47% / reading 49%, grade C-, #400 of 1,662 statewide, top 24%, 382 students, 34% FRL); Peaster H S (math 47% / reading 72%, grade C+, #275 of 1,632 statewide, top 19%, 506 students, 23% FRL) — zoned schools at 28% FRL track the district average.
- Market conditions: 315 active listings in the ZIP; 1 comparable units currently listed for rent nearby; 437 units permitted in Parker County in 2024 (0 in 5+ unit buildings).
Forward outlook
- Local home prices are declining (-3.0%/yr); year-one equity from $4k of loan paydown is wiped out by about $16k of value loss. Plan a longer hold.
- Parker County population projected at +32% by 2050 — long-run rental-demand tailwind backs the buy-and-hold thesis.
Negotiation context
- It's been on market 40 days — a 3% lower offer ($523k) is reasonable based on typical stale-listing flexibility.
- 2 sale attempts with the ask held roughly flat each time — persistent listings suggest the price (not the market) is what's stuck; bring a comps-based counter.
Questions for the listing agent
- It's been on market 40 days. Have you received any prior offers? Is the seller open to a 7% concession, seller financing, or rate buy-down credit?
- Is there a deadline driving the sale (1031 exchange, divorce, estate, relocation)? That informs how much negotiation room exists.
- The area grade is low — what's the realistic commute time and amenity access for the typical tenant pool here? Any planned neighborhood developments (good or bad) we should know about?
- What's the average days-on-market for RENTAL listings here right now (not sales)? A rising rental-DOM trend means longer vacancies and softer asking-rent achievability than the comps imply.
- What's the recent tenant-quality profile in this submarket — average credit score on applications, eviction rate, late-payment / NSF rate, and stable-employment percentage? A property-management company in the area should have these aggregated.
- How much new for-sale + rental construction is in the pipeline within 1–3 miles? Heavy new supply typically softens prices + rents 12–24 months out; constrained supply supports both.
Investment metrics
- 1% rule
- 0.93% ✗
- Cap rate
- 7.54%
- Cash-on-cash
- 4.45%
- DSCR
- 1.20
- GRM
- 9.0
CMA / ARV
- ARV (median comp)
- $510,643
- List price
- $539,000
- Delta
- 5.55%
- Verdict
- FAIR
- Comps
- 20 within 1.0 mi
Projected returns pro-forma
-3.0% appreciation · 3.0% rent growth · sell at horizon
- IRR
- -9.4%
- Equity multiple
- 0.66×
- Total profit
- $-51,833
- Equity at exit
- $80,367
- IRR
- 0.0%
- Equity multiple
- 1.00×
- Total profit
- $226
- Equity at exit
- $46,603
Cash invested: $150,920 (down + closing). Projections, not guarantees.
Landlord ↔ Tenant lean methodology
- Overall (STATE)
- 87 Strongly Landlord-Friendly
- State Texas
- 87 Strongly Landlord-Friendly · R+5
- County
- — inherits STATE
- City
- — inherits STATE
ZIP-level market 76088
- Home prices YoY
- -31.1%
- Active inventory
- 315
- Price-to-rent
- 9.0×
Monthly cashflow live
- Estimated rent
- $5,000 medium interval (Pro) →
- Mortgage (P&I)
- −$2,827
- Tax from tax record
- −$339 /mo · $4,071/yr
- Insurance
- −$225
- HOA
- −$0
- Vacancy / Maint / Mgmt
- −$1,050
- Net cashflow
- $560
Break-even live
Sensitivity live
| Price | -10% $865 | -5% $712 | +0% $560 | +5% $407 | +10% $254 |
|---|---|---|---|---|---|
| Rent | -10% $165 | -5% $362 | +0% $560 | +5% $757 | +10% $955 |
| Rate | -1.0pp $831 | -0.5pp $697 | base $560 | +0.5pp $420 | +1.0pp $278 |
UW: 25.0% down · 7.5% · 30yr · 1.5% tax · 5.0% vac · 8.0% maint · 8.0% mgmt
Financing live
Cash to close
- Down payment
- $134,750
- Closing costs
- $16,170
- Reserves months
- —
- Total cash needed
- —
Loan-product check · same deal, 3 products live
Conventional
25% down · 7.5% · 30yr
- Down + closing
- —
- Monthly P&I
- —
- Monthly cashflow
- —
- DSCR
- —
- Eligible?
- —
Personal DTI + credit; lowest rate.
DSCR
20% down · 8.5% · 30yr
- Down + closing
- —
- Monthly P&I
- —
- Monthly cashflow
- —
- DSCR
- —
- Eligible?
- —
No personal income docs; deal must DSCR.
Hard money
10% down · 12.0% · 12mo
- Down + closing
- —
- Monthly P&I
- —
- Monthly cashflow
- —
- DSCR
- —
- Eligible?
- —
Short-term bridge; refi at stabilization.
Rent comps 1 comps
| Address | Beds | Baths | Sqft | Rent | $/sqft | DOM | Units | Dist |
|---|---|---|---|---|---|---|---|---|
| 412 Lake Arbor Dr Weatherford, TX | 4.0 | 3.0 | 2916 | $5,000 | $1.71 | 45d | 1 | 1.10mi |
Listing history 17 events
-
2026-06-21days on market $539,000 Active 40 DOM
-
2026-06-18days on market $539,000 Active 37 DOM
-
2026-06-17days on market $539,000 Active 36 DOM
-
2026-06-16days on market $539,000 Active 35 DOM
-
2026-06-15days on market $539,000 Active 34 DOM
-
2026-06-13days on market $539,000 Active 32 DOM
-
2026-06-09days on market $539,000 Active 28 DOM
-
2026-06-08days on market $539,000 Active 27 DOM
-
2026-06-07days on market $539,000 Active 26 DOM
-
2026-06-04days on market $539,000 Active 23 DOM
-
2026-06-03days on market $539,000 Active 22 DOM
-
2026-06-02days on market $539,000 Active 21 DOM
-
2026-06-01days on market $539,000 Active 20 DOM
-
2026-05-31days on market $539,000 Active 19 DOM
-
2026-05-18historical Active Option Contract 992-char remark
-
2026-05-12$539,000 Active 992-char remark
-
2021-06-24soldstatus
ⓘ Source: listings_history table (triggers on properties + properties_extension) + one-shot
backfill from property_details.listing_events for pre-trigger history.
Tax reassessment forecast TX · Resets to sale price
- Current annual tax
- $4,071 · $339/mo
- Projected year-2 tax
- $9,864 · $822/mo
- Expected delta
- +$5,792/yr (+$483/mo · 142.3%)
ⓘ Screening estimate from a state-policy table — verify with the county assessor before closing.
Nearby sold comps map
Loading sold comps map…
Walkable amenities ~0.75 mi
Loading nearby amenities…
Taxation est. · year 1
- Rental income
- $60,000
- − Mortgage interest
- −$30,192
- − Property taxes
- −$4,071
- − Insurance
- −$2,695
- − Repairs & maintenance
- −$4,800
- − Management
- −$4,800
- − Depreciation
- −$15,680
- Taxable loss
- −$2,239
- Est. tax savings @ 24.0%
- +$537
- After-tax cash flow
- $7,252/yr
For passive investors: Depreciation is non-cash, so a rental often shows a tax loss while cash-flowing — sheltering income. Rental losses are passive: they offset passive income freely, and up to $25,000/yr can offset ordinary (W-2) income if you actively participate and your MAGI is under $100k (phasing out to $0 by $150k); unused losses carry forward. On sale, claimed depreciation is recaptured at up to 25%, and gains may owe capital-gains tax (a 1031 exchange can defer both). Figures are a year-1 estimate at your 24.0% rate — not tax advice; consult a CPA.
Schools (NCES district)
- District
- Peaster ISD
- NCES district ID
- 4834500
- Math proficiency
- 45% ▼ -8.00%
- Reading proficiency
- 51% ▼ -1.00%
- Median HH income
- $73,801
- Composite
- 43.39/100
- National rank
- #3022
- State rank
- #168 of 826 in TX
Livability — Garner
No livability data for this city. (Only ~50 U.S. cities are tracked.)
Census & demographics
- Population (ZIP)
- 15,748
Population outlook (Parker County) Hauer SSP2
- Today (2025)
- 147,426 people
- By 2030
- 157,863 · +7.1%
- By 2040
- 177,519 · +20.4%
- By 2050
- 194,786 · +32.1%
- By 2075
- 238,799 · +62.0%
- By 2100
- 264,126 · +79.2%
Race, ethnicity, and origin ACS 2023
- Neighborhood character
- Predominantly White (84%)
- Race & ethnicity
- White 84% Hispanic / Latino 13% Two or more races 8%
- Hispanic origin (detail)
- Mexican 9%
- Common ancestry
- Serbian 3% Italian 2% Slovak 2%
- Foreign-born
- 4% · Canada, Jamaica
- Languages at home
- 93% English-only · Spanish 6%
Political lean MEDSL · Parker
- 2024 margin
- Solid R (+66.4) · D 16.4% · R 82.8%
- 2008→2024 swing
- -11.2pp toward R · 2008: -55.2pp · 2024: -66.4pp
- All cycles
- 2024: R+66.4 2020: R+64.4 2016: R+67.5 2012: R+65.8 2008: R+55.2
Not yet ingested
- Civics
- —
Market trends
- HPI YoY
- ▼ -121.05%
- Current HPI
- 268.7477
- Rent YoY
- —
- Metro
- —
- State GDP YoY
- ▲ 3.95%
- F500 in state
- 110
Industry mix (Fortune 500 HQ in TX)
| Industry | F500 HQs | Revenue |
|---|---|---|
| Energy | 16 | $1,198B |
|
||
| Technology | 5 | $198B |
|
||
| Engineering / Construction | 4 | $72B |
|
||
| Energy Services | 3 | $60B |
|
||
| Utilities | 3 | $41B |
|
||
| Healthcare | 2 | $330B |
|
||
Price history
4 events — show timeline
- 2026-05-27 Relisted — NTREIS
- 2026-05-18 Contingent — NTREIS
- 2026-05-12 Listed $539,000 NTREIS
- 2021-06-24 Sold (Public Records) — Public Records
Cash-flow waterfall
monthlySold comps — $/sqft
last 12 mo · ≤1 miLoading sold comps…