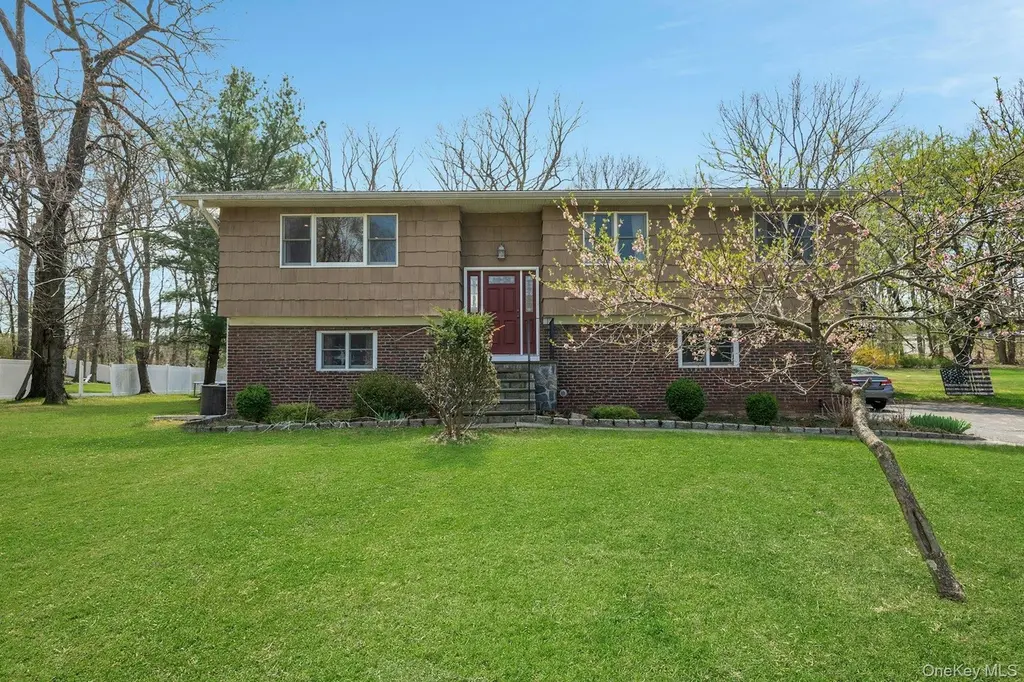
6 Foxwood Ln · Thornwood, NY
Flood risk 1/10 · Minimal
- FEMA flood zone
- X (unshaded)
- Chance of flooding over 30 yrs
- 0.0%
- Est. flood insurance / yr
- $473 – $860
Fire risk 2/10 · Minimal
- Est. fire insurance / yr
- $691 – $1,283
Heat risk 5/10 · Moderate
- Hot days now (above 97°F)
- 7 days/yr
- Hot days in 30 yrs
- 14 days/yr
Wind risk 6/10 · Moderate
- Chance of severe wind over 30 yrs
- 27.0%
Air-quality risk 4/10 · Minor
- Unhealthy air days now
- 4 days/yr
- Unhealthy air days in 30 yrs
- 6 days/yr
Risk factors via First Street. Map © Google.
Why this score? — see what drove the B- grade
The composite is a weighted blend of 9 inputs, each scored 0–100. Each bar is that input's sub-score; the figure is the points it added to the 100-point composite (weight × sub-score).
- Cash flow +28.3/30.0
- DSCR +10.0/10.0
- 1% rule +8.3/10.0
- Schools +6.0/10.0
- ARV discount +4.0/15.0
- Livability +3.6/5.0
- Rent growth +2.5/5.0
- Condition / age +2.5/5.0
- Appreciation +0.0/10.0
$949,000
🖨 Deal sheet (PDF) 📄 Offer letter ✓ Due diligence
Listing remarks MLS
This Is The House You've Been Waiting For! Sitting Pretty On A Lovely One Acre Property With Level Yard, Patio And More! Perfect For Entertaining! Well Maintained Home W/ Central Air, New Roof, Hardwood Floors Come See!!
Key facts
- Large deck
- Walk-in closet
- Huge backyard
Tags
Property features AI
Finance
- Other
- Additional parcel(s) on the property
Exterior
- Parking
- Driveway2-car garage
- Utilities
- Con Edison electricPublic sewerCable connectedElectricity connectedNatural gas connectedSewer connectedWater connected
- Home design
- Single family residenceMulti/split levels
- Construction
- Brick and shingle sidingFinished walk-out basement
- Exterior features
- Back yardFront yardCleared lotLevel lotNear schoolNot waterfront
Interior
- Kitchen
- DishwasherGas rangeOvenRefrigeratorGranite countersEat-in kitchen
- Bedrooms
- Includes a first-floor bedroom
- Flooring
- Ceramic tileHardwood
- Bathrooms
- 3 full bathrooms
- Heating & cooling
- Central air conditioningBaseboard heatingHot water heatingNatural gas heating
- Interior features
- First-floor bedroomFirst-floor full bathroomEat-in kitchenFormal dining roomGranite countertopsOpen floor planPrimary bathroomRecessed lightingWalk-in closet(s)Finished basement with walk-out accessPull-down attic stairsDeckPatio
- Laundry & utility
- WasherDryer
Neighborhood map
What this means for you Summary
Snapshot
- This is a 3-bed/2.0-bath single-family listed at $949k.
Deal economics
- At list price, monthly cash flow is $3k ($36k/yr) — positive.
- The deal already cash-flows at list — no discount required.
- Meets the 1% rule at list price ($13k rent vs $949k).
- Recommended offer: $935k (1.5% below list) — sets the bar for market timing.
- Cap rate 10.1% vs local median 3.4% in Thornwood — top-decile yield for the area; either an underpriced asset or a hidden risk that comps aren't pricing in. Stress-test before assuming the spread holds.
Location & tenants
- Location reads 71/100 on livability (#389 in NY) — a middle-class / working-renter tenant base. Strengths: crime A+, employment A+, housing A+; Watch: amenities F, commute F, cost of living F.
- Mount Pleasant Central School District (suburban): math 62% / reading 65% proficiency, ranked #146 of 590 in NY (top 25%) — acceptable for families but not a draw, mixed tenant base, ~2y average lease; only 5% free/reduced lunch — higher-income household profile.
- Zoned schools: Hawthorne Elementary School (460 students, 10% FRL); Westlake Middle School (math 55% / reading 61%, grade B, #184 of 729 statewide, top 25%, 429 students, 14% FRL); Westlake High School (math 72% / reading 95%, grade A, #409 of 1,100 statewide, top 39%, 547 students, 19% FRL).
- Market conditions: 33 active listings in the ZIP; 2 comparable units currently listed for rent nearby; 954 units permitted in Westchester County in 2024 (649 in 5+ unit buildings).
Forward outlook
- Local home prices are declining (-3.0%/yr); year-one equity from $7k of loan paydown is wiped out by about $28k of value loss. Plan a longer hold.
- Westchester County population projected at +10% by 2050 — modest demand growth; plan on rents tracking national, not racing it.
- At projected returns (-3.0% appreciation + 3.0% rent growth), your $266k cash investment doubles in ~9 years — after that, you're playing with house money.
Negotiation context
- It's been on market 22 days — a 2% lower offer ($935k) is reasonable based on typical stale-listing flexibility.
- 2 sale attempts since 23y ago with the ask held roughly flat each time — persistent listings suggest the price (not the market) is what's stuck; bring a comps-based counter.
- Current owner paid $614k; list at $949k implies a 55% gain — meaningful room to come down on a strong offer.
Risks & watch-outs
- Climate carrying-cost: major wind risk, 27% chance of damaging wind over 30y; extreme-heat days projected 7→14/yr by 2055 (HVAC capex compounding) — expect insurance premiums to compound above CPI over the hold.
Questions for the listing agent
- Built in 1966 — when were the roof, HVAC, electrical panel, plumbing, and water heater last replaced?
- Is there a deadline driving the sale (1031 exchange, divorce, estate, relocation)? That informs how much negotiation room exists.
- Schools are A-rated — typically a magnet for longer-tenancy family renters. What's the average tenant stay here, and is there a school-zone premium baked into asking?
- What's the average days-on-market for RENTAL listings here right now (not sales)? A rising rental-DOM trend means longer vacancies and softer asking-rent achievability than the comps imply.
- What's the recent tenant-quality profile in this submarket — average credit score on applications, eviction rate, late-payment / NSF rate, and stable-employment percentage? A property-management company in the area should have these aggregated.
- How much new for-sale + rental construction is in the pipeline within 1–3 miles? Heavy new supply typically softens prices + rents 12–24 months out; constrained supply supports both.
Investment metrics
- 1% rule
- 1.33% ✓
- Cap rate
- 10.13%
- Cash-on-cash
- 13.70%
- DSCR
- 1.61
- GRM
- 6.2
CMA / ARV
- ARV (on-the-fly)
- $880,425
- Comps found
- 9
Show comp detail 9 sales within ~0.75 mi
| Address | Dist | Beds/Ba | Sqft | Sold | Price | $/sf | Match |
|---|---|---|---|---|---|---|---|
| 462 Swanson Dr | 0.27mi | 4/3.0 (+1) | 1,950 (+1%) | 21mo | $850,000 | $436 | 60 |
| 70 Highland Rd | 0.21mi | 3/2.5 | 1,656 (-14%) | 8mo | $800,000 | $483 | 57 |
| 107 Whittier Dr | 0.74mi | 4/2.0 (+1) | 2,024 (+5%) | 0mo | $941,000 | $465 | 52 |
| 10 Roy Pl | 0.16mi | 3/2.0 | 2,200 (+14%) | 21mo | $999,999 | $455 | 52 |
| 24 Saxon Dr | 0.30mi | 3/1.5 | 1,688 (-13%) | 18mo | $880,000 | $521 | 48 |
| 5 Roy Pl | 0.22mi | 4/1.5 (+1) | 1,647 (-15%) | 17mo | $680,000 | $413 | 44 |
| 24 Westlake Dr | 0.31mi | 3/2.5 | 2,224 (+15%) | 20mo | $1,100,000 | $495 | 42 |
| 49 Glen Forest St | 0.35mi | 4/2.0 (+1) | 2,200 (+14%) | 18mo | $605,000 | $275 | 41 |
| 55 Bainbridge Ave | 0.72mi | 3/2.0 | 2,185 (+13%) | 9mo | $965,000 | $442 | 38 |
Match score weights: distance 35% · size 25% · config 20% · recency 20%. Top-matched comps best support the ARV.
Projected returns pro-forma
-3.0% appreciation · 3.0% rent growth · sell at horizon
- IRR
- 3.9%
- Equity multiple
- 1.15×
- Total profit
- $39,870
- Equity at exit
- $141,499
- IRR
- 13.4%
- Equity multiple
- 2.07×
- Total profit
- $285,307
- Equity at exit
- $82,052
Cash invested: $265,720 (down + closing). Projections, not guarantees.
Landlord ↔ Tenant lean methodology
- Overall (STATE)
- 15 Strongly Tenant-Friendly
- State New York
- 15 Strongly Tenant-Friendly · D+10
- County
- — inherits STATE
- City
- — inherits STATE
ZIP-level market 10594
- Home prices YoY
- -18.7%
- Active inventory
- 33
- Price-to-rent
- 6.2×
Monthly cashflow live
- Estimated rent
- $12,666 medium interval (Pro) →
- Mortgage (P&I)
- −$4,977
- Tax from tax record
- −$1,600 /mo · $19,203/yr
- Insurance
- −$395
- HOA
- −$0
- Lot rent
- −$0
- Vacancy / Maint / Mgmt
- −$2,660
- Net cashflow
- $3,033
Break-even live
Sensitivity live
| Price | -10% $3,571 | -5% $3,302 | +0% $3,033 | +5% $2,765 | +10% $2,496 |
|---|---|---|---|---|---|
| Rent | -10% $2,033 | -5% $2,533 | +0% $3,033 | +5% $3,534 | +10% $4,034 |
| Rate | -1.0pp $3,511 | -0.5pp $3,275 | base $3,033 | +0.5pp $2,788 | +1.0pp $2,537 |
UW: 25.0% down · 7.5% · 30yr · 1.5% tax · 5.0% vac · 8.0% maint · 8.0% mgmt
Financing live
Cash to close
- Down payment
- $237,250
- Closing costs
- $28,470
- Reserves months
- —
- Total cash needed
- —
Loan-product check · same deal, 3 products live
Conventional
25% down · 7.5% · 30yr
- Down + closing
- —
- Monthly P&I
- —
- Monthly cashflow
- —
- DSCR
- —
- Eligible?
- —
Personal DTI + credit; lowest rate.
DSCR
20% down · 8.5% · 30yr
- Down + closing
- —
- Monthly P&I
- —
- Monthly cashflow
- —
- DSCR
- —
- Eligible?
- —
No personal income docs; deal must DSCR.
Hard money
10% down · 12.0% · 12mo
- Down + closing
- —
- Monthly P&I
- —
- Monthly cashflow
- —
- DSCR
- —
- Eligible?
- —
Short-term bridge; refi at stabilization.
Rent comps 2 comps
| Address | Beds | Baths | Sqft | Rent | $/sqft | DOM | Units | Dist |
|---|---|---|---|---|---|---|---|---|
| 10 Foxwood Ln Thornwood, NY | 4.0 | 3.5 | 2026 | $12,999 | $6.42 | 47d | 1 | 0.05mi |
| 12 Wyeth Ct Pleasantville, NY | 3.0 | 2.5 | 2583 | $7,000 | $2.71 | 28d | 1 | 1.33mi |
Listing history 7 events
-
2026-05-09status Pending
-
2026-04-16$949,000 Active
-
2003-06-05soldstatus $614,000
-
2003-04-10soldstatus $614,000 221-char remark
Show marketing remark (221 chars)
This Is The House You've Been Waiting For! Sitting Pretty On A Lovely One Acre Property With Level Yard, Patio And More! Perfect For Entertaining! Well Maintained Home W/ Central Air, New Roof, Hardwood Floors Come See!!
-
2003-03-10price $619,000 221-char remark
Show marketing remark (221 chars)
This Is The House You've Been Waiting For! Sitting Pretty On A Lovely One Acre Property With Level Yard, Patio And More! Perfect For Entertaining! Well Maintained Home W/ Central Air, New Roof, Hardwood Floors Come See!!
-
2003-03-10historical 221-char remark
Show marketing remark (221 chars)
This Is The House You've Been Waiting For! Sitting Pretty On A Lovely One Acre Property With Level Yard, Patio And More! Perfect For Entertaining! Well Maintained Home W/ Central Air, New Roof, Hardwood Floors Come See!!
-
2003-02-13$614,000 221-char remark
Show marketing remark (221 chars)
This Is The House You've Been Waiting For! Sitting Pretty On A Lovely One Acre Property With Level Yard, Patio And More! Perfect For Entertaining! Well Maintained Home W/ Central Air, New Roof, Hardwood Floors Come See!!
ⓘ Source: listings_history table (triggers on properties + properties_extension) + one-shot
backfill from property_details.listing_events for pre-trigger history.
Tax reassessment forecast NY · Partial reset (capped growth)
- Current annual tax
- $19,203 · $1,600/mo
- Projected year-2 tax
- $19,203 · $1,600/mo
- Expected delta
- $0/yr ($0/mo · 0.0%)
ⓘ Screening estimate from a state-policy table — verify with the county assessor before closing.
Climate risk First Street
- Flood 1/10 Low FEMA zone X (unshaded) · 0% chance over 30 yrs
- Wildfire 2/10 Low
- Heat 5/10 Major 7 d/yr ≥97°F today · 14 d/yr by 30 yrs out
- Wind 6/10 Major 27% chance of damaging wind over 30 yrs
- Air quality 4/10 Moderate 4 unhealthy d/yr today · 6 by 30 yrs out
Nearby sold comps map
Loading sold comps map…
Walkable amenities ~0.75 mi
Loading nearby amenities…
Taxation est. · year 1
- Rental income
- $151,987
- − Mortgage interest
- −$53,159
- − Property taxes
- −$19,203
- − Insurance
- −$4,745
- − Repairs & maintenance
- −$12,159
- − Management
- −$12,159
- − Depreciation
- −$27,607
- Taxable income
- $22,955
- Est. tax owed @ 24.0%
- −$5,509
- After-tax cash flow
- $30,892/yr
For passive investors: Depreciation is non-cash, so a rental often shows a tax loss while cash-flowing — sheltering income. Rental losses are passive: they offset passive income freely, and up to $25,000/yr can offset ordinary (W-2) income if you actively participate and your MAGI is under $100k (phasing out to $0 by $150k); unused losses carry forward. On sale, claimed depreciation is recaptured at up to 25%, and gains may owe capital-gains tax (a 1031 exchange can defer both). Figures are a year-1 estimate at your 24.0% rate — not tax advice; consult a CPA.
Schools (NCES district)
- District
- Mount Pleasant Central School District
- NCES district ID
- 3620160
- Math proficiency
- 62% ▼ -16.00%
- Reading proficiency
- 65% ▲ 3.00%
- Median HH income
- $109,054
- Composite
- 59.62/100
- National rank
- #911
- State rank
- #146 of 590 in NY
Livability — Thornwood
- Score
- 71/100
- State rank
- #389
- US rank
- #6724
Category grades
Schools grade is shown separately in the Schools card above.
Census & demographics
- Population (ZIP)
- 5,512
Population outlook (Westchester County) Hauer SSP2
- Today (2025)
- 1,028,035 people
- By 2030
- 1,051,636 · +2.3%
- By 2040
- 1,098,520 · +6.9%
- By 2050
- 1,136,044 · +10.5%
- By 2075
- 1,196,925 · +16.4%
- By 2100
- 1,175,147 · +14.3%
Race, ethnicity, and origin ACS 2023
- Neighborhood character
- Predominantly White (83%)
- Race & ethnicity
- White 83% Hispanic / Latino 9% Two or more races 4% Asian 4%
- Hispanic origin (detail)
- Mexican 4%
- Common ancestry
- Romanian 4% Scotch-Irish 2% Russian 2%
- Foreign-born
- 16% · Canada, China
- Languages at home
- 78% English-only · Other Indo-European 12% Spanish 7% Other Asian/Pacific 1%
Political lean MEDSL · Westchester
- 2024 margin
- Strong D (+26.3) · D 63.1% · R 36.9%
- 2008→2024 swing
- -1.3pp toward R · 2008: 27.6pp · 2024: 26.3pp
- All cycles
- 2024: D+26.3 2020: D+36.3 2016: D+32.8 2012: D+22.2 2008: D+27.6
Not yet ingested
- Civics
- —
Market trends
- HPI YoY
- ▼ -65.72%
- Current HPI
- 286.025
- Rent YoY
- —
- Metro
- —
- State GDP YoY
- ▲ 2.60%
- F500 in state
- 92
Industry mix (Fortune 500 HQ in NY)
| Industry | F500 HQs | Revenue |
|---|---|---|
| Financial Services | 10 | $950B |
|
||
| Consumer Goods | 9 | $162B |
|
||
| Insurance | 4 | $225B |
|
||
| Telecommunications | 2 | $144B |
|
||
| Pharmaceuticals | 2 | $112B |
|
||
| Media / Entertainment | 2 | $69B |
|
||
Price history
+54.6% since first listed7 events — show timeline
- 2026-05-09 Pending — OneKey® MLS as Distributed by MLS Grid
- 2026-04-16 Listed $949,000 OneKey® MLS as Distributed by MLS Grid
- 2003-06-05 Sold (Public Records) $614,000 Public Records
- 2003-04-10 Sold (MLS) $614,000 HGMLS
- 2003-03-10 Delisted — HGMLS
- 2003-03-10 Price Changed $619,000 HGMLS
- 2003-02-13 Listed $614,000 HGMLS
Property tax history
+5.0%/yrLatest (2025): $19,203 · -0.2% YoY. Source: county tax records.
Cash-flow waterfall
monthlySold comps — $/sqft
last 12 mo · ≤1 miLoading sold comps…