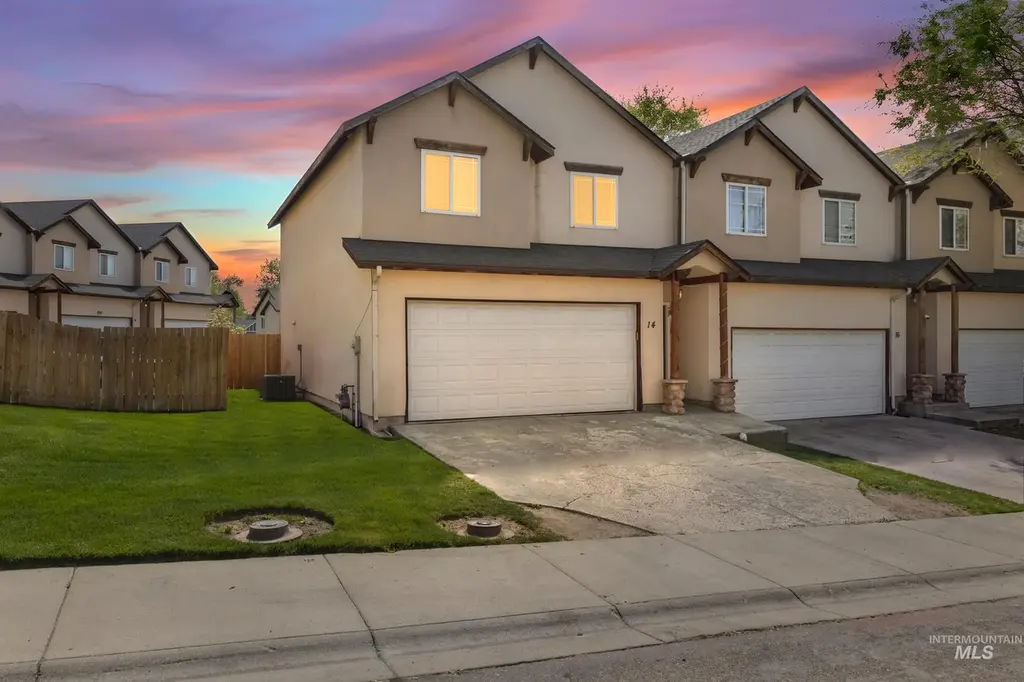
14 S Sugar Loop · Nampa, ID
Flood risk 1/10 · Minimal
- FEMA flood zone
- X (shaded)
- Chance of flooding over 30 yrs
- 0.0%
- Est. flood insurance / yr
- $507 – $1,088
Fire risk 2/10 · Minimal
- Est. fire insurance / yr
- $584 – $1,086
Heat risk 5/10 · Moderate
- Hot days now (above 98°F)
- 7 days/yr
- Hot days in 30 yrs
- 18 days/yr
Wind risk 1/10 · Minimal
- Chance of severe wind over 30 yrs
- —
Air-quality risk 8/10 · Major
- Unhealthy air days now
- 12 days/yr
- Unhealthy air days in 30 yrs
- 18 days/yr
Risk factors via First Street. Map © Google.
Why this score? — see what drove the D grade
The composite is a weighted blend of 9 inputs, each scored 0–100. Each bar is that input's sub-score; the figure is the points it added to the 100-point composite (weight × sub-score).
- Cash flow +14.0/30.0
- ARV discount +11.3/15.0
- DSCR +4.2/10.0
- Livability +3.6/5.0
- Rent growth +3.4/5.0
- 1% rule +2.8/10.0
- Schools +2.7/10.0
- Condition / age +2.5/5.0
- Appreciation +0.0/10.0
$317,987
🖨 Deal sheet (PDF) 📄 Offer letter ✓ Due diligence
Listing remarks
“Fantastic opportunity in Nampa; Very well maintained 3 bed, 2.5 bath town-home with a 2-car garage, priced to sell. Fully fenced backyard with a nice patio slab, large master bedroom and private master bath. This property offers close proximity to downtown Nampa and easy I-84 freeway access. Great value in today’s market. ” * * * * * * Seller is Offering a 1 year Buyer's Home warranty. * * * * * * OPEN HOUSE 5/17/26 from 12-2PM * * *
Key facts
- Patio slab
- $41 HOA
- 2 garage spots
Tags
Property features AI
Finance
- Other: Property is in the Sugar Meadows #2 subdivision
- HOA & community: Monthly HOA fee of $41.50
Exterior
- Parking: Attached 2-car garage; 2 covered parking spaces (total 2 parking spaces)
- Utilities: Sewer connected; Cable connected; Public paved road frontage
- Home design: Townhouse; Built in 2002
- Construction: Frame and stucco construction; Composition roof
- Exterior features: Wood fencing; Automatic full sprinkler system
Interior
- Kitchen: Dishwasher; Disposal; Microwave; Oven/Range (freestanding)
- Bedrooms: 3 bedrooms (master, bedroom 2 and bedroom 3 all on upper level); Master bedroom approx. 23 x 17; Bedroom 2 approx. 14 x 14; Bedroom 3 approx. 13 x 12
- Flooring: Carpet
- Bathrooms: 3 bathrooms
- Heating & cooling: No central heating listed; Central air conditioning
- Interior features: Bath in master bedroom
- Laundry & utility: Utility room on main level (approx. 6 x 6)
Neighborhood map
What this means for you Summary
Snapshot
- This is a 3-bed/2.5-bath townhouse listed at $318k.
Deal economics
- At list price, monthly cash flow is $39 ($471/yr) — positive.
- The deal already cash-flows at list — no discount required.
- To meet the 1% rule (rent ≥ 1% of price), the offer needs to be $249k (21.7% below list).
- Recommended offer: $249k (21.7% below list) — sets the bar for 1% rule.
- Cap rate 6.4% vs local median 3.2% in Nampa — top-decile yield for the area; either an underpriced asset or a hidden risk that comps aren't pricing in. Stress-test before assuming the spread holds.
Location & tenants
- Location reads 72/100 on livability (#47 in ID) — a middle-class / working-renter tenant base. Strengths: housing A+, health & safety A+, cost of living A-; Watch: employment C-, amenities F, commute F.
- Nampa School District (suburban): math 23% / reading 41% proficiency, ranked #82 of 92 in ID (top 89%) — families likely to look elsewhere, expect single-tenant / working-renter base with shorter leases.
- Zoned schools: Park Ridge Elementary (math 17% / reading 32%, grade F, #332 of 357 statewide, top 95%, 302 students, 54% FRL); East Valley Middle School (math 14% / reading 38%, grade F, #102 of 109 statewide, top 95%, 668 students, 49% FRL); Columbia High School (math 16% / reading 52%, grade F, #115 of 169 statewide, top 68%, 1,239 students, 39% FRL) — zoned schools at 47% FRL track the district average.
- Market conditions: Rents rising (+3.4%/yr); 638 active listings in the ZIP; 14 comparable units currently listed for rent nearby; rentals leasing fast (median 5d on market — plan ~1-2 weeks tenant-placement turnaround); solid renter incomes; 3,620 units permitted in Canyon County in 2024 (196 in 5+ unit buildings).
- This rent runs 39% of the median local income ($77k/yr) — at the standard rent-burdened threshold; future hikes will face affordability resistance.
Forward outlook
- Local home prices are declining (-3.0%/yr); year-one equity from $2k of loan paydown is wiped out by about $10k of value loss. Plan a longer hold.
- Canyon County population projected at +41% by 2050 — long-run rental-demand tailwind backs the buy-and-hold thesis.
Negotiation context
- It's been on market 68 days — a 6% lower offer ($299k) is reasonable based on typical stale-listing flexibility.
- 7 sale attempts since 22y ago with the ask held roughly flat each time — persistent listings suggest the price (not the market) is what's stuck; bring a comps-based counter.
Risks & watch-outs
- Climate carrying-cost: extreme-heat days projected 7→18/yr by 2055 (HVAC capex compounding) — expect insurance premiums to compound above CPI over the hold.
Questions for the listing agent
- It's been on market 68 days. Have you received any prior offers? Is the seller open to a 22% concession, seller financing, or rate buy-down credit?
- What does the HOA fee cover, when was the last increase, and are there any pending special assessments or reserve-fund shortfalls?
- Why hasn't it sold? Are there any deal-killer items the seller is aware of (foundation, flood, title, zoning, code violations)?
- Is there a deadline driving the sale (1031 exchange, divorce, estate, relocation)? That informs how much negotiation room exists.
- Schools are D-rated, which usually means shorter tenancies and higher turnover. Who's the typical renter profile here, and what's been the actual vacancy rate?
- The area grade is low — what's the realistic commute time and amenity access for the typical tenant pool here? Any planned neighborhood developments (good or bad) we should know about?
- What's the average days-on-market for RENTAL listings here right now (not sales)? A rising rental-DOM trend means longer vacancies and softer asking-rent achievability than the comps imply.
- What's the recent tenant-quality profile in this submarket — average credit score on applications, eviction rate, late-payment / NSF rate, and stable-employment percentage? A property-management company in the area should have these aggregated.
- How much new for-sale + rental construction is in the pipeline within 1–3 miles? Heavy new supply typically softens prices + rents 12–24 months out; constrained supply supports both.
Investment metrics
- 1% rule
- 0.78% ✗
- Cap rate
- 6.44%
- Cash-on-cash
- 0.53%
- DSCR
- 1.02
- GRM
- 10.6
CMA / ARV
- ARV (on-the-fly)
- $347,070
- Comps found
- 10
Show comp detail 10 sales within ~0.75 mi
| Address | Dist | Beds/Ba | Sqft | Sold | Price | $/sf | Match |
|---|---|---|---|---|---|---|---|
| 55 S Sugar Loop Ln | 0.06mi | 3/2.5 | 1,509 (0%) | 8mo | $299,500 | $198 | 91 |
| 47 S Sugar Loop Ln | 0.04mi | 3/2.5 | 1,509 (0%) | 19mo | $279,990 | $186 | 82 |
| 2324 E Spice Loop #4 | 0.11mi | 3/3.0 | 1,400 (-7%) | 3mo | $325,000 | $232 | 78 |
| 2111 4th St N | 0.20mi | 3/2.5 | 1,494 (-1%) | 14mo | $349,900 | $234 | 78 |
| 2316 E Spice Loop #4 | 0.13mi | 3/3.0 | 1,380 (-8%) | 4mo | $316,990 | $230 | 75 |
| 2315 E Spice Loop #4 | 0.10mi | 3/3.0 | 1,372 (-9%) | 7mo | $332,499 | $242 | 72 |
| 2304 E Spice Loop #4 | 0.13mi | 3/3.0 | 1,380 (-8%) | 17mo | $309,000 | $224 | 64 |
| 2310 E Spice Loop #3 Loop | 0.14mi | 3/3.0 | 1,373 (-9%) | 21mo | $325,000 | $237 | 59 |
| 2480 E Hidden Creek St | 0.45mi | 3/2.0 | 1,723 (+14%) | 3mo | $374,900 | $218 | 50 |
| 2492 E Hidden Creek St | 0.46mi | 3/2.0 | 1,723 (+14%) | 4mo | $374,900 | $218 | 50 |
Match score weights: distance 35% · size 25% · config 20% · recency 20%. Top-matched comps best support the ARV.
Projected returns pro-forma
-3.0% appreciation · 3.44% rent growth · sell at horizon
- IRR
- -15.1%
- Equity multiple
- 0.46×
- Total profit
- $-48,048
- Equity at exit
- $47,413
- IRR
- -5.9%
- Equity multiple
- 0.61×
- Total profit
- $-34,558
- Equity at exit
- $27,494
Cash invested: $89,036 (down + closing). Projections, not guarantees.
Landlord ↔ Tenant lean methodology
- Overall (STATE)
- 91 Strongly Landlord-Friendly
- State Idaho
- 91 Strongly Landlord-Friendly · R+18
- County
- — inherits STATE
- City
- — inherits STATE
ZIP-level market 83687
- Home prices YoY
- -21.0%
- Rents YoY
- 3.4%
- Active inventory
- 638
- Price-to-rent
- 10.6×
Monthly cashflow live
- Estimated rent
- $2,489 high interval (Pro) →
- Mortgage (P&I)
- −$1,668
- Tax from tax record
- −$86 /mo · $1,035/yr
- Insurance
- −$132
- HOA
- −$41
- Vacancy / Maint / Mgmt
- −$523
- Net cashflow
- $39
Break-even live
Sensitivity live
| Price | -10% $219 | -5% $129 | +0% $39 | +5% $-51 | +10% $-141 |
|---|---|---|---|---|---|
| Rent | -10% $-157 | -5% $-59 | +0% $39 | +5% $138 | +10% $236 |
| Rate | -1.0pp $199 | -0.5pp $120 | base $39 | +0.5pp $-43 | +1.0pp $-127 |
UW: 25.0% down · 7.5% · 30yr · 1.5% tax · 5.0% vac · 8.0% maint · 8.0% mgmt
Financing live
Cash to close
- Down payment
- $79,497
- Closing costs
- $9,540
- Reserves months
- —
- Total cash needed
- —
Loan-product check · same deal, 3 products live
Conventional
25% down · 7.5% · 30yr
- Down + closing
- —
- Monthly P&I
- —
- Monthly cashflow
- —
- DSCR
- —
- Eligible?
- —
Personal DTI + credit; lowest rate.
DSCR
20% down · 8.5% · 30yr
- Down + closing
- —
- Monthly P&I
- —
- Monthly cashflow
- —
- DSCR
- —
- Eligible?
- —
No personal income docs; deal must DSCR.
Hard money
10% down · 12.0% · 12mo
- Down + closing
- —
- Monthly P&I
- —
- Monthly cashflow
- —
- DSCR
- —
- Eligible?
- —
Short-term bridge; refi at stabilization.
Rent comps 14 comps
| Address | Beds | Baths | Sqft | Rent | $/sqft | DOM | Units | Dist |
|---|---|---|---|---|---|---|---|---|
| 44 S Sugar Loop Ln Unit 1460915P Nampa, ID | 3.0 | 2.0 | 1237 | $3,497 | $2.83 | 5d | 1 | 0.04mi |
| 2807 Mink Pl Nampa, ID | 3.0 | 2.0 | 1246 | $1,925 | $1.54 | 23d | 1 | 0.41mi |
| 220 15th Ave S #4 Nampa, ID | 3.0 | 1.0 | 1104 | $1,500 | $1.36 | 5d | 1 | 0.71mi |
| 2322 E Dewey Ave Nampa, ID | 3.0 | 2.0 | 1850 | $1,900 | $1.03 | 4d | 1 | 0.76mi |
| 146 N Grant St Nampa, ID | 3.0 | 2.0 | 1100 | $1,900 | $1.73 | 23d | 1 | 0.81mi |
| 112 S Diamond St Nampa, ID | 3.0 | 1.0 | 1058 | $1,695 | $1.60 | 5d | 1 | 0.82mi |
| 724 15th Ave S Nampa, ID | 4.0 | 2.0 | 1210 | $2,400 | $1.98 | 5d | 1 | 0.98mi |
| 512 S Elder St Nampa, ID | 3.0 | 2.0 | 1560 | $1,725 | $1.11 | 23d | 1 | 1.05mi |
| 812 2nd St N Nampa, ID | 3.0 | 2.5 | 1400 | $1,800 | $1.29 | 5d | 1 | 1.07mi |
| 123 S Holly St Nampa, ID | 2.0 | 1.0 | 1050 | $1,595 | $1.52 | 5d | 1 | 1.12mi |
| 117 Shoshone Ave Nampa, ID | 3.0 | 2.5 | 1557 | $1,925 | $1.24 | 23d | 1 | 1.15mi |
| 1004 Southside Blvd Nampa, ID | 2.0–3.0 | 2.0 | 1212 | $1,974 | $1.63 | 4d | 7 | 1.20mi |
| 2023 E Elm Grove Dr Unit 1460911P Nampa, ID | 3.0 | 2.0 | 1399 | $3,389 | $2.42 | 5d | 1 | 1.26mi |
| 2324 Yucca Pl Nampa, ID | 4.0 | 2.0 | 1460 | $2,095 | $1.43 | 25d | 1 | 1.29mi |
HOA detail
- Monthly dues
- $41 · $492/yr
Listing history 30 events
-
2026-06-21days on market $317,987 Active 68 DOM
-
2026-06-18days on market $317,987 Active 65 DOM
-
2026-06-17days on market $317,987 Active 64 DOM
-
2026-06-16days on market $317,987 Active 63 DOM
-
2026-06-15days on market $317,987 Active 62 DOM
-
2026-06-13days on market $317,987 Active 60 DOM
-
2026-06-10days on market $317,987 Active 57 DOM
-
2026-06-09days on market $317,987 Active 56 DOM
-
2026-06-08days on market $317,987 Active 55 DOM
-
2026-06-07days on market $317,987 Active 54 DOM
-
2026-06-03days on market $317,987 Active 50 DOM
-
2026-06-03days on market $317,987 Active 49 DOM
-
2026-06-01days on market $317,987 Active 48 DOM
-
2026-05-31days on market $317,987 Active 47 DOM
-
2026-05-22price $317,987
-
2026-04-14$327,987 Active
-
2020-02-28soldstatus Sold
-
2020-02-28soldstatus
-
2020-01-12status Pending
-
2020-01-07$175,000 Active
-
2016-11-28$116,500
-
2013-06-20$74,900
-
2007-08-22soldstatus
-
2007-08-22soldstatus
-
2007-08-22soldstatus
-
2007-07-27$129,900
-
2007-07-27$129,900
-
2005-11-28soldstatus
-
2005-09-19soldstatus
-
2004-08-16$104,900
ⓘ Source: listings_history table (triggers on properties + properties_extension) + one-shot
backfill from property_details.listing_events for pre-trigger history.
Tax reassessment forecast ID · Resets to sale price
- Current annual tax
- $1,035 · $86/mo
- Projected year-2 tax
- $2,194 · $183/mo
- Expected delta
- +$1,159/yr (+$97/mo · 111.9%)
ⓘ Screening estimate from a state-policy table — verify with the county assessor before closing.
Climate risk First Street
- Flood 1/10 Low FEMA zone X (shaded) · 0% chance over 30 yrs
- Wildfire 2/10 Low
- Heat 5/10 Major 7 d/yr ≥98°F today · 18 d/yr by 30 yrs out
- Wind 1/10 Low
- Air quality 8/10 Severe 12 unhealthy d/yr today · 18 by 30 yrs out
Nearby sold comps map
Loading sold comps map…
Walkable amenities ~0.75 mi
Loading nearby amenities…
Taxation est. · year 1
- Rental income
- $29,872
- − Mortgage interest
- −$17,812
- − Property taxes
- −$1,035
- − Insurance
- −$1,590
- − Repairs & maintenance
- −$2,390
- − Management
- −$2,390
- − HOA
- −$492
- − Depreciation
- −$9,251
- Taxable loss
- −$5,087
- Est. tax savings @ 24.0%
- +$1,221
- After-tax cash flow
- $1,692/yr
For passive investors: Depreciation is non-cash, so a rental often shows a tax loss while cash-flowing — sheltering income. Rental losses are passive: they offset passive income freely, and up to $25,000/yr can offset ordinary (W-2) income if you actively participate and your MAGI is under $100k (phasing out to $0 by $150k); unused losses carry forward. On sale, claimed depreciation is recaptured at up to 25%, and gains may owe capital-gains tax (a 1031 exchange can defer both). Figures are a year-1 estimate at your 24.0% rate — not tax advice; consult a CPA.
Schools (NCES district)
- District
- Nampa School District
- NCES district ID
- 1602340
- Math proficiency
- 23% ▼ -13.00%
- Reading proficiency
- 41% ▼ -9.00%
- Median HH income
- $43,576
- Composite
- 27.18/100
- National rank
- #7022
- State rank
- #82 of 92 in ID
Livability — Nampa
- Score
- 72/100
- State rank
- #47
- US rank
- #6250
Category grades
Schools grade is shown separately in the Schools card above.
Census & demographics
- Census place
- Nampa, ID
- County
- Canyon County · 235,358 people
- City population
- 142,249
- Metro
- Boise City, ID
- Population (ZIP)
- 43,135
- Household income
- $76,682
- Rent vs Own
- Severe rent burden
- 683.0
Population outlook (Canyon County) Hauer SSP2
- Today (2025)
- 248,853 people
- By 2030
- 269,596 · +8.3%
- By 2040
- 311,081 · +25.0%
- By 2050
- 350,809 · +41.0%
- By 2075
- 441,884 · +77.6%
- By 2100
- 505,641 · +103.2%
Race, ethnicity, and origin ACS 2023
- Neighborhood character
- Predominantly White (71%)
- Race & ethnicity
- White 71% Hispanic / Latino 21% Two or more races 11% Black 2% Native American 1%
- Hispanic origin (detail)
- Mexican 18%
- Common ancestry
- Italian 4% Slovak 3% Lithuanian 2%
- Foreign-born
- 7% · Canada
- Languages at home
- 85% English-only · Spanish 12% Russian/Polish/Slavic 1%
Political lean MEDSL · Canyon
- 2024 margin
- Solid R (+46.6) · D 25.4% · R 72.0% · Other 2.5%
- 2008→2024 swing
- -11.4pp toward R · 2008: -35.2pp · 2024: -46.6pp
- All cycles
- 2024: R+46.6 2020: R+39.7 2016: R+41.8 2012: R+37.1 2008: R+35.2
Not yet ingested
- Civics
- —
Market trends
- HPI YoY
- ▼ -103.50%
- Current HPI
- 388.8148
- Rent YoY
- ▲ 3.44%
- Metro
- Boise City, ID
- State GDP YoY
- ▲ 4.51%
- F500 in state
- 6
Industry mix (Fortune 500 HQ in ID)
| Industry | F500 HQs | Revenue |
|---|---|---|
| Retail | 1 | $79B |
|
||
| Technology | 1 | $25B |
|
||
| Food / Agriculture | 1 | $6B |
|
||
Price history
+203.1% since first listed16 events — show timeline
- 2026-05-22 Price Changed $317,987 IMLS
- 2026-04-14 Listed $327,987 IMLS
- 2020-02-28 Sold (Public Records) — Public Records
- 2020-02-28 Sold (MLS) — IMLS
- 2020-01-12 Pending — IMLS
- 2020-01-07 Listed $175,000 IMLS
- 2016-11-28 Listed $116,500 IMLS
- 2013-06-20 Listed $74,900 IMLS
- 2007-08-22 Sold (Public Records) — Public Records
- 2007-08-22 Sold (MLS) — IMLS
- 2007-08-22 Sold (MLS) — IMLS
- 2007-07-27 Listed $129,900 IMLS
- 2007-07-27 Listed $129,900 IMLS
- 2005-11-28 Sold (MLS) — IMLS
- 2005-09-19 Sold (Public Records) — Public Records
- 2004-08-16 Listed $104,900 IMLS
Property tax history
-4.3%/yrLatest (2025): $1,035 · -4.6% YoY. Source: county tax records.
Cash-flow waterfall
monthlySold comps — $/sqft
last 12 mo · ≤1 miLoading sold comps…