 🏗️ New Construction
2212 Jeter Dr · Bryan, TX
Flood risk 1/10 · Minimal
- FEMA flood zone
- X (unshaded)
- Chance of flooding over 30 yrs
- 0.0%
- Est. flood insurance / yr
- $507 – $1,088
Fire risk 4/10 · Minor
- Est. fire insurance / yr
- $1,222 – $2,270
Heat risk 8/10 · Major
- Hot days now (above 110°F)
- 7 days/yr
- Hot days in 30 yrs
- 25 days/yr
Wind risk 8/10 · Major
- Chance of severe wind over 30 yrs
- 80.0%
Air-quality risk 1/10 · Minimal
- Unhealthy air days now
- 0 days/yr
- Unhealthy air days in 30 yrs
- 0 days/yr
Risk factors via First Street. Map © Google.
Why this score? — see what drove the D- grade
The composite is a weighted blend of 9 inputs, each scored 0–100. Each bar is that input's sub-score; the figure is the points it added to the 100-point composite (weight × sub-score).
- Cash flow +11.2/30.0
- ARV discount +7.5/15.0
- Condition / age +4.8/5.0
- Livability +3.8/5.0
- 1% rule +3.5/10.0
- DSCR +3.3/10.0
- Schools +2.6/10.0
- Rent growth +2.5/5.0
- Appreciation +0.0/10.0
$252,390
🖨 Deal sheet (PDF) 📄 Offer letter ✓ Due diligence
Listing remarks
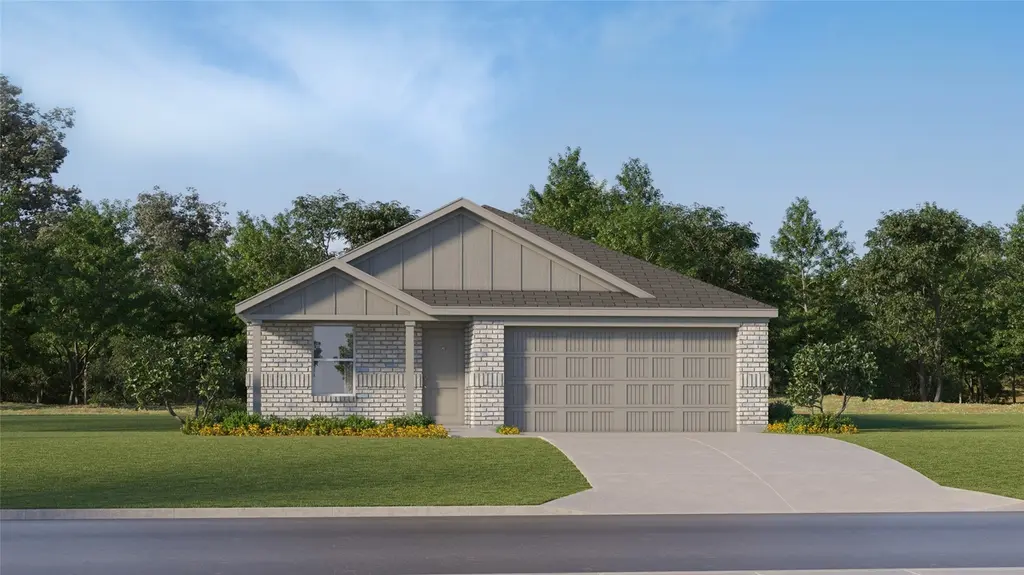
The Ramsey Floor Plan - This new single-story design makes smart use of the space available. At the front are all three secondary bedrooms arranged near a convenient full-sized bathroom. Down the foyer is a modern layout connecting a peninsula-style kitchen made for inspired meals, an intimate dining area and a family room ideal for gatherings. Tucked in a quiet corner is the owner’s suite with an attached bathroom and walk-in closet. The completion date, prices and features may vary and are subject to change. Please verify with Lennar directly. Photos are for illustrative purposes only.
Key facts
- Intimate dining area
- Walk-in closet
- Single-story design
Tags
Neighborhood map
What this means for you Summary
Snapshot
- This is a 4-bed/2.0-bath single-family listed at $252k. Condition is rated excellent.
Deal economics
- At list price, monthly cash flow is $-106 ($-1k/yr) — negative.
- The deal already cash-flows at list — no discount required.
- To meet the 1% rule (rent ≥ 1% of price), the offer needs to be $231k (8.5% below list).
- Recommended offer: $231k (8.5% below list) — sets the bar for 1% rule.
- Cap rate 5.8% vs local median 4.0% in Bryan — top-decile yield for the area; either an underpriced asset or a hidden risk that comps aren't pricing in. Stress-test before assuming the spread holds.
Location & tenants
- Location reads 76/100 on livability (#99 in TX, #3,341 nationally) — a middle-class / working-renter tenant base. Strengths: cost of living A+, housing A+, health & safety A+; Watch: crime C-, amenities C-, employment D+.
- Bryan ISD (urban): math 30% / reading 32% proficiency, ranked #608 of 826 in TX (top 74%) — families likely to look elsewhere, expect single-tenant / working-renter base with shorter leases; 68% free/reduced lunch — lower-income household profile, screen leases tightly.
- Zoned schools: Mary Branch El (math 32% / reading 17%, grade F, #3,052 of 4,322 statewide, top 74%, 617 students, 83% FRL); Stephen F Austin (math 25% / reading 36%, grade F, #1,036 of 1,662 statewide, top 63%, 1,206 students, 76% FRL); Travis B Bryan H S (math 22% / reading 34%, grade F, #1,170 of 1,632 statewide, top 72%, 2,419 students, 67% FRL).
- Market conditions: 304 active listings in the ZIP; 6 comparable units currently listed for rent nearby; rentals at typical pace (median 23d on market — plan ~3-4 weeks tenant-placement turnaround); 2,211 units permitted in Brazos County in 2024 (768 in 5+ unit buildings).
- This rent runs 37% of the median local income ($74k/yr) — at the standard rent-burdened threshold; future hikes will face affordability resistance.
Forward outlook
- Local home prices are declining (-3.0%/yr); year-one equity from $2k of loan paydown is wiped out by about $8k of value loss. Plan a longer hold.
- Brazos County population projected at +55% by 2050 — long-run rental-demand tailwind backs the buy-and-hold thesis.
Negotiation context
- It's been on market 46 days — a 3% lower offer ($245k) is reasonable based on typical stale-listing flexibility.
Risks & watch-outs
- Climate carrying-cost: severe wind risk, 80% chance of damaging wind over 30y; extreme-heat days projected 7→25/yr by 2055 (HVAC capex compounding) — expect insurance premiums to compound above CPI over the hold.
Questions for the listing agent
- What do current leases actually rent for vs. the listed asking? Can we see a recent rent roll and the last 12 months of T-12 income?
- It's been on market 46 days. Have you received any prior offers? Is the seller open to a 9% concession, seller financing, or rate buy-down credit?
- What does the HOA fee cover, when was the last increase, and are there any pending special assessments or reserve-fund shortfalls?
- Is there a deadline driving the sale (1031 exchange, divorce, estate, relocation)? That informs how much negotiation room exists.
- The area grade is low — what's the realistic commute time and amenity access for the typical tenant pool here? Any planned neighborhood developments (good or bad) we should know about?
- What's the average days-on-market for RENTAL listings here right now (not sales)? A rising rental-DOM trend means longer vacancies and softer asking-rent achievability than the comps imply.
- What's the recent tenant-quality profile in this submarket — average credit score on applications, eviction rate, late-payment / NSF rate, and stable-employment percentage? A property-management company in the area should have these aggregated.
- How much new for-sale + rental construction is in the pipeline within 1–3 miles? Heavy new supply typically softens prices + rents 12–24 months out; constrained supply supports both.
Investment metrics
- 1% rule
- 0.85% ✗
- Cap rate
- 5.82%
- Cash-on-cash
- -1.67%
- DSCR
- 0.93
- GRM
- 9.8
CMA / ARV
- ARV (on-the-fly)
- $271,512
- Comps found
- 12
Show comp detail 12 sales within ~0.75 mi
| Address | Dist | Beds/Ba | Sqft | Sold | Price | $/sf | Match |
|---|---|---|---|---|---|---|---|
| 2212 Jeter Dr | 0.00mi | 4/2.0 | 1,676 (0%) | 1mo | $252,390 | $151 | 99 |
| 2226 Jeter Dr | 0.00mi | 4/2.0 | 1,665 (-1%) | 1mo | $293,490 | $176 | 98 |
| 2202 Jeter Dr | 0.00mi | 4/2.0 | 1,716 (+2%) | 1mo | $256,990 | $150 | 95 |
| 2206 Jeter Dr | 0.00mi | 3/2.0 (-1) | 1,564 (-7%) | 1mo | $252,990 | $162 | 83 |
| 2204 Jeter Dr | 0.00mi | 4/2.0 | 1,859 (+11%) | 1mo | $274,990 | $148 | 81 |
| 5417 Smith Lake Blvd | 0.09mi | 3/2.0 (-1) | 1,564 (-7%) | 1mo | $289,990 | $185 | 78 |
| 2213 Jeter Dr | 0.17mi | 4/2.0 | 1,859 (+11%) | 1mo | $282,140 | $152 | 73 |
| 2201 Jeter Dr | 0.03mi | 3/2.0 (-1) | 1,484 (-12%) | 2mo | $244,990 | $165 | 72 |
| 5419 Bear Run | 0.10mi | 3/2.0 (-1) | 1,501 (-10%) | 1mo | $273,490 | $182 | 72 |
| 2207 Jeter Dr | 0.03mi | 4/2.5 | 1,922 (+15%) | 1mo | $268,990 | $140 | 71 |
| 2210 Jeter Dr | 0.20mi | 3/2.0 (-1) | 1,484 (-12%) | 1mo | $252,990 | $170 | 66 |
| 1819 Taggart Trl | 0.31mi | 3/2.0 (-1) | 1,484 (-12%) | 0mo | $239,990 | $162 | 61 |
Match score weights: distance 35% · size 25% · config 20% · recency 20%. Top-matched comps best support the ARV.
Projected returns pro-forma
-3.0% appreciation · 3.0% rent growth · sell at horizon
- IRR
- -19.0%
- Equity multiple
- 0.33×
- Total profit
- $-50,679
- Equity at exit
- $40,483
- IRR
- -11.5%
- Equity multiple
- 0.31×
- Total profit
- $-52,546
- Equity at exit
- $23,475
Cash invested: $76,023 (down + closing). Projections, not guarantees.
Landlord ↔ Tenant lean methodology
- Overall (STATE)
- 87 Strongly Landlord-Friendly
- State Texas
- 87 Strongly Landlord-Friendly · R+5
- County
- — inherits STATE
- City
- — inherits STATE
ZIP-level market 77807
- Active inventory
- 304
- Price-to-rent
- 9.1×
Monthly cashflow live
- Estimated rent
- $2,309 high interval (Pro) →
- Mortgage (P&I)
- −$1,424
- Tax est. 1.5%
- −$339 /mo · $4,073/yr
- Insurance
- −$113
- HOA
- −$54
- Vacancy / Maint / Mgmt
- −$485
- Net cashflow
- $-106
Break-even live
Sensitivity live
| Price | -10% $82 | -5% $-12 | +0% $-106 | +5% $-200 | +10% $-294 |
|---|---|---|---|---|---|
| Rent | -10% $-288 | -5% $-197 | +0% $-106 | +5% $-15 | +10% $76 |
| Rate | -1.0pp $31 | -0.5pp $-37 | base $-106 | +0.5pp $-176 | +1.0pp $-248 |
UW: 25.0% down · 7.5% · 30yr · 1.5% tax · 5.0% vac · 8.0% maint · 8.0% mgmt
Financing live
Cash to close
- Down payment
- $67,878
- Closing costs
- $8,145
- Reserves months
- —
- Total cash needed
- —
Loan-product check · same deal, 3 products live
Conventional
25% down · 7.5% · 30yr
- Down + closing
- —
- Monthly P&I
- —
- Monthly cashflow
- —
- DSCR
- —
- Eligible?
- —
Personal DTI + credit; lowest rate.
DSCR
20% down · 8.5% · 30yr
- Down + closing
- —
- Monthly P&I
- —
- Monthly cashflow
- —
- DSCR
- —
- Eligible?
- —
No personal income docs; deal must DSCR.
Hard money
10% down · 12.0% · 12mo
- Down + closing
- —
- Monthly P&I
- —
- Monthly cashflow
- —
- DSCR
- —
- Eligible?
- —
Short-term bridge; refi at stabilization.
Rent comps 6 comps
| Address | Beds | Baths | Sqft | Rent | $/sqft | DOM | Units | Dist |
|---|---|---|---|---|---|---|---|---|
| 5433 Bear RUN Bryan, TX | 4.0 | 2.0 | 1745 | $2,195 | $1.26 | 45d | 1 | 0.08mi |
| 2010 Chief St Bryan, TX | 3.0 | 2.0 | 1603 | $2,250 | $1.40 | 45d | 1 | 0.13mi |
| 2148 Chief St Bryan, TX | 4.0 | 2.0 | 1568 | $2,000 | $1.28 | 15d | 1 | 0.13mi |
| 1971 Chief St Bryan, TX | 3.0 | 2.0 | 1517 | $2,100 | $1.38 | 23d | 1 | 0.15mi |
| 2119 Chief St Bryan, TX | 4.0 | 2.0 | 1568 | $2,400 | $1.53 | 15d | 1 | 0.28mi |
| 2111 Chief St Bryan, TX | 3.0 | 2.0 | 1370 | $2,150 | $1.57 | 15d | 1 | 0.31mi |
HOA detail
- Monthly dues
- $54 · $648/yr
Listing history 6 events
-
2026-04-27status Pending
-
2026-04-20price $252,390
-
2026-04-13price $256,140
-
2026-04-02price $259,990
-
2026-03-16price $265,740
-
2026-03-12$261,990 Active
ⓘ Source: listings_history table (triggers on properties + properties_extension) + one-shot
backfill from property_details.listing_events for pre-trigger history.
Climate risk First Street
- Flood 1/10 Low FEMA zone X (unshaded) · 0% chance over 30 yrs
- Wildfire 4/10 Moderate
- Heat 8/10 Severe 7 d/yr ≥110°F today · 25 d/yr by 30 yrs out
- Wind 8/10 Severe 80% chance of damaging wind over 30 yrs
- Air quality 1/10 Low 0 unhealthy d/yr today · 0 by 30 yrs out
Nearby sold comps map
Loading sold comps map…
Walkable amenities ~0.75 mi
Loading nearby amenities…
Taxation est. · year 1
- Rental income
- $27,712
- − Mortgage interest
- −$15,209
- − Property taxes
- −$4,073
- − Insurance
- −$1,358
- − Repairs & maintenance
- −$2,217
- − Management
- −$2,217
- − HOA
- −$648
- − Depreciation
- −$7,899
- Taxable loss
- −$5,908
- Est. tax savings @ 24.0%
- +$1,418
- After-tax cash flow
- $146/yr
For passive investors: Depreciation is non-cash, so a rental often shows a tax loss while cash-flowing — sheltering income. Rental losses are passive: they offset passive income freely, and up to $25,000/yr can offset ordinary (W-2) income if you actively participate and your MAGI is under $100k (phasing out to $0 by $150k); unused losses carry forward. On sale, claimed depreciation is recaptured at up to 25%, and gains may owe capital-gains tax (a 1031 exchange can defer both). Figures are a year-1 estimate at your 24.0% rate — not tax advice; consult a CPA.
Condition & rehab AI · 7 photos
This single-story home is in excellent condition with a modern design and well-maintained exterior. It offers a good balance of updates and maintenance, making it a strong candidate for both resale and rental markets.
Value-add opportunities
- Both Painting the exterior and interior walls — Fresh paint enhances curb appeal and interior aesthetics
- Both Landscaping improvements — Enhances curb appeal and adds value
- Both New flooring in high-traffic areas — Fresh flooring improves aesthetics and reduces maintenance
- Both New kitchen appliances — Modern appliances enhance functionality and appeal
Renovation cost estimate screening
Value-add ROI direction
- Both Painting the exterior and interior walls — Fresh paint enhances curb appeal and interior aesthetics ↑
- Both Landscaping improvements — Enhances curb appeal and adds value ↑
- Both New flooring in high-traffic areas — Fresh flooring improves aesthetics and reduces maintenance ↑
- Both New kitchen appliances — Modern appliances enhance functionality and appeal ↑
ⓘ Cost ranges are severity-bucket heuristics (US national rule-of-thumb). Get contractor quotes + a written scope before underwriting a rehab budget.
Schools (NCES district)
- District
- Bryan ISD
- NCES district ID
- 4811790
- Math proficiency
- 30% ▼ -8.00%
- Reading proficiency
- 32% ▼ -3.00%
- Median HH income
- $41,895
- Composite
- 26.26/100
- National rank
- #7253
- State rank
- #608 of 826 in TX
Livability — Bryan
- Score
- 76/100
- State rank
- #99
- US rank
- #3341
Category grades
Schools grade is shown separately in the Schools card above.
Census & demographics
- Census place
- Bryan, TX
- County
- Brazos County · 233,400 people
- City population
- 101,772
- Metro
- College Station-Bryan, TX
- Population (ZIP)
- 13,227
- Household income
- $74,375
- Rent vs Own
- Severe rent burden
- 629.0
Population outlook (Brazos County) Hauer SSP2
- Today (2025)
- 267,942 people
- By 2030
- 296,630 · +10.7%
- By 2040
- 354,560 · +32.3%
- By 2050
- 414,616 · +54.7%
- By 2075
- 562,158 · +109.8%
- By 2100
- 678,828 · +153.3%
Race, ethnicity, and origin ACS 2023
- Neighborhood character
- Diverse neighborhood (Simpson 0.67)
- Race & ethnicity
- White 45% Hispanic / Latino 32% Two or more races 18% Black 14% Native American 3% Asian 2%
- Hispanic origin (detail)
- Mexican 29%
- Common ancestry
- Romanian 2% Lithuanian 2% Italian 2%
- Foreign-born
- 16% · Canada, Guatemala, Vietnam
- Languages at home
- 71% English-only · Spanish 24% Other Asian/Pacific 1% French/Haitian/Cajun 1%
Political lean MEDSL · Brazos
- 2024 margin
- Strong R (+24.9) · D 36.9% · R 61.7% · Other 1.4%
- 2008→2024 swing
- +4.1pp toward D · 2008: -28.9pp · 2024: -24.9pp
- All cycles
- 2024: R+24.9 2020: R+14.3 2016: R+23.7 2012: R+35.3 2008: R+28.9
Not yet ingested
- Civics
- —
Market trends
- HPI YoY
- ▼ -114.38%
- Current HPI
- 186.1387
- Rent YoY
- —
- Metro
- College Station-Bryan, TX
- State GDP YoY
- ▲ 3.95%
- F500 in state
- 110
Industry mix (Fortune 500 HQ in TX)
| Industry | F500 HQs | Revenue |
|---|---|---|
| Energy | 16 | $1,198B |
|
||
| Technology | 5 | $198B |
|
||
| Engineering / Construction | 4 | $72B |
|
||
| Energy Services | 3 | $60B |
|
||
| Utilities | 3 | $41B |
|
||
| Healthcare | 2 | $330B |
|
||
Price history
-3.7% since first listed6 events — show timeline
- 2026-04-27 Pending — HARMLS
- 2026-04-20 Price Changed $252,390 HARMLS
- 2026-04-13 Price Changed $256,140 HARMLS
- 2026-04-02 Price Changed $259,990 HARMLS
- 2026-03-16 Price Changed $265,740 HARMLS
- 2026-03-12 Listed $261,990 HARMLS
Cash-flow waterfall
monthlySold comps — $/sqft
last 12 mo · ≤1 miLoading sold comps…