 Multi-family
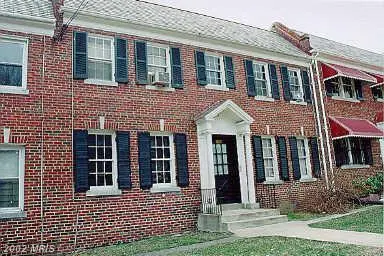
1379 Bryant St NE · Washington, DC
Flood risk 1/10 · Minimal
- FEMA flood zone
- X (unshaded)
- Chance of flooding over 30 yrs
- 0.0%
- Est. flood insurance / yr
- $473 – $860
Fire risk 1/10 · Minimal
- Est. fire insurance / yr
- $631 – $1,173
Heat risk 7/10 · Major
- Hot days now (above 106°F)
- 7 days/yr
- Hot days in 30 yrs
- 15 days/yr
Wind risk 4/10 · Minor
- Chance of severe wind over 30 yrs
- 19.0%
Air-quality risk 4/10 · Minor
- Unhealthy air days now
- 4 days/yr
- Unhealthy air days in 30 yrs
- 5 days/yr
Risk factors via First Street. Map © Google.
Why this score? — see what drove the B grade
The composite is a weighted blend of 9 inputs, each scored 0–100. Each bar is that input's sub-score; the figure is the points it added to the 100-point composite (weight × sub-score).
- Cash flow +27.9/30.0
- ARV discount +15.0/15.0
- DSCR +9.9/10.0
- 1% rule +6.9/10.0
- Livability +3.7/5.0
- Schools +3.6/10.0
- Rent growth +2.5/5.0
- Condition / age +2.5/5.0
- Appreciation +0.0/10.0
$700,000
🖨 Deal sheet (PDF) 📄 Offer letter ✓ Due diligence
Multi-family units
County records classify this as Multi-Family (2-4 Unit). Listing-text estimate: 1 unit. estimate disagrees with records
Listing remarks
Rare opportunity to own a classic four-unit brick apartment building in Northeast Washington, DC with tremendous value-add potential. This sun-filled multifamily property features spacious units with original hardwood flooring, enclosed rear porch areas for each unit, updated plumbing infrastructure, and a newer HVAC heating component. The expansive lower level includes washer/dryer access and offers additional possibilities for future expansion. Buyers are encouraged to perform their own due diligence regarding potential future use, as similar multifamily buildings in the area have been reconfigured for increased unit count. Ideally located near rhode island ave metro, downtown DC, major c
Key facts
- 2,720 sq ft lot
- Built 1941
- Listed 9 days
Property features AI
Exterior
- Parking: On-street parking
- Utilities: Public water; Public sewer; Natural gas for hot water
- Home design: Interior Townhouse/Rowhouse; Fee simple ownership
- Construction: Brick construction; Slab foundation; Above-grade and below-grade structures
- Exterior features: No tidal water on property; Below-grade areas both finished and unfinished
Interior
- Heating & cooling: Hot water heating; Natural gas heating fuel; Electric cooling fuel
- Interior features: Interior townhouse/rowhouse layout; Four single-room units
Neighborhood map
What this means for you Summary
Snapshot
- This is a 4-bed/4.0-bath multifamily listed at $700k.
Deal economics
- At list price, monthly cash flow is $2k ($26k/yr) — positive.
- The deal already cash-flows at list — no discount required.
- Meets the 1% rule at list price ($8k rent vs $700k).
- Cap rate 10.0% vs local median 2.5% in Washington — top-decile yield for the area; either an underpriced asset or a hidden risk that comps aren't pricing in. Stress-test before assuming the spread holds.
Location & tenants
- Location reads 73/100 on livability (#1 in DC) — a middle-class / working-renter tenant base. Strengths: amenities A+, commute A+, employment A+; Watch: crime F, cost of living F.
- District Of Columbia Public Schools (urban): math 33% / reading 40% proficiency, ranked #8 of 32 in DC (top 25%) — families likely to look elsewhere, expect single-tenant / working-renter base with shorter leases; 65% free/reduced lunch — lower-income household profile, screen leases tightly.
- Zoned schools: Capitol Hill Montessori School At Logan (424 students, 0% FRL); Brookland Ms (357 students, 0% FRL); Dunbar Hs (868 students, 0% FRL) — zoned schools average 0% FRL vs 65% district-wide (65 pts lower); this property's tenant base skews higher-income than the district average.
- Market conditions: Rents flat; 118 active listings in the ZIP; 39 comparable units currently listed for rent nearby; rentals at typical pace (median 24d on market — plan ~3-4 weeks tenant-placement turnaround); solid renter incomes; 1,737 units permitted in District of Columbia in 2024 (1,506 in 5+ unit buildings).
- At $8,359/mo this rent would consume 111% of the median local household income ($91k/yr) (locally 919% of renters already pay >50% of income on rent) — very limited rent-growth headroom before tenants either downsize or default.
Forward outlook
- Local home prices are declining (-3.0%/yr); year-one equity from $5k of loan paydown is wiped out by about $21k of value loss. Plan a longer hold.
- District of Columbia County population projected at +50% by 2050 — long-run rental-demand tailwind backs the buy-and-hold thesis.
Negotiation context
- Only 10 days on market — expect competitive offers; lowballing is unlikely to land.
- Current owner paid $130k; list at $700k implies a 438% gain — meaningful room to come down on a strong offer.
Risks & watch-outs
- Watch-outs: built in 1941 — expect roof / HVAC / electrical / plumbing capex.
- Climate carrying-cost: extreme-heat days projected 7→15/yr by 2055 (HVAC capex compounding) — expect insurance premiums to compound above CPI over the hold.
Questions for the listing agent
- Built in 1941 — when were the roof, HVAC, electrical panel, plumbing, and water heater last replaced?
- Is there a deadline driving the sale (1031 exchange, divorce, estate, relocation)? That informs how much negotiation room exists.
- Crime grade is F in this area — have there been break-ins, vandalism, or insurance claims at this property in the last 3 years? What carrier currently insures it and at what premium?
- What's the average days-on-market for RENTAL listings here right now (not sales)? A rising rental-DOM trend means longer vacancies and softer asking-rent achievability than the comps imply.
- What's the recent tenant-quality profile in this submarket — average credit score on applications, eviction rate, late-payment / NSF rate, and stable-employment percentage? A property-management company in the area should have these aggregated.
- How much new apartment / multifamily construction is in the pipeline within 1–3 miles? Heavy new supply (>2% of stock underway) typically softens rents 12–24 months out; light construction supports rent growth.
Investment metrics
- 1% rule
- 1.19% ✓
- Cap rate
- 9.99%
- Cash-on-cash
- 13.21%
- DSCR
- 1.59
- GRM
- 7.0
CMA / ARV
- ARV (on-the-fly)
- $867,200
- Comps found
- 2
Show comp detail 2 sales within ~0.75 mi
| Address | Dist | Beds/Ba | Sqft | Sold | Price | $/sf | Match |
|---|---|---|---|---|---|---|---|
| 1359 Bryant St NE | 0.03mi | 4/— | 3,200 (0%) | 10mo | $725,000 | $227 | 90 |
| 1719 West Virginia Ave NE | 0.75mi | 4/— | 3,100 (-3%) | 8mo | $840,000 | $271 | 53 |
Match score weights: distance 35% · size 25% · config 20% · recency 20%. Top-matched comps best support the ARV.
Projected returns pro-forma
-3.0% appreciation · 0.06% rent growth · sell at horizon
- IRR
- -0.0%
- Equity multiple
- 1.00×
- Total profit
- $-109
- Equity at exit
- $104,372
- IRR
- 6.5%
- Equity multiple
- 1.43×
- Total profit
- $83,494
- Equity at exit
- $60,523
Cash invested: $196,000 (down + closing). Projections, not guarantees.
Landlord ↔ Tenant lean methodology
- Overall (CITY)
- 0 Strongly Tenant-Friendly
- State District of Columbia
- 12 Strongly Tenant-Friendly · D+43
- County
- — inherits STATE
- City Washington
- 0 Strongly Tenant-Friendly · D+43
ZIP-level market 20018
- Rents YoY
- 0.1%
- Active inventory
- 118
- Price-to-rent
- 27.9×
Monthly cashflow live
- Estimated rent
- $8,359 high interval (Pro) →
- Mortgage (P&I)
- −$3,671
- Tax from tax record
- −$483 /mo · $5,794/yr
- Insurance
- −$292
- HOA
- −$0
- Vacancy / Maint / Mgmt
- −$1,755
- Net cashflow
- $2,158
Break-even live
Sensitivity live
| Price | -10% $2,554 | -5% $2,356 | +0% $2,158 | +5% $1,960 | +10% $1,762 |
|---|---|---|---|---|---|
| Rent | -10% $1,498 | -5% $1,828 | +0% $2,158 | +5% $2,488 | +10% $2,819 |
| Rate | -1.0pp $2,511 | -0.5pp $2,336 | base $2,158 | +0.5pp $1,977 | +1.0pp $1,792 |
4-unit breakdown (identical units grouped — click to expand)
| Units | Beds | Baths | Est. rent |
|---|---|---|---|
| 4× units | 1 | 1 | $8,360 |
| #1 | 1 | 1 | $2,090 |
| #2 | 1 | 1 | $2,090 |
| #3 | 1 | 1 | $2,090 |
| #4 | 1 | 1 | $2,090 |
| Total (4 units) | $8,359 | ||
UW: 25.0% down · 7.5% · 30yr · 1.5% tax · 5.0% vac · 8.0% maint · 8.0% mgmt
Financing live
Cash to close
- Down payment
- $175,000
- Closing costs
- $21,000
- Reserves months
- —
- Total cash needed
- —
Loan-product check · same deal, 3 products live
Conventional
25% down · 7.5% · 30yr
- Down + closing
- —
- Monthly P&I
- —
- Monthly cashflow
- —
- DSCR
- —
- Eligible?
- —
Personal DTI + credit; lowest rate.
DSCR
20% down · 8.5% · 30yr
- Down + closing
- —
- Monthly P&I
- —
- Monthly cashflow
- —
- DSCR
- —
- Eligible?
- —
No personal income docs; deal must DSCR.
Hard money
10% down · 12.0% · 12mo
- Down + closing
- —
- Monthly P&I
- —
- Monthly cashflow
- —
- DSCR
- —
- Eligible?
- —
Short-term bridge; refi at stabilization.
Rent comps 39 comps
| Address | Beds | Baths | Sqft | Rent | $/sqft | DOM | Units | Dist |
|---|---|---|---|---|---|---|---|---|
| 1714 Montello Ave NE Washington, DC | 4.0 | 3.0 | 2100 | $4,350 | $2.07 | 26d | 1 | 0.80mi |
| 2104 4th St NE #1 Washington, DC | 4.0 | 3.5 | 2165 | $6,150 | $2.84 | 26d | 1 | 0.82mi |
| 301 V St NE Washington, DC | 4.0 | 3.5 | 3000 | $5,650 | $1.88 | 20d | 1 | 0.88mi |
| 1255 Raum St NE Unit 1388282P Washington, DC | 2.0–8.0 | 1.0–5.0 | 3245 | $6,967 | $2.15 | 3d | 2 | 0.90mi |
| 3216 22nd St NE Washington, DC | 3.0 | 2.0 | 2156 | $4,500 | $2.09 | 20d | 1 | 0.92mi |
| 209 Douglas St NE Washington, DC | 3.0 | 2.5 | 2700 | $3,000 | $1.11 | 26d | 1 | 0.93mi |
| 3309 22nd St NE Washington, DC | 4.0 | 3.5 | 2759 | $5,850 | $2.12 | 26d | 1 | 0.99mi |
| 1222 Owen Pl NE Washington, DC | 4.0 | 2.5 | 2164 | $3,800 | $1.76 | 26d | 1 | 1.05mi |
| 2712 South Dakota Ave NE Washington, DC | 3.0 | 3.0 | 2261 | $4,300 | $1.90 | 0d | 1 | 1.10mi |
| 2712 South Dakota Ave NE Washington, DC | 3.0 | 3.0 | 2261 | $4,500 | $1.99 | 4d | 1 | 1.10mi |
| 45 Rhode Island Ave NE Unit 1388280P Washington, DC | 2.0–6.0 | 2.0–6.0 | 10398 | $10,512 | $1.01 | 0d | 2 | 1.19mi |
| 1609 Levis St NE Washington, DC | 4.0 | 4.5 | 2295 | $3,900 | $1.70 | 26d | 1 | 1.19mi |
| 137 R St NE Washington, DC | 3.0 | 1.5 | 2515 | $3,550 | $1.41 | 7d | 1 | 1.19mi |
| 1917 Lincoln Rd NE Washington, DC | 3.0 | 3.0 | 2200 | $4,500 | $2.05 | 26d | 1 | 1.20mi |
| 1167 Morse St NE #1 Washington, DC | 5.0 | 4.5 | 3409 | $8,500 | $2.49 | 26d | 1 | 1.21mi |
| 1169 Morse St NE Washington, DC | 3.0 | 3.0 | 2274 | $4,250 | $1.87 | 5d | 1 | 1.21mi |
| 1640 L St NE Washington, DC | 3.0 | 2.0 | 2300 | $3,700 | $1.61 | 20d | 1 | 1.22mi |
| 2519 N Capitol St NE Washington, DC | 5.0 | 4.0 | 2750 | $4,625 | $1.68 | 12d | 1 | 1.23mi |
| 2519 N Capitol St NE Washington, DC | 5.0 | 3.5 | 2750 | $5,350 | $1.95 | 16d | 1 | 1.23mi |
| 1117 Montello Ave NE Washington, DC | 4.0 | 3.5 | 2260 | $4,500 | $1.99 | 26d | 1 | 1.24mi |
| 2404 N Capitol St NW Unit B Washington, DC | 3.0 | 3.0 | 3554 | $5,600 | $1.58 | 16d | 1 | 1.26mi |
| 2404 N Capitol St NW Unit A Washington, DC | 3.0 | 3.0 | 3554 | $5,300 | $1.49 | 16d | 1 | 1.26mi |
| 2120 N Capitol St NW Washington, DC | 5.0 | 3.0 | 3000 | $5,500 | $1.83 | 3d | 1 | 1.27mi |
| 2032 N Capitol St NW Unit 2 Washington, DC | 3.0 | 1.0 | 3698 | $3,950 | $1.07 | 23d | 1 | 1.28mi |
| 2032 N Capitol St NW Unit 2 Washington, DC | 3.0 | 1.0 | 3698 | $3,950 | $1.07 | 26d | 1 | 1.28mi |
| 2410 South Dakota Ave NE Washington, DC | 4.0 | 3.5 | 2222 | $4,400 | $1.98 | 16d | 1 | 1.29mi |
| 1821 N Capitol St NE #2 Washington, DC | 3.0 | 1.0 | 2719 | $3,200 | $1.18 | 26d | 1 | 1.30mi |
| 13 S St NE Unit A Washington, DC | 3.0 | 3.5 | 2200 | $3,800 | $1.73 | 23d | 1 | 1.30mi |
| 13 S St NE Unit A Washington, DC | 3.0 | 3.5 | 2200 | $3,800 | $1.73 | 26d | 1 | 1.30mi |
| 17 U St NW Unit A Washington, DC | 4.0 | 3.5 | 2388 | $6,000 | $2.51 | 26d | 1 | 1.31mi |
| 12 Rhode Island Ave NW Washington, DC | 4.0 | 4.0 | 3319 | $5,500 | $1.66 | 26d | 1 | 1.31mi |
| 2615 Otis St NE Washington, DC | 3.0 | 2.0 | 2217 | $3,750 | $1.69 | 5d | 1 | 1.31mi |
| 32 Adams St NW Washington, DC | 5.0 | 4.5 | 3088 | $8,000 | $2.59 | 26d | 1 | 1.31mi |
| 15 Seaton Pl NW #1 Washington, DC | 3.0 | 2.5 | 2539 | $3,700 | $1.46 | 26d | 1 | 1.34mi |
| 58 V St NW Unit A Washington, DC | 3.0 | 2.5 | 2150 | $5,200 | $2.42 | 20d | 1 | 1.35mi |
| 33 Lower Service Ct NW Washington, DC | 4.0 | 4.5 | 2250 | $7,950 | $3.53 | 19d | 1 | 1.37mi |
| 1324 H St NE Unit 2 Washington, DC | 4.0 | 1.5 | 2100 | $4,000 | $1.90 | 26d | 1 | 1.42mi |
| 2206 First St NW Unit A Washington, DC | 5.0 | 3.5 | 3374 | $5,650 | $1.67 | 26d | 1 | 1.43mi |
| 1745 1st St NW Washington, DC | 4.0 | 3.0 | 2804 | $5,000 | $1.78 | 13d | 1 | 1.48mi |
Listing history 20 events
-
2026-06-21days on market $700,000 Active 10 DOM
-
2026-06-18days on market $700,000 Active 7 DOM
-
2026-06-17days on market $700,000 Active 6 DOM
-
2026-06-16days on market $700,000 Active 5 DOM
-
2026-06-15days on market $700,000 Active 4 DOM
-
2026-06-13statusdays on market $700,000 Active 2 DOM
-
2026-06-09days on market $700,000 Coming Soon 12 DOM
-
2026-06-08days on market $700,000 Coming Soon 11 DOM
-
2026-06-07days on market $700,000 Coming Soon 10 DOM
-
2026-06-04days on market $700,000 Coming Soon 7 DOM
-
2026-06-03days on market $700,000 Coming Soon 6 DOM
-
2026-06-02days on market $700,000 Coming Soon 5 DOM
-
2026-06-01days on market $700,000 Coming Soon 4 DOM
-
2026-05-31days on market $700,000 Coming Soon 3 DOM
-
2026-05-28historical $700,000
-
1999-08-25soldstatus $130,000
-
1999-08-20soldstatus $130,000
-
1999-07-01historical
-
1999-02-18$130,000
-
1987-02-09soldstatus $79,500
ⓘ Source: listings_history table (triggers on properties + properties_extension) + one-shot
backfill from property_details.listing_events for pre-trigger history.
Tax reassessment forecast DC · Partial reset (capped growth)
- Current annual tax
- $5,794 · $483/mo
- Projected year-2 tax
- $5,794 · $483/mo
- Expected delta
- $0/yr ($0/mo · 0.0%)
ⓘ Screening estimate from a state-policy table — verify with the county assessor before closing.
Climate risk First Street
- Flood 1/10 Low FEMA zone X (unshaded) · 0% chance over 30 yrs
- Wildfire 1/10 Low
- Heat 7/10 Severe 7 d/yr ≥106°F today · 15 d/yr by 30 yrs out
- Wind 4/10 Moderate 19% chance of damaging wind over 30 yrs
- Air quality 4/10 Moderate 4 unhealthy d/yr today · 5 by 30 yrs out
Nearby sold comps map
Loading sold comps map…
Walkable amenities ~0.75 mi
Loading nearby amenities…
Taxation est. · year 1
- Rental income
- $100,308
- − Mortgage interest
- −$39,211
- − Property taxes
- −$5,794
- − Insurance
- −$3,500
- − Repairs & maintenance
- −$8,025
- − Management
- −$8,025
- − Depreciation
- −$20,364
- Taxable income
- $15,390
- Est. tax owed @ 24.0%
- −$3,694
- After-tax cash flow
- $22,205/yr
For passive investors: Depreciation is non-cash, so a rental often shows a tax loss while cash-flowing — sheltering income. Rental losses are passive: they offset passive income freely, and up to $25,000/yr can offset ordinary (W-2) income if you actively participate and your MAGI is under $100k (phasing out to $0 by $150k); unused losses carry forward. On sale, claimed depreciation is recaptured at up to 25%, and gains may owe capital-gains tax (a 1031 exchange can defer both). Figures are a year-1 estimate at your 24.0% rate — not tax advice; consult a CPA.
Schools (NCES district)
- District
- District Of Columbia Public Schools
- NCES district ID
- 1100030
- Math proficiency
- 33% ▲ 3.00%
- Reading proficiency
- 40% ▲ 5.00%
- Median HH income
- $67,671
- Composite
- 35.84/100
- National rank
- #9606
- State rank
- #8 of 32 in DC
Livability — Washington
- Score
- 73/100
- State rank
- #1
- US rank
- #5327
Category grades
Schools grade is shown separately in the Schools card above.
Census & demographics
- Census place
- Washington, DC
- County
- District of Columbia · 671,873 people
- City population
- 671,873
- Metro
- Washington-Arlington-Alexandria, DC-VA-MD-WV
- Population (ZIP)
- 19,562
- Household income
- $90,639
- Rent vs Own
- Severe rent burden
- 919.0
Population outlook (District of Columbia County) Hauer SSP2
- Today (2025)
- 821,926 people
- By 2030
- 899,517 · +9.4%
- By 2040
- 1,061,162 · +29.1%
- By 2050
- 1,231,493 · +49.8%
- By 2075
- 1,603,312 · +95.1%
- By 2100
- 1,847,141 · +124.7%
Race, ethnicity, and origin ACS 2023
- Neighborhood character
- Predominantly Black (66%)
- Race & ethnicity
- Black 66% White 18% Hispanic / Latino 9% Two or more races 8% Asian 1%
- Hispanic origin (detail)
- Mexican 2% Dominican 1%
- Common ancestry
- Italian 2% Romanian 1% Serbian 1%
- Foreign-born
- 8% · Canada
- Languages at home
- 89% English-only · Spanish 8% Other Indo-European 1% German/W. Germanic 1%
Political lean MEDSL · District of Columbia
- 2024 margin
- Solid D (+86.1) · D 91.2% · R 5.1% · Other 3.8%
- 2008→2024 swing
- +0.1pp no change · 2008: 85.9pp · 2024: 86.1pp
- All cycles
- 2024: D+86.1 2020: D+86.8 2016: D+88.7 2012: D+84.2 2008: D+85.9
Not yet ingested
- Civics
- —
Market trends
- HPI YoY
- ▼ -605.95%
- Current HPI
- 381.7099
- Rent YoY
- ▲ 0.06%
- Metro
- Washington-Arlington-Alexandria, DC-VA-MD-WV
- State GDP YoY
- ▲ 1.33%
- F500 in state
- 6
Industry mix (Fortune 500 HQ in DC)
| Industry | F500 HQs | Revenue |
|---|---|---|
| Financial Services | 1 | $153B |
|
||
| Life Sciences / Industrials | 1 | $25B |
|
||
| Industrial Machinery | 1 | $8B |
|
||
Price history
+780.5% since first listed6 events — show timeline
- 2026-05-28 Coming Soon $700,000 BRIGHT MLS
- 1999-08-25 Sold (Public Records) $130,000 Public Records
- 1999-08-20 Sold (MLS) $130,000 MRIS
- 1999-07-01 Delisted — MRIS
- 1999-02-18 Listed $130,000 MRIS
- 1987-02-09 Sold (Public Records) $79,500 Public Records
Property tax history
+9.2%/yrLatest (2025): $5,794 · +9.5% YoY. Source: county tax records.
Cash-flow waterfall
monthlySold comps — $/sqft
last 12 mo · ≤1 miLoading sold comps…