4041 Grange Hall Rd Unit 8-V008 · Holly, MI
Flood risk 1/10 · Minimal
- FEMA flood zone
- X (unshaded)
- Chance of flooding over 30 yrs
- 0.0%
- Est. flood insurance / yr
- $473 – $860
Fire risk 1/10 · Minimal
- Est. fire insurance / yr
- $784 – $1,456
Heat risk 2/10 · Minimal
- Hot days now (above 96°F)
- 7 days/yr
- Hot days in 30 yrs
- 15 days/yr
Wind risk 2/10 · Minimal
- Chance of severe wind over 30 yrs
- —
Air-quality risk 3/10 · Minor
- Unhealthy air days now
- 2 days/yr
- Unhealthy air days in 30 yrs
- 3 days/yr
Risk factors via First Street. Map © Google.
Why this score? — see what drove the B grade
The composite is a weighted blend of 9 inputs, each scored 0–100. Each bar is that input's sub-score; the figure is the points it added to the 100-point composite (weight × sub-score).
- Cash flow +30.0/30.0
- DSCR +10.0/10.0
- 1% rule +9.5/10.0
- ARV discount +7.5/15.0
- Condition / age +4.0/5.0
- Livability +3.8/5.0
- Schools +3.7/10.0
- Rent growth +2.5/5.0
- Appreciation +0.0/10.0
$116,995
🖨 Deal sheet 📄 Offer letter ✓ Due diligence
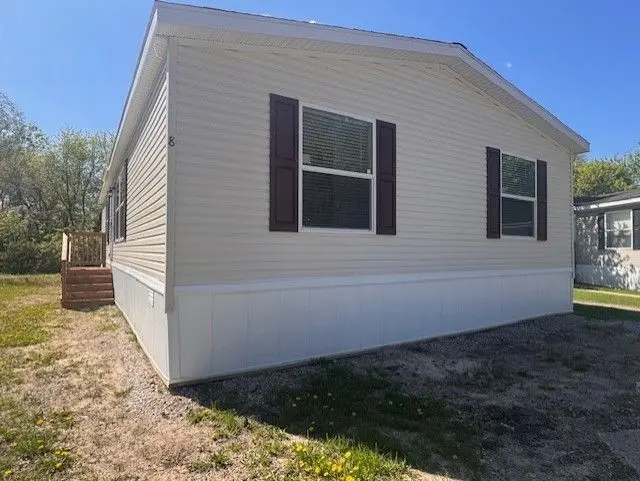
Listing remarks
Brand new home coming soon! Great wooded lot and offers a lot of privacy. This 3 bed/2 bath home has a beautiful space with bright white cabinets and sleek black appliances. This home will be ready soon to occupy. Call today for more information.
Key facts
- Built 2026
- Listed 18 days
Neighborhood map
What this means for you Summary
Snapshot
- This is a 3-bed/2.0-bath manufactured listed at $117k. Condition is rated good.
Deal economics
- At list price, monthly cash flow is $535 ($6k/yr) — positive.
- The deal already cash-flows at list — no discount required.
- Meets the 1% rule at list price ($2k rent vs $117k).
- Recommended offer: $115k (1.5% below list) — sets the bar for market timing.
- Cap rate 11.8% vs local median 3.6% in Holly — top-decile yield for the area; either an underpriced asset or a hidden risk that comps aren't pricing in. Stress-test before assuming the spread holds.
Location & tenants
- Location reads 75/100 on livability (#156 in MI, #3,930 nationally) — a middle-class / working-renter tenant base. Strengths: crime A+, cost of living A+, housing A+; Watch: amenities F, commute F, employment D-.
- Holly Area School District (town): math 31% / reading 52% proficiency, ranked #165 of 540 in MI (top 31%) — families likely to look elsewhere, expect single-tenant / working-renter base with shorter leases.
- Market conditions: 153 active listings in the ZIP; 3 comparable units currently listed for rent nearby; rentals at typical pace (median 24d on market — plan ~3-4 weeks tenant-placement turnaround); solid renter incomes; 2,614 units permitted in Oakland County in 2024 (721 in 5+ unit buildings).
Forward outlook
- Local home prices are declining (-3.0%/yr); year-one equity from $809 of loan paydown is wiped out by about $4k of value loss. Plan a longer hold.
- Oakland County population projected at +10% by 2050 — modest demand growth; plan on rents tracking national, not racing it.
- At projected returns (-3.0% appreciation + 3.0% rent growth), your $33k cash investment doubles in ~7 years — after that, you're playing with house money.
Negotiation context
- It's been on market 19 days — a 2% lower offer ($115k) is reasonable based on typical stale-listing flexibility.
Questions for the listing agent
- Is there a deadline driving the sale (1031 exchange, divorce, estate, relocation)? That informs how much negotiation room exists.
- What's the average days-on-market for RENTAL listings here right now (not sales)? A rising rental-DOM trend means longer vacancies and softer asking-rent achievability than the comps imply.
- What's the recent tenant-quality profile in this submarket — average credit score on applications, eviction rate, late-payment / NSF rate, and stable-employment percentage? A property-management company in the area should have these aggregated.
- How much new for-sale + rental construction is in the pipeline within 1–3 miles? Heavy new supply typically softens prices + rents 12–24 months out; constrained supply supports both.
Investment metrics
- 1% rule
- 1.45% ✓
- Cap rate
- 11.78%
- Cash-on-cash
- 19.60%
- DSCR
- 1.87
- GRM
- 5.7
CMA / ARV
No comps found within radius.
Projected returns pro-forma
-3.0% appreciation · 3.0% rent growth · sell at horizon
- IRR
- 11.6%
- Equity multiple
- 1.46×
- Total profit
- $15,141
- Equity at exit
- $17,444
- IRR
- 20.6%
- Equity multiple
- 2.75×
- Total profit
- $57,164
- Equity at exit
- $10,116
Cash invested: $32,759 (down + closing). Projections, not guarantees.
Landlord ↔ Tenant lean methodology
- Overall (STATE)
- 62 Landlord-Friendly
- State Michigan
- 62 Landlord-Friendly · EVEN
- County
- — inherits STATE
- City
- — inherits STATE
ZIP-level market 48442
- Active inventory
- 153
- Price-to-rent
- 5.7×
Monthly cashflow live
- Estimated rent
- $1,701 medium interval (Pro) →
- Mortgage (P&I)
- −$614
- Tax est. 1.5%
- −$146 /mo · $1,755/yr
- Insurance
- −$49
- HOA
- −$0
- Vacancy / Maint / Mgmt
- −$357
- Net cashflow
- $535
Break-even live
UW: 25.0% down · 7.5% · 30yr · 1.5% tax · 5.0% vac · 8.0% maint · 8.0% mgmt
Financing live
Cash to close
- Down payment
- $29,249
- Closing costs
- $3,510
- Reserves months
- —
- Total cash needed
- —
Loan-product check · same deal, 3 products live
Conventional
25% down · 7.5% · 30yr
- Down + closing
- —
- Monthly P&I
- —
- Monthly cashflow
- —
- DSCR
- —
- Eligible?
- —
Personal DTI + credit; lowest rate.
DSCR
20% down · 8.5% · 30yr
- Down + closing
- —
- Monthly P&I
- —
- Monthly cashflow
- —
- DSCR
- —
- Eligible?
- —
No personal income docs; deal must DSCR.
Hard money
10% down · 12.0% · 12mo
- Down + closing
- —
- Monthly P&I
- —
- Monthly cashflow
- —
- DSCR
- —
- Eligible?
- —
Short-term bridge; refi at stabilization.
Rent comps 3 comps
| Address | Beds | Baths | Sqft | Rent | $/sqft | DOM | Units | Dist |
|---|---|---|---|---|---|---|---|---|
| 4261 Grange Hall Rd Holly, MI | 2.0–3.0 | 2.0 | 1136 | $1,469 | $1.29 | 1d | 1 | 0.31mi |
| 3303 Grange Hall Rd Holly, MI | 2.0 | 1.0 | 950 | $1,099 | $1.16 | 24d | 1 | 0.65mi |
| 315 Crescent Ave Holly, MI | 3.0 | 1.0 | 1100 | $1,495 | $1.36 | 24d | 1 | 1.00mi |
Listing history 1 events
-
2026-05-11$116,995 Active 246-char remark
ⓘ Source: listings_history table (triggers on properties + properties_extension) + one-shot
backfill from property_details.listing_events for pre-trigger history.
Climate risk First Street
- Flood 1/10 Low FEMA zone X (unshaded) · 0% chance over 30 yrs
- Wildfire 1/10 Low
- Heat 2/10 Low 7 d/yr ≥96°F today · 15 d/yr by 30 yrs out
- Wind 2/10 Low
- Air quality 3/10 Moderate 2 unhealthy d/yr today · 3 by 30 yrs out
Nearby sold comps map
Loading sold comps map…
Walkable amenities ~0.75 mi
Loading nearby amenities…
Taxation est. · year 1
- Rental income
- $20,408
- − Mortgage interest
- −$6,554
- − Property taxes
- −$1,755
- − Insurance
- −$585
- − Repairs & maintenance
- −$1,633
- − Management
- −$1,633
- − Depreciation
- −$3,403
- Taxable income
- $4,846
- Est. tax owed @ 24.0%
- −$1,163
- After-tax cash flow
- $5,257/yr
For passive investors: Depreciation is non-cash, so a rental often shows a tax loss while cash-flowing — sheltering income. Rental losses are passive: they offset passive income freely, and up to $25,000/yr can offset ordinary (W-2) income if you actively participate and your MAGI is under $100k (phasing out to $0 by $150k); unused losses carry forward. On sale, claimed depreciation is recaptured at up to 25%, and gains may owe capital-gains tax (a 1031 exchange can defer both). Figures are a year-1 estimate at your 24.0% rate — not tax advice; consult a CPA.
Condition & rehab AI · 14 photos
This brand new manufactured home is move-in ready with new finishes and features, offering a great wooded lot and privacy. Minor painting and landscaping improvements could further enhance its curb appeal and value.
Value-add opportunities
- Both Painting exterior and interior walls — Enhances curb appeal and interior aesthetics.
- Both Landscaping and curb appeal improvements — Enhances curb appeal and property value.
- Both New flooring in living areas — Enhances living space and adds value for both resale and rental.
Renovation cost estimate screening
Value-add ROI direction
- Both Painting exterior and interior walls — Enhances curb appeal and interior aesthetics. ↑
- Both Landscaping and curb appeal improvements — Enhances curb appeal and property value. ↑
- Both New flooring in living areas — Enhances living space and adds value for both resale and rental. ↑
ⓘ Cost ranges are severity-bucket heuristics (US national rule-of-thumb). Get contractor quotes + a written scope before underwriting a rehab budget.
Schools (NCES district)
- District
- Holly Area School District
- NCES district ID
- 2618450
- Math proficiency
- 31% ▼ -12.00%
- Reading proficiency
- 52% ▼ -7.00%
- Median HH income
- $65,137
- Composite
- 37.1/100
- National rank
- #4496
- State rank
- #165 of 540 in MI
Livability — Holly
- Score
- 75/100
- State rank
- #156
- US rank
- #3930
Category grades
Schools grade is shown separately in the Schools card above.
Census & demographics
- Census place
- Holly, MI
- County
- Oakland County · 1,009,092 people
- City population
- 22,788
- Metro
- Detroit-Warren-Dearborn, MI
- Population (ZIP)
- 22,788
- Household income
- $86,575
- Rent vs Own
- Severe rent burden
- 532.0
Population outlook (Oakland County) Hauer SSP2
- Today (2025)
- 1,335,747 people
- By 2030
- 1,375,100 · +2.9%
- By 2040
- 1,435,385 · +7.5%
- By 2050
- 1,469,250 · +10.0%
- By 2075
- 1,531,946 · +14.7%
- By 2100
- 1,450,485 · +8.6%
Race, ethnicity, and origin ACS 2023
- Neighborhood character
- Predominantly White (89%)
- Race & ethnicity
- White 89% Two or more races 6% Hispanic / Latino 3% Black 3%
- Common ancestry
- Romanian 8% Slovak 4% Lithuanian 3%
- Foreign-born
- 4% · Canada
- Languages at home
- 96% English-only · Spanish 1% Russian/Polish/Slavic 1% Arabic 1%
Political lean MEDSL · Oakland
- 2024 margin
- D (+10.6) · D 54.4% · R 43.8% · Other 1.9%
- 2008→2024 swing
- -3.9pp toward R · 2008: 14.5pp · 2024: 10.6pp
- All cycles
- 2024: D+10.6 2020: D+14.1 2016: D+8.1 2012: D+8.1 2008: D+14.5
Not yet ingested
- Civics
- —
Market trends
- HPI YoY
- ▼ -229.30%
- Current HPI
- 227.7078
- Rent YoY
- —
- Metro
- Detroit-Warren-Dearborn, MI
- State GDP YoY
- ▲ 1.37%
- F500 in state
- 28
Industry mix (Fortune 500 HQ in MI)
| Industry | F500 HQs | Revenue |
|---|---|---|
| Automotive Parts | 3 | $48B |
|
||
| Automotive | 2 | $372B |
|
||
| Chemicals | 1 | $45B |
|
||
| Automotive Retail | 1 | $29B |
|
||
| Healthcare / Medical Devices | 1 | $23B |
|
||
| Automotive Technology | 1 | $20B |
|
||
Cash-flow waterfall
monthlySold comps — $/sqft
last 12 mo · ≤1 miLoading sold comps…