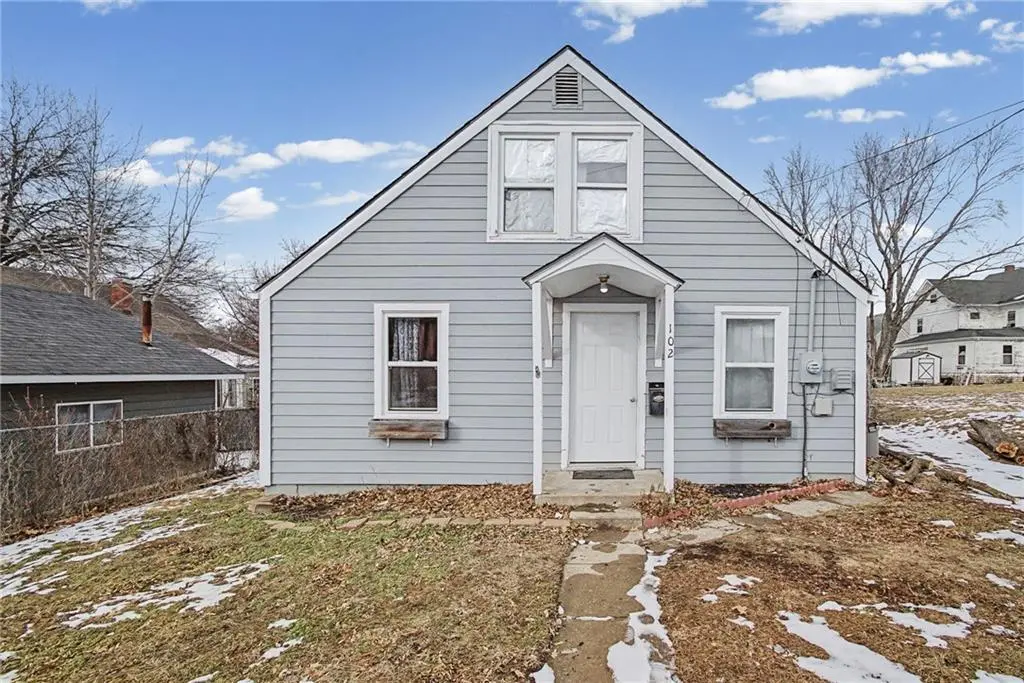
102 W Black Diamond St · Richmond, MO
Flood risk 1/10 · Minimal
- FEMA flood zone
- X (unshaded)
- Chance of flooding over 30 yrs
- 0.0%
- Est. flood insurance / yr
- $507 – $1,088
Fire risk 3/10 · Minor
- Est. fire insurance / yr
- $1,054 – $1,958
Heat risk 4/10 · Minor
- Hot days now (above 107°F)
- 7 days/yr
- Hot days in 30 yrs
- 16 days/yr
Wind risk 2/10 · Minimal
- Chance of severe wind over 30 yrs
- —
Air-quality risk 2/10 · Minimal
- Unhealthy air days now
- 2 days/yr
- Unhealthy air days in 30 yrs
- 2 days/yr
Risk factors via First Street. Map © Google.
Why this score? — see what drove the B grade
The composite is a weighted blend of 9 inputs, each scored 0–100. Each bar is that input's sub-score; the figure is the points it added to the 100-point composite (weight × sub-score).
- Cash flow +30.0/30.0
- DSCR +10.0/10.0
- 1% rule +8.9/10.0
- ARV discount +7.5/15.0
- Appreciation +5.1/10.0
- Livability +3.4/5.0
- Schools +3.0/10.0
- Rent growth +2.5/5.0
- Condition / age +2.5/5.0
$70,000
🖨 Deal sheet (PDF) 📄 Offer letter ✓ Due diligence
Listing remarks
Welcome to 102 W Black Diamond Street in Richmond, Missouri This charming bungalow offers an affordable opportunity for homeownership or investment. Featuring 2 bedrooms, 1 bathroom, the home provides a functional layout with a spacious living room, kitchen, main-level laundry, and a large upper-level bedroom that offers flexible use for sleeping quarters, a home office, or hobby space. Conveniently located near downtown Richmond, shopping, schools, and local amenities, this property offers small-town living with everyday conveniences nearby. Whether you re a first-time buyer, investor, or someone looking to add your own personal touches, this home presents a great opportunity to build equ
Key facts
- Main-level laundry
- Spacious living room
- 3,920 sq ft lot
Tags
Property features AI
Finance
- Other: Located on a city lot (~0.09 acres); Not in a flood plain
- HOA & community: No association fees; Janitorial service (maintenance description provided)
Exterior
- Parking: Other parking
- Utilities: Public water; Public sewer
- Home design: Single-family residence (Bungalow floor plan); Residential property
- Construction: Frame construction; Composition roof; Crawl space foundation; Property is 76–100 years old
- Exterior features: Front porch
Interior
- Kitchen: Electric range
- Bedrooms: Two bedrooms — one on the first floor and one on the upper level
- Flooring: Other
- Bathrooms: One full bathroom (first floor)
- Heating & cooling: Natural gas heating; Electric cooling
- Interior features: Ceiling fan(s); Eat-in kitchen
- Laundry & utility: Dedicated laundry room located off the kitchen
Neighborhood map
What this means for you Summary
Snapshot
- This is a 2-bed/1.0-bath single-family listed at $70k.
Deal economics
- At list price, monthly cash flow is $282 ($3k/yr) — positive.
- The deal already cash-flows at list — no discount required.
- Meets the 1% rule at list price ($974 rent vs $70k).
- Cap rate 11.1% vs local median 3.6% in Richmond — top-decile yield for the area; either an underpriced asset or a hidden risk that comps aren't pricing in. Stress-test before assuming the spread holds.
Location & tenants
- Location reads 67/100 on livability (#198 in MO) — a middle-class / working-renter tenant base. Strengths: cost of living A+, housing A+; Watch: health & safety C-, amenities F, commute F.
- Richmond R-XVI (town): math 32% / reading 39% proficiency, ranked #209 of 324 in MO (top 64%) — families likely to look elsewhere, expect single-tenant / working-renter base with shorter leases.
- Zoned schools: Sunrise Elem. (math 33% / reading 37%, grade F, #672 of 1,115 statewide, top 60%, 447 students, 53% FRL); Richmond Middle (math 35% / reading 39%, grade F, #220 of 391 statewide, top 59%, 359 students, 40% FRL); Richmond High (math 22% / reading 47%, grade F, #321 of 521 statewide, top 67%, 454 students, 32% FRL) — zoned schools at 42% FRL track the district average.
- Market conditions: 102 active listings in the ZIP; 3 comparable units currently listed for rent nearby; rentals leasing fast (median 4d on market — plan ~1-2 weeks tenant-placement turnaround); 56 units permitted in Ray County in 2024 (0 in 5+ unit buildings).
Forward outlook
- In year one you build about $691 of equity ($484 loan paydown + $207 appreciation (0.3% local appreciation)).
- Ray County population projected at -23% by 2050 — secular population decline; favor cash flow + early exit over multi-decade hold.
- At projected returns (0.3% appreciation + 3.0% rent growth), your $20k cash investment doubles in ~5 years — after that, you're playing with house money.
Negotiation context
- Only 14 days on market — expect competitive offers; lowballing is unlikely to land.
- 6 sale attempts since 6y ago with the ask held roughly flat each time — persistent listings suggest the price (not the market) is what's stuck; bring a comps-based counter.
Risks & watch-outs
- Watch-outs: built in 1946 — expect roof / HVAC / electrical / plumbing capex.
Questions for the listing agent
- Built in 1946 — when were the roof, HVAC, electrical panel, plumbing, and water heater last replaced?
- Is there a deadline driving the sale (1031 exchange, divorce, estate, relocation)? That informs how much negotiation room exists.
- Schools are D-rated, which usually means shorter tenancies and higher turnover. Who's the typical renter profile here, and what's been the actual vacancy rate?
- What's the average days-on-market for RENTAL listings here right now (not sales)? A rising rental-DOM trend means longer vacancies and softer asking-rent achievability than the comps imply.
- What's the recent tenant-quality profile in this submarket — average credit score on applications, eviction rate, late-payment / NSF rate, and stable-employment percentage? A property-management company in the area should have these aggregated.
- How much new for-sale + rental construction is in the pipeline within 1–3 miles? Heavy new supply typically softens prices + rents 12–24 months out; constrained supply supports both.
Investment metrics
- 1% rule
- 1.39% ✓
- Cap rate
- 11.13%
- Cash-on-cash
- 17.26%
- DSCR
- 1.77
- GRM
- 6.0
CMA / ARV
- ARV (median comp)
- $147,556
- List price
- $70,000
- Delta
- -39.01%
- Verdict
- UNDERPRICED
- Comps
- 20 within 1.0 mi
Show comp detail 12 sales within ~0.75 mi
| Address | Dist | Beds/Ba | Sqft | Sold | Price | $/sf | Match |
|---|---|---|---|---|---|---|---|
| 309 Joseph St | 0.66mi | 2/1.0 | 900 (0%) | 2mo | $159,900 | $178 | 68 |
| 314 E Lexington St | 0.36mi | 2/1.0 | 968 (+8%) | 10mo | $112,000 | $116 | 62 |
| 701 W Lexington St | 0.55mi | 2/1.0 | 858 (-5%) | 6mo | $155,000 | $181 | 61 |
| 802 Reyburn St | 0.72mi | 3/1.0 (+1) | 893 (-1%) | 4mo | $41,900 | $47 | 57 |
| 403 S Thornton St | 0.38mi | 2/1.0 | 1,017 (+13%) | 6mo | $59,500 | $59 | 56 |
| 905 W Main St | 0.70mi | 2/1.0 | 950 (+6%) | 6mo | $149,000 | $157 | 53 |
| 509 Sycamore Dr | 0.47mi | 3/1.0 (+1) | 1,008 (+12%) | 1mo | $220,000 | $218 | 52 |
| 806 Jabez St | 0.64mi | 3/1.0 (+1) | 948 (+5%) | 8mo | $130,000 | $137 | 50 |
| 515 Cunningham St | 0.61mi | 2/1.0 | 783 (-13%) | 1mo | $145,000 | $185 | 49 |
| 403 Forrest St | 0.43mi | 3/1.0 (+1) | 1,000 (+11%) | 9mo | $119,900 | $120 | 48 |
| 506 Cunningham St | 0.55mi | 2/1.0 | 1,000 (+11%) | 13mo | $134,900 | $135 | 45 |
| 804 Reyburn St | 0.74mi | 3/1.0 (+1) | 1,015 (+13%) | 12mo | $96,000 | $95 | 29 |
Match score weights: distance 35% · size 25% · config 20% · recency 20%. Top-matched comps best support the ARV.
Projected returns pro-forma
0.3% appreciation · 3.0% rent growth · sell at horizon
- IRR
- 17.6%
- Equity multiple
- 1.86×
- Total profit
- $16,902
- Equity at exit
- $21,367
- IRR
- 21.6%
- Equity multiple
- 3.46×
- Total profit
- $48,208
- Equity at exit
- $26,531
Cash invested: $19,600 (down + closing). Projections, not guarantees.
Landlord ↔ Tenant lean methodology
- Overall (STATE)
- 81 Strongly Landlord-Friendly
- State Missouri
- 81 Strongly Landlord-Friendly · R+10
- County
- — inherits STATE
- City
- — inherits STATE
ZIP-level market 64085
- Home prices YoY
- 0.1%
- Active inventory
- 102
- Price-to-rent
- 6.0×
Monthly cashflow live
- Estimated rent
- $974 medium interval (Pro) →
- Mortgage (P&I)
- −$367
- Tax from tax record
- −$91 /mo · $1,098/yr
- Insurance
- −$29
- HOA
- −$0
- Vacancy / Maint / Mgmt
- −$205
- Net cashflow
- $282
Break-even live
Sensitivity live
| Price | -10% $322 | -5% $302 | +0% $282 | +5% $262 | +10% $242 |
|---|---|---|---|---|---|
| Rent | -10% $205 | -5% $243 | +0% $282 | +5% $320 | +10% $359 |
| Rate | -1.0pp $317 | -0.5pp $300 | base $282 | +0.5pp $264 | +1.0pp $245 |
UW: 25.0% down · 7.5% · 30yr · 1.5% tax · 5.0% vac · 8.0% maint · 8.0% mgmt
Financing live
Cash to close
- Down payment
- $17,500
- Closing costs
- $2,100
- Reserves months
- —
- Total cash needed
- —
Loan-product check · same deal, 3 products live
Conventional
25% down · 7.5% · 30yr
- Down + closing
- —
- Monthly P&I
- —
- Monthly cashflow
- —
- DSCR
- —
- Eligible?
- —
Personal DTI + credit; lowest rate.
DSCR
20% down · 8.5% · 30yr
- Down + closing
- —
- Monthly P&I
- —
- Monthly cashflow
- —
- DSCR
- —
- Eligible?
- —
No personal income docs; deal must DSCR.
Hard money
10% down · 12.0% · 12mo
- Down + closing
- —
- Monthly P&I
- —
- Monthly cashflow
- —
- DSCR
- —
- Eligible?
- —
Short-term bridge; refi at stabilization.
Rent comps 3 comps
| Address | Beds | Baths | Sqft | Rent | $/sqft | DOM | Units | Dist |
|---|---|---|---|---|---|---|---|---|
| 1105 Fairway Dr Richmond, MO | 2.0 | 1.0 | 782 | $925 | $1.18 | 3d | 1 | 1.37mi |
| 1101 S Camden St Unit 1107 1 Richmond, MO | 2.0 | 1.0 | 750 | $1,000 | $1.33 | 4d | 1 | 1.38mi |
| 1101 S Camden St Unit 1105 5 Richmond, MO | 2.0 | 1.0 | 750 | $1,000 | $1.33 | 3d | 1 | 1.38mi |
Listing history 28 events
-
2026-06-21days on market $70,000 Active 14 DOM
-
2026-06-21days on market $70,000 Active 13 DOM
-
2026-06-18days on market $70,000 Active 11 DOM
-
2026-06-17days on market $70,000 Active 10 DOM
-
2026-06-16days on market $70,000 Active 9 DOM
-
2026-06-15days on market $70,000 Active 8 DOM
-
2026-06-13days on market $70,000 Active 6 DOM
-
2026-06-12days on market $70,000 Active 5 DOM
-
2026-06-09days on market $70,000 Active 2 DOM
-
2026-06-08remarks 699-char remark
-
2026-06-08pricestatusdays on market $70,000 Active 1 DOM
-
2026-04-27price $90,000 850-char remark
-
2026-03-13price $95,000 850-char remark
-
2026-02-24price $100,000 850-char remark
-
2026-02-05$115,000 Active 850-char remark
-
2026-01-30historical $115,000 850-char remark
-
2025-01-11historical
-
2024-09-04price $130,000
-
2024-05-22$135,000 Active
-
2022-01-05soldstatus Closed
-
2021-11-20status Pending
-
2021-11-05$105,000 Active
-
2021-08-17historical
-
2021-07-21price $49,000
-
2021-07-09$54,000 Active
-
2020-11-06soldstatus Closed
-
2020-10-07status Pending
-
2020-10-04$25,000 Active
ⓘ Source: listings_history table (triggers on properties + properties_extension) + one-shot
backfill from property_details.listing_events for pre-trigger history.
Tax reassessment forecast MO · Resets to sale price
- Current annual tax
- $1,098 · $91/mo
- Projected year-2 tax
- $1,098 · $91/mo
- Expected delta
- $0/yr ($0/mo · 0.0%)
ⓘ Screening estimate from a state-policy table — verify with the county assessor before closing.
Climate risk First Street
- Flood 1/10 Low FEMA zone X (unshaded) · 0% chance over 30 yrs
- Wildfire 3/10 Moderate
- Heat 4/10 Moderate 7 d/yr ≥107°F today · 16 d/yr by 30 yrs out
- Wind 2/10 Low
- Air quality 2/10 Low 2 unhealthy d/yr today · 2 by 30 yrs out
Nearby sold comps map
Loading sold comps map…
Walkable amenities ~0.75 mi
Loading nearby amenities…
Taxation est. · year 1
- Rental income
- $11,691
- − Mortgage interest
- −$3,921
- − Property taxes
- −$1,098
- − Insurance
- −$350
- − Repairs & maintenance
- −$935
- − Management
- −$935
- − Depreciation
- −$2,036
- Taxable income
- $2,415
- Est. tax owed @ 24.0%
- −$580
- After-tax cash flow
- $2,803/yr
For passive investors: Depreciation is non-cash, so a rental often shows a tax loss while cash-flowing — sheltering income. Rental losses are passive: they offset passive income freely, and up to $25,000/yr can offset ordinary (W-2) income if you actively participate and your MAGI is under $100k (phasing out to $0 by $150k); unused losses carry forward. On sale, claimed depreciation is recaptured at up to 25%, and gains may owe capital-gains tax (a 1031 exchange can defer both). Figures are a year-1 estimate at your 24.0% rate — not tax advice; consult a CPA.
Schools (NCES district)
- District
- Richmond R-XVI
- NCES district ID
- 2926480
- Math proficiency
- 32% ▼ -11.00%
- Reading proficiency
- 39% ▼ -8.00%
- Median HH income
- $44,070
- Composite
- 30.17/100
- National rank
- #6321
- State rank
- #209 of 324 in MO
Livability — Richmond
- Score
- 67/100
- State rank
- #198
- US rank
- #10160
Category grades
Schools grade is shown separately in the Schools card above.
Census & demographics
- Census place
- Richmond, MO
- Population (ZIP)
- 8,113
Population outlook (Ray County) Hauer SSP2
- Today (2025)
- 21,420 people
- By 2030
- 20,507 · -4.3%
- By 2040
- 18,550 · -13.4%
- By 2050
- 16,516 · -22.9%
- By 2075
- 12,899 · -39.8%
- By 2100
- 10,413 · -51.4%
Race, ethnicity, and origin ACS 2023
- Neighborhood character
- Predominantly White (91%)
- Race & ethnicity
- White 91% Hispanic / Latino 3% Two or more races 3% Black 2% Native American 1%
- Common ancestry
- Lithuanian 3% Slovak 2% Italian 1%
- Foreign-born
- 1% · Canada
- Languages at home
- 97% English-only · Spanish 2%
Political lean MEDSL · Ray
- 2024 margin
- Solid R (+48.7) · D 25.1% · R 73.8% · Other 1.1%
- 2008→2024 swing
- -45.5pp toward R · 2008: -3.2pp · 2024: -48.7pp
- All cycles
- 2024: R+48.7 2020: R+45.0 2016: R+37.1 2012: R+14.9 2008: R+3.2
Not yet ingested
- Civics
- —
Market trends
- HPI YoY
- ▲ 0.30%
- Current HPI
- 374.3671
- Rent YoY
- —
- Metro
- —
- State GDP YoY
- ▲ 1.84%
- F500 in state
- 20
Industry mix (Fortune 500 HQ in MO)
| Industry | F500 HQs | Revenue |
|---|---|---|
| Healthcare | 1 | $163B |
|
||
| Insurance | 1 | $21B |
|
||
| Industrial Technology | 1 | $17B |
|
||
| Retail | 1 | $16B |
|
||
| Industrial Distribution | 1 | $10B |
|
||
| Utilities | 1 | $9B |
|
||
Price history
+180.0% since first listed19 events — show timeline
- 2026-06-07 Listed $70,000 Heartland MLS as Distributed by MLS Grid
- 2026-05-20 Listing Removed — Heartland MLS as Distributed by MLS Grid
- 2026-04-27 Price Changed $90,000 Heartland MLS as Distributed by MLS Grid
- 2026-03-13 Price Changed $95,000 Heartland MLS as Distributed by MLS Grid
- 2026-02-24 Price Changed $100,000 Heartland MLS as Distributed by MLS Grid
- 2026-02-05 Listed $115,000 Heartland MLS as Distributed by MLS Grid
- 2026-01-30 Coming Soon — Heartland MLS as Distributed by MLS Grid
- 2025-01-11 Listing Removed — Heartland MLS as Distributed by MLS Grid
- 2024-09-04 Price Changed $130,000 Heartland MLS as Distributed by MLS Grid
- 2024-05-22 Listed $135,000 Heartland MLS as Distributed by MLS Grid
- 2022-01-05 Sold (MLS) — Heartland MLS as Distributed by MLS Grid
- 2021-11-20 Pending — Heartland MLS as Distributed by MLS Grid
- 2021-11-05 Listed $105,000 Heartland MLS as Distributed by MLS Grid
- 2021-08-17 Listing Removed — Heartland MLS as Distributed by MLS Grid
- 2021-07-21 Price Changed $49,000 Heartland MLS as Distributed by MLS Grid
- 2021-07-09 Listed $54,000 Heartland MLS as Distributed by MLS Grid
- 2020-11-06 Sold (MLS) — Heartland MLS as Distributed by MLS Grid
- 2020-10-07 Pending — Heartland MLS as Distributed by MLS Grid
- 2020-10-04 Listed $25,000 Heartland MLS as Distributed by MLS Grid
Property tax history
+13.4%/yrLatest (2025): $1,098 · +20.0% YoY. Source: county tax records.
Cash-flow waterfall
monthlySold comps — $/sqft
last 12 mo · ≤1 miLoading sold comps…