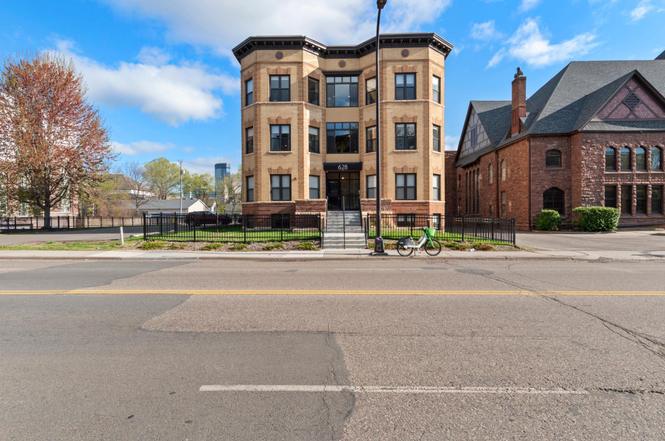
628 E Franklin Ave #301 · Minneapolis, MN
Flood risk 1/10 · Minimal
- FEMA flood zone
- X (unshaded)
- Chance of flooding over 30 yrs
- 0.0%
- Est. flood insurance / yr
- $473 – $860
Fire risk 1/10 · Minimal
- Est. fire insurance / yr
- $888 – $1,650
Heat risk 2/10 · Minimal
- Hot days now (above 99°F)
- 7 days/yr
- Hot days in 30 yrs
- 14 days/yr
Wind risk 2/10 · Minimal
- Chance of severe wind over 30 yrs
- —
Air-quality risk 2/10 · Minimal
- Unhealthy air days now
- 1 days/yr
- Unhealthy air days in 30 yrs
- 1 days/yr
Risk factors via First Street. Map © Google.
Why this score? — see what drove the C+ grade
The composite is a weighted blend of 9 inputs, each scored 0–100. Each bar is that input's sub-score; the figure is the points it added to the 100-point composite (weight × sub-score).
- Cash flow +24.7/30.0
- 1% rule +10.0/10.0
- DSCR +8.0/10.0
- ARV discount +7.5/15.0
- Livability +3.9/5.0
- Schools +3.5/10.0
- Rent growth +2.8/5.0
- Condition / age +2.5/5.0
- Appreciation +0.0/10.0
$117,500
🖨 Deal sheet (PDF) 📄 Offer letter ✓ Due diligence
Listing remarks
Price reduced. This 3-bedroom, 2-bath condominium offers modern living in a vibrant community. The spacious layout includes an in-unit laundry, ensuring convenience and efficiency. Residents can gather in the community room for social events or meetings, and there’s an additional activity room for recreational purposes. Additionally, each unit features its own storage space for keeping belongings organized. A community land trust property, meaning the buyer must meet income qualifications and be pre-approved by a lender partner, is among the program requirements. Owner occupancy is required, and resale restrictions are in place.
Key facts
- Activity room
- Storage space
- In unit laundry
Tags
Neighborhood map
What this means for you Summary
Snapshot
- This is a 3-bed/2.0-bath condo listed at $118k.
Deal economics
- At list price, monthly cash flow is $245 ($3k/yr) — positive.
- The deal already cash-flows at list — no discount required.
- Meets the 1% rule at list price ($2k rent vs $118k).
- Recommended offer: $110k (6.0% below list) — sets the bar for market timing.
- Cap rate 8.8% vs local median 3.1% in Minneapolis — top-decile yield for the area; either an underpriced asset or a hidden risk that comps aren't pricing in. Stress-test before assuming the spread holds.
Location & tenants
- Location reads 78/100 on livability (#110 in MN, #2,525 nationally) — a middle-class / working-renter tenant base. Strengths: amenities A+, commute A+, housing A+; Watch: cost of living C-, crime F.
- Minneapolis Public School District (urban): math 35% / reading 46% proficiency, ranked #217 of 301 in MN (top 72%) — families likely to look elsewhere, expect single-tenant / working-renter base with shorter leases.
- Market conditions: Rents rising (+1.0%/yr); 103 active listings in the ZIP; 40 comparable units currently listed for rent nearby; rentals leasing fast (median 8d on market — plan ~1-2 weeks tenant-placement turnaround); lower-income renter base — watch delinquency; 4,651 units permitted in Hennepin County in 2024 (2,443 in 5+ unit buildings).
- At $1,939/mo this rent would consume 55% of the median local household income ($42k/yr) (locally 2999% of renters already pay >50% of income on rent) — very limited rent-growth headroom before tenants either downsize or default.
Forward outlook
- Local home prices are declining (-3.0%/yr); year-one equity from $812 of loan paydown is wiped out by about $4k of value loss. Plan a longer hold.
- Hennepin County population projected at +30% by 2050 — long-run rental-demand tailwind backs the buy-and-hold thesis.
Negotiation context
- It's been on market 74 days — a 6% lower offer ($110k) is reasonable based on typical stale-listing flexibility.
- 3 sale attempts with the ask held roughly flat each time — persistent listings suggest the price (not the market) is what's stuck; bring a comps-based counter.
Risks & watch-outs
- Watch-outs: HOA is 25% of rent; built in 1904 — expect roof / HVAC / electrical / plumbing capex.
Questions for the listing agent
- It's been on market 74 days. Have you received any prior offers? Is the seller open to a 6% concession, seller financing, or rate buy-down credit?
- Built in 1904 — when were the roof, HVAC, electrical panel, plumbing, and water heater last replaced?
- What does the HOA fee cover, when was the last increase, and are there any pending special assessments or reserve-fund shortfalls?
- Any open or pending special assessments — roof, HVAC, plumbing, elevator, façade? What's the per-unit balance and payoff schedule, and is the seller paying it off at close or rolling it to the buyer?
- Why hasn't it sold? Are there any deal-killer items the seller is aware of (foundation, flood, title, zoning, code violations)?
- Is there a deadline driving the sale (1031 exchange, divorce, estate, relocation)? That informs how much negotiation room exists.
- Crime grade is F in this area — have there been break-ins, vandalism, or insurance claims at this property in the last 3 years? What carrier currently insures it and at what premium?
- What's the average days-on-market for RENTAL listings here right now (not sales)? A rising rental-DOM trend means longer vacancies and softer asking-rent achievability than the comps imply.
- What's the recent tenant-quality profile in this submarket — average credit score on applications, eviction rate, late-payment / NSF rate, and stable-employment percentage? A property-management company in the area should have these aggregated.
- How much new apartment / multifamily construction is in the pipeline within 1–3 miles? Heavy new supply (>2% of stock underway) typically softens rents 12–24 months out; light construction supports rent growth.
Investment metrics
- 1% rule
- 1.65% ✓
- Cap rate
- 8.79%
- Cash-on-cash
- 8.92%
- DSCR
- 1.40
- GRM
- 5.1
CMA / ARV
- ARV (median comp)
- $330,963
- List price
- $117,500
- Delta
- -64.50%
- Verdict
- UNDERPRICED
- Comps
- 8 within 1.0 mi
Projected returns pro-forma
-3.0% appreciation · 1.0% rent growth · sell at horizon
- IRR
- -5.9%
- Equity multiple
- 0.79×
- Total profit
- $-6,966
- Equity at exit
- $17,520
- IRR
- 0.1%
- Equity multiple
- 1.01×
- Total profit
- $220
- Equity at exit
- $10,159
Cash invested: $32,900 (down + closing). Projections, not guarantees.
Landlord ↔ Tenant lean methodology
- Overall (CITY)
- 34 Tenant-Leaning
- State Minnesota
- 46 Balanced · D+2
- County
- — inherits STATE
- City Minneapolis
- 34 Tenant-Leaning · D+50
ZIP-level market 55404
- Home prices YoY
- -33.3%
- Rents YoY
- 1.0%
- Active inventory
- 103
- Price-to-rent
- 5.1×
Monthly cashflow live
- Estimated rent
- $1,939 high interval (Pro) →
- Mortgage (P&I)
- −$616
- Tax est. 1.5%
- −$147 /mo · $1,762/yr
- Insurance
- −$49
- HOA
- −$475
- Vacancy / Maint / Mgmt
- −$407
- Net cashflow
- $245
Break-even live
Sensitivity live
| Price | -10% $326 | -5% $285 | +0% $245 | +5% $204 | +10% $163 |
|---|---|---|---|---|---|
| Rent | -10% $91 | -5% $168 | +0% $245 | +5% $321 | +10% $398 |
| Rate | -1.0pp $304 | -0.5pp $274 | base $245 | +0.5pp $214 | +1.0pp $183 |
UW: 25.0% down · 7.5% · 30yr · 1.5% tax · 5.0% vac · 8.0% maint · 8.0% mgmt
Financing live
Cash to close
- Down payment
- $29,375
- Closing costs
- $3,525
- Reserves months
- —
- Total cash needed
- —
Loan-product check · same deal, 3 products live
Conventional
25% down · 7.5% · 30yr
- Down + closing
- —
- Monthly P&I
- —
- Monthly cashflow
- —
- DSCR
- —
- Eligible?
- —
Personal DTI + credit; lowest rate.
DSCR
20% down · 8.5% · 30yr
- Down + closing
- —
- Monthly P&I
- —
- Monthly cashflow
- —
- DSCR
- —
- Eligible?
- —
No personal income docs; deal must DSCR.
Hard money
10% down · 12.0% · 12mo
- Down + closing
- —
- Monthly P&I
- —
- Monthly cashflow
- —
- DSCR
- —
- Eligible?
- —
Short-term bridge; refi at stabilization.
Rent comps 40 comps
| Address | Beds | Baths | Sqft | Rent | $/sqft | DOM | Units | Dist |
|---|---|---|---|---|---|---|---|---|
| 735 E 16th St #2 Minneapolis, MN | 3.0 | 1.0 | 1296 | $1,650 | $1.27 | 25d | 1 | 0.30mi |
| 1518 Park Ave Minneapolis, MN | 3.0 | 1.0 | 1200 | $1,850 | $1.54 | 11d | 1 | 0.31mi |
| 1518 Park Ave Minneapolis, MN | 3.0 | 1.0 | 1200 | $1,850 | $1.54 | 14d | 1 | 0.31mi |
| 918 E 17th St Unit 1 Minneapolis, MN | 3.0 | 1.0 | 1150 | $1,995 | $1.73 | 0d | 1 | 0.38mi |
| 1907 11th Ave S Unit 3 Minneapolis, MN | 2.0 | 1.0 | 1057 | $1,375 | $1.30 | 0d | 1 | 0.41mi |
| 1907 11th Ave S Unit 3 Minneapolis, MN | 2.0 | 1.0 | 1057 | $1,375 | $1.30 | 8d | 1 | 0.41mi |
| 2113 11th Ave S Minneapolis, MN | 3.0 | 1.0 | 900 | $2,100 | $2.33 | 18d | 1 | 0.41mi |
| 2121 11th Ave S Unit 2 Minneapolis, MN | 4.0 | 1.0 | 1800 | $2,450 | $1.36 | 4d | 1 | 0.42mi |
| 1400 Park Ave Minneapolis, MN | 2.0 | 1.0–2.0 | 875 | $2,630 | $3.01 | 0d | 23 | 0.42mi |
| 515 E Grant St Minneapolis, MN | 1.0–2.0 | 1.0 | 820 | $1,696 | $2.07 | 2d | 10 | 0.47mi |
| 128 E 18th St Apt 202 Minneapolis, MN | 2.0 | 2.0 | 1000 | $1,500 | $1.50 | 44d | 1 | 0.47mi |
| 128 E 18th St Unit 5 134 2 Minneapolis, MN | 2.0 | 2.0 | 1000 | $1,420 | $1.42 | 44d | 1 | 0.47mi |
| 2121 13th Ave S Unit 4 Minneapolis, MN | 4.0 | 1.5 | 1100 | $1,825 | $1.66 | 44d | 1 | 0.52mi |
| 929 Portland Ave Minneapolis, MN | 2.0 | 2.0 | 1120 | $2,499 | $2.23 | 44d | 1 | 0.53mi |
| 1423 11th Ave S Minneapolis, MN | 1.0–2.0 | 1.0 | 818 | $1,800 | $2.20 | 0d | 27 | 0.54mi |
| 10 E 18th St Unit E626 Minneapolis, MN | 3.0 | 2.0 | 995 | $2,389 | $2.40 | 8d | 1 | 0.59mi |
| 10 E 18th St Unit E408 Minneapolis, MN | 2.0 | 2.0 | 875 | $1,969 | $2.25 | 8d | 1 | 0.59mi |
| 1111 3rd Ave S Unit 1511914P Minneapolis, MN | 4.0 | 1.0–2.0 | 1081 | $9,693 | $8.97 | 3d | 2 | 0.59mi |
| 1819 15th Ave S Minneapolis, MN | 3.0 | 1.5 | 1700 | $2,050 | $1.21 | 14d | 1 | 0.61mi |
| 1702 Nicollet Ave Minneapolis, MN | 3.0 | 1.0–2.0 | 685 | $2,276 | $3.32 | 25d | 23 | 0.63mi |
| 615 S 8th St Minneapolis, MN | 2.0 | 1.0–2.5 | 1252 | $6,125 | $4.89 | 0d | 49 | 0.65mi |
| 2625 3rd Ave S Unit 3 Minneapolis, MN | 2.0 | 1.0 | 1000 | $1,399 | $1.40 | 4d | 1 | 0.66mi |
| 739 E 27th St Unit 739 Minneapolis, MN | 4.0 | 1.0 | 1699 | $2,600 | $1.53 | 25d | 1 | 0.67mi |
| 2704 Chicago Ave Unit 1 Minneapolis, MN | 2.0 | 1.0 | 980 | $1,400 | $1.43 | 25d | 1 | 0.67mi |
| 1818 La Salle Ave Unit 7 Minneapolis, MN | 2.0 | 1.0 | 1000 | $1,375 | $1.38 | 44d | 1 | 0.69mi |
| 2625 2nd Ave S Unit 1 Minneapolis, MN | 2.0 | 1.0 | 1000 | $2,000 | $2.00 | 25d | 1 | 0.70mi |
| 1410 Nicollet Ave Minneapolis, MN | 2.0 | 1.0–2.0 | 797 | $2,280 | $2.86 | 0d | 24 | 0.70mi |
| 2108 16th Ave S Unit 1 Minneapolis, MN | 3.0 | 1.0 | 1020 | $1,750 | $1.72 | 44d | 1 | 0.72mi |
| 1010 S 7th St Minneapolis, MN | 2.0 | 1.0–2.0 | 834 | $2,725 | $3.27 | 44d | 1 | 0.73mi |
| 1117 Marquette Ave Minneapolis, MN | 1.0–2.0 | 1.0–2.0 | 953 | $1,869 | $1.96 | 0d | 16 | 0.73mi |
| 2730 Portland Ave Minneapolis, MN | 1.0–3.0 | 1.0–2.0 | 940 | $1,755 | $1.87 | 8d | 3 | 0.73mi |
| 433 S 7th St Minneapolis, MN | 2.0 | 2.0 | 1057 | $2,548 | $2.41 | 15d | 1 | 0.75mi |
| 650 Portland Ave Minneapolis, MN | 2.0 | 1.0–2.0 | 1104 | $4,141 | $3.75 | 0d | 16 | 0.76mi |
| 95 S 10th St Minneapolis, MN | 2.0 | 1.0–2.0 | 688 | $2,321 | $3.37 | 2d | 31 | 0.81mi |
| 1369 Spruce Pl Minneapolis, MN | 1.0–3.0 | 1.0–2.5 | 1396 | $6,750 | $4.83 | 0d | 25 | 0.81mi |
| 600 5th Ave S Minneapolis, MN | 1.0–2.0 | 1.0–2.0 | 878 | $3,315 | $3.78 | 0d | 12 | 0.83mi |
| 1225 Lasalle Ave #602 Minneapolis, MN | 2.0 | 2.0 | 1118 | $2,300 | $2.06 | 44d | 1 | 0.83mi |
| 90 S 9th St Minneapolis, MN | 2.0 | 1.0 | 823 | $2,000 | $2.43 | 0d | 4 | 0.87mi |
| 1367 Willow St Minneapolis, MN | 2.0 | 1.0–2.0 | 806 | $2,330 | $2.89 | 0d | 14 | 0.87mi |
| 2105 Grand Ave S Unit Grand 2 Minneapolis, MN | 2.0 | 1.0 | 950 | $1,700 | $1.79 | 44d | 1 | 0.88mi |
HOA detail condo
- Monthly dues
- $475 · $5,700/yr
- Assessments
- None detected in remarks — confirm with the listing agent.
Listing history 5 events
-
2026-02-21$117,500 Active
-
2026-02-05historical
-
2025-06-18$127,500 Active
-
2025-06-17historical
-
2025-03-13$127,500 Active
ⓘ Source: listings_history table (triggers on properties + properties_extension) + one-shot
backfill from property_details.listing_events for pre-trigger history.
Climate risk First Street
- Flood 1/10 Low FEMA zone X (unshaded) · 0% chance over 30 yrs
- Wildfire 1/10 Low
- Heat 2/10 Low 7 d/yr ≥99°F today · 14 d/yr by 30 yrs out
- Wind 2/10 Low
- Air quality 2/10 Low 1 unhealthy d/yr today · 1 by 30 yrs out
Nearby sold comps map
Loading sold comps map…
Walkable amenities ~0.75 mi
Loading nearby amenities…
Taxation est. · year 1
- Rental income
- $23,265
- − Mortgage interest
- −$6,582
- − Property taxes
- −$1,762
- − Insurance
- −$588
- − Repairs & maintenance
- −$1,861
- − Management
- −$1,861
- − HOA
- −$5,700
- − Depreciation
- −$3,418
- Taxable income
- $1,493
- Est. tax owed @ 24.0%
- −$358
- After-tax cash flow
- $2,577/yr
For passive investors: Depreciation is non-cash, so a rental often shows a tax loss while cash-flowing — sheltering income. Rental losses are passive: they offset passive income freely, and up to $25,000/yr can offset ordinary (W-2) income if you actively participate and your MAGI is under $100k (phasing out to $0 by $150k); unused losses carry forward. On sale, claimed depreciation is recaptured at up to 25%, and gains may owe capital-gains tax (a 1031 exchange can defer both). Figures are a year-1 estimate at your 24.0% rate — not tax advice; consult a CPA.
Schools (NCES district)
- District
- Minneapolis Public School District
- NCES district ID
- 2721240
- Math proficiency
- 35% ▼ -7.00%
- Reading proficiency
- 46% ▼ -1.00%
- Median HH income
- $50,521
- Composite
- 34.92/100
- National rank
- #5067
- State rank
- #217 of 301 in MN
Livability — Minneapolis
- Score
- 78/100
- State rank
- #110
- US rank
- #2525
Category grades
Schools grade is shown separately in the Schools card above.
Census & demographics
- Census place
- Minneapolis, MN
- County
- Hennepin County · 1,150,272 people
- City population
- 417,555
- Metro
- Minneapolis-St. Paul-Bloomington, MN-WI
- Population (ZIP)
- 28,920
- Household income
- $41,940
- Rent vs Own
- Severe rent burden
- 2999.0
Population outlook (Hennepin County) Hauer SSP2
- Today (2025)
- 1,405,227 people
- By 2030
- 1,492,650 · +6.2%
- By 2040
- 1,660,157 · +18.1%
- By 2050
- 1,823,498 · +29.8%
- By 2075
- 2,221,283 · +58.1%
- By 2100
- 2,509,976 · +78.6%
Race, ethnicity, and origin ACS 2023
- Neighborhood character
- Highly diverse neighborhood (Simpson 0.72)
- Race & ethnicity
- White 36% Black 32% Hispanic / Latino 20% Two or more races 10% Native American 5% Asian 4%
- Hispanic origin (detail)
- Mexican 8%
- Common ancestry
- Portuguese 5% Romanian 3% Lithuanian 3%
- Foreign-born
- 24% · Canada, China, United Kingdom
- Languages at home
- 63% English-only · Spanish 13% Other Asian/Pacific 2% French/Haitian/Cajun 1%
Political lean MEDSL · Hennepin
- 2024 margin
- Solid D (+42.6) · D 70.2% · R 27.5% · Other 2.3%
- 2008→2024 swing
- +14.0pp toward D · 2008: 28.6pp · 2024: 42.6pp
- All cycles
- 2024: D+42.6 2020: D+43.2 2016: D+35.3 2012: D+27.1 2008: D+28.6
Not yet ingested
- Civics
- —
Market trends
- HPI YoY
- ▼ -112.31%
- Current HPI
- 224.8886
- Rent YoY
- ▲ 1.00%
- Metro
- Minneapolis-St. Paul-Bloomington, MN-WI
- State GDP YoY
- ▲ 2.41%
- F500 in state
- 34
Industry mix (Fortune 500 HQ in MN)
| Industry | F500 HQs | Revenue |
|---|---|---|
| Healthcare | 2 | $407B |
|
||
| Retail | 2 | $150B |
|
||
| Consumer Goods | 2 | $32B |
|
||
| Industrial Machinery | 2 | $6B |
|
||
| Agriculture | 1 | $40B |
|
||
| Healthcare / Medical Devices | 1 | $32B |
|
||
Price history
-7.8% since first listed5 events — show timeline
- 2026-02-21 Listed $117,500 NORTHSTARMLS as Distributed by MLS Grid
- 2026-02-05 Listing Removed — NORTHSTARMLS as Distributed by MLS Grid
- 2025-06-18 Listed $127,500 NORTHSTARMLS as Distributed by MLS Grid
- 2025-06-17 Listing Removed — NORTHSTARMLS as Distributed by MLS Grid
- 2025-03-13 Listed $127,500 NORTHSTARMLS as Distributed by MLS Grid
Cash-flow waterfall
monthlySold comps — $/sqft
last 12 mo · ≤1 miLoading sold comps…