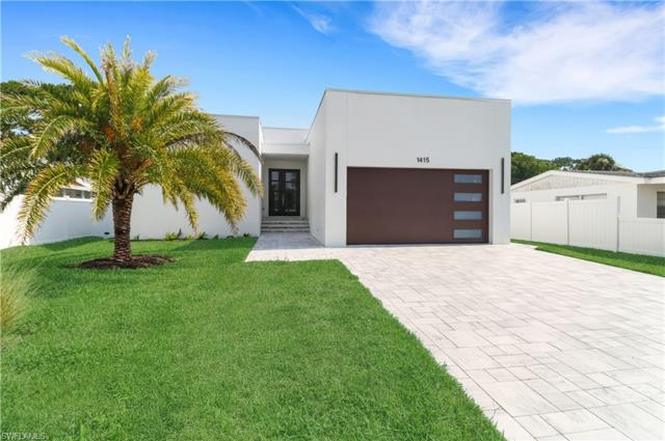
1415 13th Ave N · Naples, FL
Flood risk 9/10 · Severe
- FEMA flood zone
- AE
- Chance of flooding over 30 yrs
- 0.99%
- Est. flood insurance / yr
- $1,737 – $8,500
Fire risk 1/10 · Minimal
- Est. fire insurance / yr
- $947 – $1,759
Heat risk 10/10 · Severe
- Hot days now (above 107°F)
- 7 days/yr
- Hot days in 30 yrs
- 28 days/yr
Wind risk 10/10 · Severe
- Chance of severe wind over 30 yrs
- 99.0%
Air-quality risk 2/10 · Minimal
- Unhealthy air days now
- 2 days/yr
- Unhealthy air days in 30 yrs
- 2 days/yr
Risk factors via First Street. Map © Google.
Why this score? — see what drove the D grade
The composite is a weighted blend of 9 inputs, each scored 0–100. Each bar is that input's sub-score; the figure is the points it added to the 100-point composite (weight × sub-score).
- ARV discount +7.5/15.0
- Cash flow +7.4/30.0
- Appreciation +7.0/10.0
- Schools +5.0/10.0
- Rent growth +4.7/5.0
- Livability +4.0/5.0
- Condition / age +2.5/5.0
- 1% rule +1.8/10.0
- DSCR +1.6/10.0
$998,800
🖨 Deal sheet (PDF) 📄 Offer letter ✓ Due diligence
Listing remarks
Effortless Luxury Meets Smart Design: This newly built Foundry model by New Era Construction isn’t just a home, it’s a lifestyle, thoughtfully designed for elegant ease. The perfect blend of modern architecture with an inviting livable flow. Beyond the soaring ceilings and large format porcelain tile, what truly sets this home apart is its seamless indoor outdoor living. A rare offset pool and lanai design creates multiple zones for morning stillness or evening connection. The chef’s kitchen complete with custom cabinetry and a generous prep island anchors the home with both form and function, while the spa-like primary suite offers a private daily retreat. Built with
Key facts
- Custom cabinetry
- Fenced yard
- Chef's kitchen
Tags
Property features AI
Finance
- Other: Lot is approximately 0.20 acres with landscaped views; City-maintained paved road access
- HOA & community: No HOA maintenance; Community amenities include streetlights and underground utilities; Non-gated community
Exterior
- Parking: Attached 2-car garage; Driveway with paved parking for 2+ vehicles
- Security: Security system; Alarm (unmonitored)
- Utilities: Central water; Central sewer; Cable available
- Home design: Single-family residence; 1-story / ranch; Rear exposure faces north; Residential property in Gordon River Homes
- Construction: Built in 2024; Concrete block construction; Stucco exterior; Built-up or flat roof; Impact-resistant doors and windows
- Exterior features: Deck; Fence (completely fenced); Outdoor kitchen; Screened lanai/porch; Private screened below-ground pool (equipment stays)
Interior
- Kitchen: Island; Cooktop (electric); Self-cleaning oven; Dishwasher; Disposal; Microwave; Refrigerator/freezer; Breakfast bar / dining in living area
- Bedrooms: 3 bedrooms; Primary bedroom on the first floor
- Flooring: Tile
- Bathrooms: 2 full bathrooms; Master bath with dual sinks and separate tub and shower
- Heating & cooling: Central electric heat; Central electric air conditioning; Ceiling fans; Exhaust fan
- Interior features: Bar; Built-in cabinets; Foyer; High-speed internet available; Laundry tub; Smoke detectors; Volume ceiling; Walk-in closet; Great room floor plan; 7 total rooms
- Laundry & utility: Washer and dryer included; Laundry in residence; Tankless water heater; Auto garage door
Neighborhood map
What this means for you Summary
Snapshot
- This is a 3-bed/2.0-bath single-family listed at $999k.
Deal economics
- At list price, monthly cash flow is $-2k ($-20k/yr) — negative.
- To cash-flow at today's rent, offer at most $699k (30.1% below list).
- To meet the 1% rule (rent ≥ 1% of price), the offer needs to be $675k (32.4% below list).
- Recommended offer: $675k (32.4% below list) — sets the bar for 1% rule.
Location & tenants
- Location reads 80/100 on livability (#126 in FL, #1,903 nationally) — a professional / high-income tenant draw. Strengths: crime A+, amenities A+, employment A+; Watch: commute D+, cost of living F.
- Collier (suburban): math 60% / reading 56% proficiency, ranked #16 of 73 in FL (top 22%) — acceptable for families but not a draw, mixed tenant base, ~2y average lease.
- Zoned schools: Lake Park Elementary School (math 76% / reading 77%, grade A, #185 of 2,144 statewide, top 9%, 502 students, 39% FRL); Gulfview Middle School (math 78% / reading 68%, grade A, #44 of 571 statewide, top 8%, 582 students, 40% FRL); Naples High School (math 47% / reading 52%, grade D, #179 of 667 statewide, top 29%, 1,719 students, 39% FRL) — zoned schools average 39% FRL vs 55% district-wide (16 pts lower); this property's tenant base skews higher-income than the district average.
- Market conditions: Rents rising fast (+8.8%/yr); 616 active listings in the ZIP; 40 comparable units currently listed for rent nearby; rentals at typical pace (median 25d on market — plan ~3-4 weeks tenant-placement turnaround); high-income renter base; 3,520 units permitted in Collier County in 2024 (959 in 5+ unit buildings).
- At $6,753/mo this rent would consume 62% of the median local household income ($131k/yr) (locally 333% of renters already pay >50% of income on rent) — very limited rent-growth headroom before tenants either downsize or default.
Forward outlook
- In year one you build about $48k of equity ($7k loan paydown + $41k appreciation (4.1% local appreciation)).
- Collier County population projected at +30% by 2050 — long-run rental-demand tailwind backs the buy-and-hold thesis.
- By year 2, paydown + projected appreciation supports a ~$77k cash-out refi (75% LTV) — recoverable capital for the next deal without selling this one.
Negotiation context
- It's been on market 324 days — a 12% lower offer ($879k) is reasonable based on typical stale-listing flexibility.
- 4 sale attempts since 2y ago; this cycle's ask has dropped $344k (26%) from the opening price — seller is motivated, your offer sets the floor, not the list.
- Current owner paid $63k; list at $999k implies a 1485% gain — meaningful room to come down on a strong offer.
Risks & watch-outs
- Watch-outs: flood insurance adds $427/mo.
- Climate carrying-cost: in FEMA flood zone AE (mandatory federal flood insurance); severe wind risk, 99% chance of damaging wind over 30y; extreme-heat days projected 7→28/yr by 2055 (HVAC capex compounding) — expect insurance premiums to compound above CPI over the hold.
Questions for the listing agent
- What do current leases actually rent for vs. the listed asking? Can we see a recent rent roll and the last 12 months of T-12 income?
- It's been on market 324 days. Have you received any prior offers? Is the seller open to a 32% concession, seller financing, or rate buy-down credit?
- What's the actual annual flood-insurance premium (NFIP or private), and is the property in a SFHA with mandatory coverage?
- Why hasn't it sold? Are there any deal-killer items the seller is aware of (foundation, flood, title, zoning, code violations)?
- Is there a deadline driving the sale (1031 exchange, divorce, estate, relocation)? That informs how much negotiation room exists.
- Schools are B-rated — typically a magnet for longer-tenancy family renters. What's the average tenant stay here, and is there a school-zone premium baked into asking?
- The area grade is low — what's the realistic commute time and amenity access for the typical tenant pool here? Any planned neighborhood developments (good or bad) we should know about?
- What's the average days-on-market for RENTAL listings here right now (not sales)? A rising rental-DOM trend means longer vacancies and softer asking-rent achievability than the comps imply.
- What's the recent tenant-quality profile in this submarket — average credit score on applications, eviction rate, late-payment / NSF rate, and stable-employment percentage? A property-management company in the area should have these aggregated.
- How much new for-sale + rental construction is in the pipeline within 1–3 miles? Heavy new supply typically softens prices + rents 12–24 months out; constrained supply supports both.
Investment metrics
- 1% rule
- 0.68% ✗
- Cap rate
- 4.76%
- Cash-on-cash
- -5.46%
- DSCR
- 0.76
- GRM
- 12.3
CMA / ARV
No comps found within radius.
Projected returns pro-forma
4.08% appreciation · 8.0% rent growth · sell at horizon
- IRR
- 6.1%
- Equity multiple
- 1.38×
- Total profit
- $106,401
- Equity at exit
- $511,288
- IRR
- 10.5%
- Equity multiple
- 2.89×
- Total profit
- $528,426
- Equity at exit
- $840,171
Cash invested: $279,664 (down + closing). Projections, not guarantees.
Landlord ↔ Tenant lean methodology
- Overall (STATE)
- 87 Strongly Landlord-Friendly
- State Florida
- 87 Strongly Landlord-Friendly · R+3
- County
- — inherits STATE
- City
- — inherits STATE
ZIP-level market 34102
- Home prices YoY
- 1.3%
- Rents YoY
- 8.8%
- Active inventory
- 616
- Price-to-rent
- 12.3×
Monthly cashflow live
- Estimated rent
- $6,753 medium interval (Pro) →
- Mortgage (P&I)
- −$5,238
- Tax from tax record
- −$954 /mo · $11,448/yr
- Insurance
- −$416
- Flood insurance flood zone
- −$427 /mo · $5,118/yr
- HOA
- −$0
- Vacancy / Maint / Mgmt
- −$1,418
- Net cashflow
- $-1,700
Break-even live
Sensitivity live
| Price | -10% $-1,134 | -5% $-1,417 | +0% $-1,700 | +5% $-1,982 | +10% $-2,265 |
|---|---|---|---|---|---|
| Rent | -10% $-2,233 | -5% $-1,966 | +0% $-1,700 | +5% $-1,433 | +10% $-1,166 |
| Rate | -1.0pp $-1,197 | -0.5pp $-1,445 | base $-1,700 | +0.5pp $-1,958 | +1.0pp $-2,222 |
UW: 25.0% down · 7.5% · 30yr · 1.5% tax · 5.0% vac · 8.0% maint · 8.0% mgmt
Financing live
Cash to close
- Down payment
- $249,700
- Closing costs
- $29,964
- Reserves months
- —
- Total cash needed
- —
Loan-product check · same deal, 3 products live
Conventional
25% down · 7.5% · 30yr
- Down + closing
- —
- Monthly P&I
- —
- Monthly cashflow
- —
- DSCR
- —
- Eligible?
- —
Personal DTI + credit; lowest rate.
DSCR
20% down · 8.5% · 30yr
- Down + closing
- —
- Monthly P&I
- —
- Monthly cashflow
- —
- DSCR
- —
- Eligible?
- —
No personal income docs; deal must DSCR.
Hard money
10% down · 12.0% · 12mo
- Down + closing
- —
- Monthly P&I
- —
- Monthly cashflow
- —
- DSCR
- —
- Eligible?
- —
Short-term bridge; refi at stabilization.
Rent comps 40 comps
| Address | Beds | Baths | Sqft | Rent | $/sqft | DOM | Units | Dist |
|---|---|---|---|---|---|---|---|---|
| 1236 13th Ave N Naples, FL | 3.0 | 2.0 | 1461 | $14,500 | $9.92 | 25d | 1 | 0.21mi |
| 905 13th St N Naples, FL | 3.0 | 2.0 | 1292 | $8,000 | $6.19 | 25d | 1 | 0.28mi |
| 1199 9th Ave N Naples, FL | 3.0 | 2.0 | 2000 | $25,000 | $12.50 | 25d | 1 | 0.35mi |
| 1281 10th St N Naples, FL | 4.0 | 2.0 | 1580 | $7,000 | $4.43 | 25d | 1 | 0.44mi |
| 1530 Mandarin Rd Naples, FL | 3.0 | 3.0 | 1635 | $25,000 | $15.29 | 25d | 1 | 0.59mi |
| 202 Bears Paw Trl #97 Naples, FL | 2.0 | 2.0 | 1665 | $10,000 | $6.01 | 25d | 1 | 0.61mi |
| 1471 Mandarin Rd Naples, FL | 3.0 | 2.0 | 1788 | $6,500 | $3.64 | 23d | 1 | 0.64mi |
| 514 14th St N Naples, FL | 3.0 | 2.0 | 1779 | $5,200 | $2.92 | 25d | 1 | 0.68mi |
| 739 7th Ave N Naples, FL | 3.0 | 3.0 | 2253 | $20,000 | $8.88 | 25d | 1 | 0.77mi |
| 732 7th Ave N Naples, FL | 3.0 | 2.0 | 1829 | $7,295 | $3.99 | 23d | 1 | 0.79mi |
| 2261 11th St N Naples, FL | 4.0 | 2.0 | 1428 | $6,400 | $4.48 | 25d | 1 | 0.85mi |
| 2400 14th St N Naples, FL | 3.0 | 2.0 | 1464 | $5,890 | $4.02 | 15d | 1 | 0.85mi |
| 2328 Clipper Way Naples, FL | 2.0 | 2.0 | 1469 | $10,000 | $6.81 | 25d | 1 | 0.88mi |
| 549 7th Ave N Naples, FL | 3.0 | 2.0 | 2027 | $19,000 | $9.37 | 25d | 1 | 0.92mi |
| 605 6th Ave N Naples, FL | 3.0 | 2.5 | 2300 | $23,600 | $10.26 | 25d | 1 | 0.95mi |
| 2515 Royal Palm Ct Naples, FL | 3.0 | 2.0 | 1875 | $17,500 | $9.33 | 25d | 1 | 0.98mi |
| 1125 Central Ave Naples, FL | 2.0 | 2.5 | 1996 | $16,000 | $8.02 | 15d | 3 | 1.03mi |
| 1125 Central Ave #462 Naples, FL | 2.0 | 2.0 | 1858 | $15,000 | $8.07 | 15d | 1 | 1.03mi |
| 1131 Crayton Rd Naples, FL | 3.0 | 2.5 | 2250 | $12,000 | $5.33 | 25d | 1 | 1.09mi |
| 1111 Central Ave #303 Naples, FL | 2.0 | 2.0 | 1561 | $16,000 | $10.25 | 25d | 1 | 1.09mi |
| 1111 Central Ave Unit 417A Naples, FL | 2.0 | 2.0 | 1265 | $6,500 | $5.14 | 25d | 1 | 1.09mi |
| 1111 Central Ave Unit 417S Naples, FL | 2.0 | 2.0 | 1265 | $10,000 | $7.91 | 25d | 1 | 1.09mi |
| 1115 Central Ave Naples, FL | 2.0 | 2.5 | 1735 | $14,000 | $8.07 | 25d | 3 | 1.13mi |
| 1111 Central Ave Naples, FL | 2.0–3.0 | 2.0–3.5 | 1627 | $17,000 | $10.45 | 25d | 4 | 1.13mi |
| 2548 River Reach Dr Unit 1073502P Naples, FL | 3.0 | 2.0 | 1550 | $5,795 | $3.74 | 15d | 1 | 1.15mi |
| 1200 Gulf Shore Blvd N #404 Naples, FL | 2.0 | 2.5 | 1810 | $9,000 | $4.97 | 25d | 1 | 1.17mi |
| 295 6th St N Naples, FL | 3.0 | 3.0 | 1868 | $30,000 | $16.06 | 25d | 1 | 1.17mi |
| 1400 Gulf Shore Blvd N #310 Naples, FL | 3.0 | 3.5 | 2472 | $16,000 | $6.47 | 25d | 1 | 1.18mi |
| 1111 Wildwood Ln #1111 Naples, FL | 3.0 | 2.0 | 2060 | $10,000 | $4.85 | 25d | 1 | 1.20mi |
| 606 Wedge Dr Unit 1504171P Naples, FL | 3.0 | 2.0 | 1959 | $21,578 | $11.01 | 25d | 1 | 1.21mi |
| 469 3rd Ave N Naples, FL | 3.0 | 2.0 | 1400 | $6,900 | $4.93 | 25d | 1 | 1.21mi |
| 850 Central Ave Naples, FL | 2.0–3.0 | 2.0–3.0 | 1530 | $18,000 | $11.76 | 15d | 4 | 1.23mi |
| 1065 Gulf Shore Blvd N #201 Naples, FL | 3.0 | 2.5 | 2030 | $20,000 | $9.85 | 25d | 1 | 1.25mi |
| 2680 Longboat Dr Naples, FL | 3.0 | 2.0 | 1528 | $11,000 | $7.20 | 25d | 1 | 1.28mi |
| 367 Mooring Line Dr Naples, FL | 4.0 | 3.0 | 2413 | $32,000 | $13.26 | 23d | 1 | 1.28mi |
| 1930 Gulf Shore Blvd N Unit A302S Naples, FL | 2.0 | 2.0 | 1420 | $6,995 | $4.93 | 25d | 1 | 1.30mi |
| 522 Wildwood Ln #522 Naples, FL | 2.0 | 2.0 | 1656 | $8,000 | $4.83 | 25d | 1 | 1.30mi |
| 1910 Gulf Shore Blvd N Naples, FL | 2.0 | 2.0 | 1290 | $9,200 | $7.13 | 25d | 2 | 1.31mi |
| 1135 3rd Ave S Naples, FL | 2.0 | 2.0–2.5 | 1679 | $11,500 | $6.85 | 23d | 3 | 1.32mi |
| 1135 3rd Ave S Naples, FL | 2.0 | 2.0–2.5 | 1638 | $15,750 | $9.62 | 25d | 2 | 1.32mi |
Listing history 27 events
-
2026-06-22days on market $998,800 Active 324 DOM
-
2026-06-18days on market $998,800 Active 321 DOM
-
2026-06-17days on market $998,800 Active 320 DOM
-
2026-06-16days on market $998,800 Active 319 DOM
-
2026-06-15days on market $998,800 Active 318 DOM
-
2026-06-10days on market $998,800 Active 313 DOM
-
2026-06-09days on market $998,800 Active 312 DOM
-
2026-06-08days on market $998,800 Active 311 DOM
-
2026-06-07days on market $998,800 Active 310 DOM
-
2026-06-02days on market $998,800 Active 305 DOM
-
2026-06-01days on market $998,800 Active 304 DOM
-
2026-05-31days on market $998,800 Active 303 DOM
-
2026-05-30days on market $998,800 Active 302 DOM
-
2026-02-26status Active
-
2026-02-23status Pending With Contingencies
-
2026-02-05status Active
-
2026-02-01historical
-
2025-12-05price $998,800
-
2025-11-13price $1,079,999
-
2025-10-01price $1,268,800
-
2025-07-25$1,342,880 Active
-
2025-05-29historical
-
2025-04-11price $1,349,500
-
2025-01-24price $1,499,000
-
2025-01-06price $1,595,000
-
2024-09-08$1,695,000 Active
-
1996-03-11soldstatus $63,000
ⓘ Source: listings_history table (triggers on properties + properties_extension) + one-shot
backfill from property_details.listing_events for pre-trigger history.
Tax reassessment forecast FL · Resets to sale price
- Current annual tax
- $11,448 · $954/mo
- Projected year-2 tax
- $11,448 · $954/mo
- Expected delta
- $0/yr ($0/mo · 0.0%)
ⓘ Screening estimate from a state-policy table — verify with the county assessor before closing.
Climate risk First Street
- Flood 9/10 Extreme FEMA zone AE · 99% chance over 30 yrs
- Wildfire 1/10 Low
- Heat 10/10 Extreme 7 d/yr ≥107°F today · 28 d/yr by 30 yrs out
- Wind 10/10 Extreme 99% chance of damaging wind over 30 yrs
- Air quality 2/10 Low 2 unhealthy d/yr today · 2 by 30 yrs out
Nearby sold comps map
Loading sold comps map…
Walkable amenities ~0.75 mi
Loading nearby amenities…
Taxation est. · year 1
- Rental income
- $81,038
- − Mortgage interest
- −$55,948
- − Property taxes
- −$11,448
- − Insurance
- −$10,112
- − Repairs & maintenance
- −$6,483
- − Management
- −$6,483
- − Depreciation
- −$29,056
- Taxable loss
- −$38,493
- Est. tax savings @ 24.0%
- +$9,238
- After-tax cash flow
- $-11,156/yr
For passive investors: Depreciation is non-cash, so a rental often shows a tax loss while cash-flowing — sheltering income. Rental losses are passive: they offset passive income freely, and up to $25,000/yr can offset ordinary (W-2) income if you actively participate and your MAGI is under $100k (phasing out to $0 by $150k); unused losses carry forward. On sale, claimed depreciation is recaptured at up to 25%, and gains may owe capital-gains tax (a 1031 exchange can defer both). Figures are a year-1 estimate at your 24.0% rate — not tax advice; consult a CPA.
Schools (NCES district)
- District
- Collier
- NCES district ID
- 1200330
- Math proficiency
- 60% ▼ -4.00%
- Reading proficiency
- 56% ▼ -2.00%
- Median HH income
- $58,275
- Composite
- 50.23/100
- National rank
- #1892
- State rank
- #16 of 73 in FL
Livability — Naples
- Score
- 80/100
- State rank
- #126
- US rank
- #1903
Category grades
Schools grade is shown separately in the Schools card above.
Census & demographics
- County
- Collier County · 396,295 people
- City population
- 344,941
- Metro
- Naples-Marco Island, FL
- Population (ZIP)
- 11,179
- Household income
- $130,929
- Rent vs Own
- Severe rent burden
- 333.0
Population outlook (Collier County) Hauer SSP2
- Today (2025)
- 420,858 people
- By 2030
- 450,054 · +6.9%
- By 2040
- 502,232 · +19.3%
- By 2050
- 544,932 · +29.5%
- By 2075
- 627,203 · +49.0%
- By 2100
- 659,015 · +56.6%
Race, ethnicity, and origin ACS 2023
- Neighborhood character
- Predominantly White (79%)
- Race & ethnicity
- White 79% Hispanic / Latino 9% Two or more races 8% Black 8% Asian 1%
- Hispanic origin (detail)
- Cuban 6%
- Common ancestry
- Hispanic 4% Lithuanian 4% Romanian 4%
- Foreign-born
- 17% · Canada, China
- Languages at home
- 87% English-only · Spanish 7% French/Haitian/Cajun 4% German/W. Germanic 1%
Political lean MEDSL · Collier
- 2024 margin
- Solid R (+33.1) · D 33.1% · R 66.2%
- 2008→2024 swing
- -10.6pp toward R · 2008: -22.5pp · 2024: -33.1pp
- All cycles
- 2024: R+33.1 2020: R+24.7 2016: R+26.0 2012: R+30.1 2008: R+22.5
Not yet ingested
- Civics
- —
Market trends
- HPI YoY
- ▲ 4.08%
- Current HPI
- 328.2755
- Rent YoY
- ▲ 8.75%
- Metro
- Naples-Marco Island, FL
- State GDP YoY
- ▲ 3.28%
- F500 in state
- 36
Industry mix (Fortune 500 HQ in FL)
| Industry | F500 HQs | Revenue |
|---|---|---|
| Industrial Technology | 2 | $29B |
|
||
| Insurance | 2 | $17B |
|
||
| Retail | 1 | $60B |
|
||
| Technology Distribution | 1 | $58B |
|
||
| Homebuilding | 1 | $35B |
|
||
| Technology Manufacturing | 1 | $35B |
|
||
Price history
+1485.4% since first listed14 events — show timeline
- 2026-02-26 Relisted — NAPLESMLS
- 2026-02-23 Pending — NAPLESMLS
- 2026-02-05 Relisted — NAPLESMLS
- 2026-02-01 Listing Removed — NAPLESMLS
- 2025-12-05 Price Changed $998,800 NAPLESMLS
- 2025-11-13 Price Changed $1,079,999 NAPLESMLS
- 2025-10-01 Price Changed $1,268,800 NAPLESMLS
- 2025-07-25 Listed $1,342,880 NAPLESMLS
- 2025-05-29 Listing Removed — NAPLESMLS
- 2025-04-11 Price Changed $1,349,500 NAPLESMLS
- 2025-01-24 Price Changed $1,499,000 NAPLESMLS
- 2025-01-06 Price Changed $1,595,000 NAPLESMLS
- 2024-09-08 Listed $1,695,000 NAPLESMLS
- 1996-03-11 Sold (Public Records) $63,000 Public Records
Property tax history
+19.4%/yrLatest (2025): $11,448 · +208.9% YoY. Source: county tax records.
Cash-flow waterfall
monthlySold comps — $/sqft
last 12 mo · ≤1 miLoading sold comps…