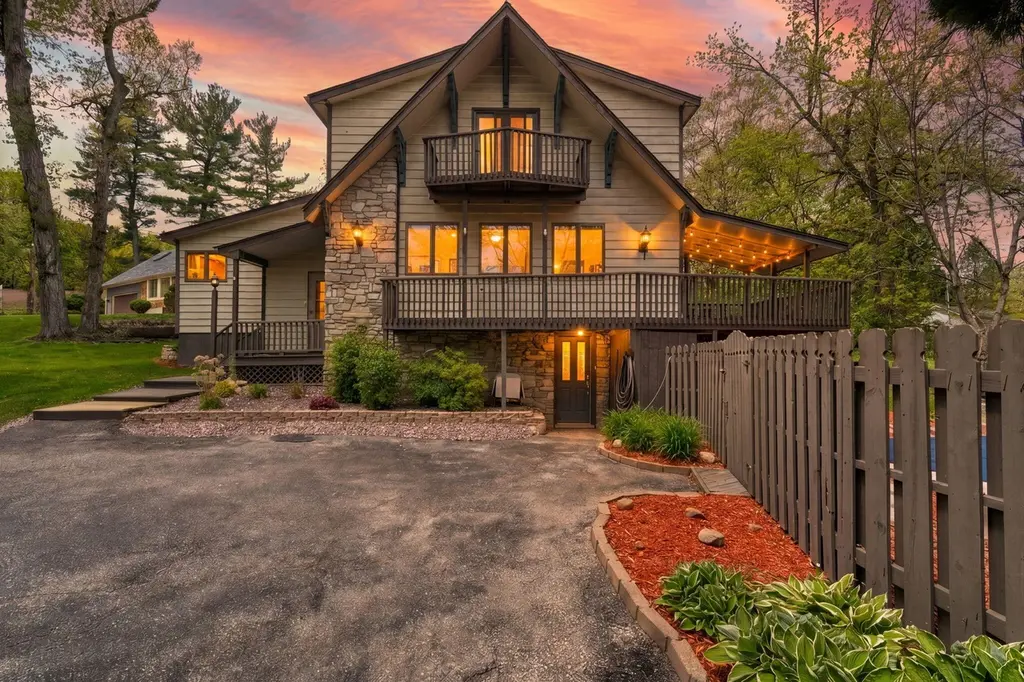
7411 Iddings Ct · Merrillville, IN
Flood risk 4/10 · Minor
- FEMA flood zone
- X (unshaded)
- Chance of flooding over 30 yrs
- 0.21%
- Est. flood insurance / yr
- $473 – $860
Fire risk 1/10 · Minimal
- Est. fire insurance / yr
- $717 – $1,331
Heat risk 2/10 · Minimal
- Hot days now (above 101°F)
- 7 days/yr
- Hot days in 30 yrs
- 15 days/yr
Wind risk 2/10 · Minimal
- Chance of severe wind over 30 yrs
- 0.0%
Air-quality risk 3/10 · Minor
- Unhealthy air days now
- 2 days/yr
- Unhealthy air days in 30 yrs
- 3 days/yr
Risk factors via First Street. Map © Google.
Why this score? — see what drove the F grade
The composite is a weighted blend of 9 inputs, each scored 0–100. Each bar is that input's sub-score; the figure is the points it added to the 100-point composite (weight × sub-score).
- Cash flow +11.2/30.0
- Livability +3.8/5.0
- Rent growth +3.5/5.0
- DSCR +3.3/10.0
- Schools +2.6/10.0
- 1% rule +2.5/10.0
- Condition / age +2.5/5.0
- ARV discount +0.3/15.0
- Appreciation +0.0/10.0
$320,000
🖨 Deal sheet (PDF) 📄 Offer letter ✓ Due diligence
Listing remarks MLS
Who knew you could find such a secluded-feeling home in town? The outside is reminiscent of a chalet, yet the inside speaks modern upgrades! The main level has an open feel, with several doors to the wrap-around deck. Kitchen is fully upgraded with new cabinetry, granite counters, and stainless appliances. Main-floor bedroom with cathedral ceilings also has a California bath. The upper level has 3 bedrooms, one with a walk-in closet and balcony. All three baths have been updated, and the entire house has received a beautiful face-lift. The walk-out basement is just steps away from the in-ground pool, which has a new pump and new tile! A new roof completes the package. Peaceful and serene, Don't just imagine-- make this your home!
Key facts
- In-ground pool
- Pool shed
- Private oasis
Tags
Property features AI
Finance
- Other: Lot size source: Assessor
- Financial info: No investor or income/expense details listed
- HOA & community: No HOA or community details listed
Exterior
- Parking: Has garage; 2-car garage
- Security: No security features listed
- Utilities: Public water; Public sewer
- Home design: Built in 1974; One and one half stories
- Construction: No construction material or roof/foundation details listed
- Exterior features: Other view
Interior
- Kitchen: Dishwasher; Refrigerator; Microwave; Gas Range
- Bedrooms: Primary bedroom; Bedroom 2; Bedroom 3; Bedroom 4
- Flooring: No flooring details listed
- Bathrooms: 2 full bathrooms; 1 half bathroom
- Heating & cooling: Forced air heating; Central air conditioning
- Interior features: Basement (other type); Total of 7 rooms; No additional interior features listed
- Laundry & utility: No laundry/utility details listed
Neighborhood map
What this means for you Summary
Snapshot
- This is a 3-bed/3.0-bath single-family listed at $320k.
Deal economics
- At list price, monthly cash flow is $-125 ($-2k/yr) — negative.
- To cash-flow at today's rent, offer at most $298k (6.9% below list).
- To meet the 1% rule (rent ≥ 1% of price), the offer needs to be $242k (24.5% below list).
- Recommended offer: $242k (24.5% below list) — sets the bar for 1% rule.
- Cap rate 5.8% vs local median 4.7% in Merrillville — meaningfully above typical; check what's discounted (condition, days-on-market, listing class) to confirm the premium yield is real.
Location & tenants
- Location reads 76/100 on livability (#50 in IN, #3,393 nationally) — a middle-class / working-renter tenant base. Strengths: commute A+, cost of living A+, housing A+; Watch: amenities F, health & safety D-.
- Merrillville Community School Corporation (suburban): math 22% / reading 36% proficiency, ranked #240 of 301 in IN (top 80%) — low school quality limits family demand, transient renter base, plan for 1-2y turnover.
- Zoned schools: Homer Iddings Elementary School (math 22% / reading 22%, grade F, #790 of 994 statewide, top 81%, 488 students, 69% FRL); Pierce Middle School (math 18% / reading 37%, grade F, #230 of 330 statewide, top 71%, 919 students, 70% FRL); Merrillville High School (math 19% / reading 55%, grade F, #247 of 369 statewide, top 70%, 2,042 students, 64% FRL) — zoned schools average 68% FRL vs 50% district-wide (18 pts higher); higher-poverty schools than district average — tighter screening recommended.
- Market conditions: Rents rising fast (+4.1%/yr); 272 active listings in the ZIP; 4 comparable units currently listed for rent nearby; rentals leasing fast (median 10d on market — plan ~1-2 weeks tenant-placement turnaround); 1,642 units permitted in Lake County in 2024 (14 in 5+ unit buildings).
- At $2,416/mo this rent would consume 45% of the median local household income ($64k/yr) (locally 1644% of renters already pay >50% of income on rent) — very limited rent-growth headroom before tenants either downsize or default.
Forward outlook
- Local home prices are declining (-3.0%/yr); year-one equity from $2k of loan paydown is wiped out by about $10k of value loss. Plan a longer hold.
- Lake County population projected to shrink 7% by 2050 — rents likely to lag national; underwrite the cash flow, not the appreciation.
Negotiation context
- Only 2 days on market — expect competitive offers; lowballing is unlikely to land.
- 5 sale attempts since 28y ago with the ask held roughly flat each time — persistent listings suggest the price (not the market) is what's stuck; bring a comps-based counter.
- Current owner paid $177k; list at $320k implies a 81% gain — meaningful room to come down on a strong offer.
Questions for the listing agent
- What do current leases actually rent for vs. the listed asking? Can we see a recent rent roll and the last 12 months of T-12 income?
- Built in 1974 — when were the roof, HVAC, electrical panel, plumbing, and water heater last replaced?
- Is there a deadline driving the sale (1031 exchange, divorce, estate, relocation)? That informs how much negotiation room exists.
- Schools are D-rated, which usually means shorter tenancies and higher turnover. Who's the typical renter profile here, and what's been the actual vacancy rate?
- The area grade is low — what's the realistic commute time and amenity access for the typical tenant pool here? Any planned neighborhood developments (good or bad) we should know about?
- What's the average days-on-market for RENTAL listings here right now (not sales)? A rising rental-DOM trend means longer vacancies and softer asking-rent achievability than the comps imply.
- What's the recent tenant-quality profile in this submarket — average credit score on applications, eviction rate, late-payment / NSF rate, and stable-employment percentage? A property-management company in the area should have these aggregated.
- How much new for-sale + rental construction is in the pipeline within 1–3 miles? Heavy new supply typically softens prices + rents 12–24 months out; constrained supply supports both.
Investment metrics
- 1% rule
- 0.75% ✗
- Cap rate
- 5.82%
- Cash-on-cash
- -1.68%
- DSCR
- 0.93
- GRM
- 11.0
CMA / ARV
- ARV (on-the-fly)
- $275,772
- Comps found
- 12
Show comp detail 12 sales within ~0.75 mi
| Address | Dist | Beds/Ba | Sqft | Sold | Price | $/sf | Match |
|---|---|---|---|---|---|---|---|
| 1429 W 74th Pl | 0.60mi | 3/2.5 | 1,945 (+4%) | 2mo | $285,000 | $147 | 62 |
| 815 W 70th Ave | 0.58mi | 4/2.0 (+1) | 1,850 (-1%) | 1mo | $337,000 | $182 | 61 |
| 1110 W 72nd Cir | 0.57mi | 3/2.0 | 1,768 (-6%) | 1mo | $295,000 | $167 | 59 |
| 1130 W 72nd Ct | 0.63mi | 3/2.5 | 1,788 (-5%) | 4mo | $245,000 | $137 | 58 |
| 2 Meadow Ln | 0.55mi | 4/2.0 (+1) | 1,976 (+5%) | 2mo | $235,000 | $119 | 54 |
| 7710 Madison St | 0.56mi | 3/1.5 | 1,751 (-7%) | 4mo | $285,000 | $163 | 54 |
| 7216 Pierce St | 0.58mi | 3/2.0 | 2,060 (+10%) | 1mo | $273,900 | $133 | 52 |
| 860 W 79th Ave | 0.70mi | 4/2.0 (+1) | 2,004 (+7%) | 2mo | $365,000 | $182 | 45 |
| 7145 Delaware St | 0.64mi | 3/1.0 | 1,748 (-7%) | 7mo | $228,000 | $130 | 45 |
| 6797 Adams St | 0.66mi | 3/2.0 | 1,670 (-11%) | 3mo | $190,000 | $114 | 44 |
| 1540 W 76th Ave | 0.71mi | 3/3.0 | 2,100 (+12%) | 6mo | $419,900 | $200 | 42 |
| 6810 Van Buren St | 0.68mi | 4/2.0 (+1) | 2,128 (+13%) | 2mo | $243,000 | $114 | 35 |
Match score weights: distance 35% · size 25% · config 20% · recency 20%. Top-matched comps best support the ARV.
Projected returns pro-forma
-3.0% appreciation · 4.1% rent growth · sell at horizon
- IRR
- -18.0%
- Equity multiple
- 0.36×
- Total profit
- $-57,214
- Equity at exit
- $47,713
- IRR
- -8.4%
- Equity multiple
- 0.45×
- Total profit
- $-49,062
- Equity at exit
- $27,668
Cash invested: $89,600 (down + closing). Projections, not guarantees.
Landlord ↔ Tenant lean methodology
- Overall (STATE)
- 90 Strongly Landlord-Friendly
- State Indiana
- 90 Strongly Landlord-Friendly · R+11
- County
- — inherits STATE
- City
- — inherits STATE
ZIP-level market 46410
- Rents YoY
- 4.1%
- Active inventory
- 272
- Price-to-rent
- 11.0×
Monthly cashflow live
- Estimated rent
- $2,416 medium interval (Pro) →
- Mortgage (P&I)
- −$1,678
- Tax from tax record
- −$222 /mo · $2,668/yr
- Insurance
- −$133
- HOA
- −$0
- Vacancy / Maint / Mgmt
- −$507
- Net cashflow
- $-125
Break-even live
Sensitivity live
| Price | -10% $56 | -5% $-35 | +0% $-125 | +5% $-216 | +10% $-307 |
|---|---|---|---|---|---|
| Rent | -10% $-316 | -5% $-221 | +0% $-125 | +5% $-30 | +10% $65 |
| Rate | -1.0pp $36 | -0.5pp $-44 | base $-125 | +0.5pp $-208 | +1.0pp $-293 |
UW: 25.0% down · 7.5% · 30yr · 1.5% tax · 5.0% vac · 8.0% maint · 8.0% mgmt
Financing live
Cash to close
- Down payment
- $80,000
- Closing costs
- $9,600
- Reserves months
- —
- Total cash needed
- —
Loan-product check · same deal, 3 products live
Conventional
25% down · 7.5% · 30yr
- Down + closing
- —
- Monthly P&I
- —
- Monthly cashflow
- —
- DSCR
- —
- Eligible?
- —
Personal DTI + credit; lowest rate.
DSCR
20% down · 8.5% · 30yr
- Down + closing
- —
- Monthly P&I
- —
- Monthly cashflow
- —
- DSCR
- —
- Eligible?
- —
No personal income docs; deal must DSCR.
Hard money
10% down · 12.0% · 12mo
- Down + closing
- —
- Monthly P&I
- —
- Monthly cashflow
- —
- DSCR
- —
- Eligible?
- —
Short-term bridge; refi at stabilization.
Rent comps 4 comps
| Address | Beds | Baths | Sqft | Rent | $/sqft | DOM | Units | Dist |
|---|---|---|---|---|---|---|---|---|
| 691 W 77th Ave Unit 691 Merrillville, IN | 3.0 | 2.0 | 1300 | $2,300 | $1.77 | 9d | 1 | 0.48mi |
| 330 E 69th Pl Merrillville, IN | 3.0 | 1.5 | 1482 | $1,850 | $1.25 | 4d | 1 | 0.75mi |
| 8201 Polo Club Dr Merrillville, IN | 1.0–3.0 | 1.0–2.0 | 1200 | $2,137 | $1.78 | 1d | 16 | 1.39mi |
| 1865 W 64th Pl Merrillville, IN | 4.0 | 2.0 | 2034 | $4,900 | $2.41 | 45d | 1 | 1.45mi |
Listing history 8 events
-
2026-05-22$320,000 Active
-
2014-01-24soldstatus $177,000 739-char remark
Show marketing remark (739 chars)
Who knew you could find such a secluded-feeling home in town? The outside is reminiscent of a chalet, yet the inside speaks modern upgrades! The main level has an open feel, with several doors to the wrap-around deck. Kitchen is fully upgraded with new cabinetry, granite counters, and stainless appliances. Main-floor bedroom with cathedral ceilings also has a California bath. The upper level has 3 bedrooms, one with a walk-in closet and balcony. All three baths have been updated, and the entire house has received a beautiful face-lift. The walk-out basement is just steps away from the in-ground pool, which has a new pump and new tile! A new roof completes the package. Peaceful and serene, Don't just imagine-- make this your home!
-
2013-11-15$179,000 739-char remark
Show marketing remark (739 chars)
Who knew you could find such a secluded-feeling home in town? The outside is reminiscent of a chalet, yet the inside speaks modern upgrades! The main level has an open feel, with several doors to the wrap-around deck. Kitchen is fully upgraded with new cabinetry, granite counters, and stainless appliances. Main-floor bedroom with cathedral ceilings also has a California bath. The upper level has 3 bedrooms, one with a walk-in closet and balcony. All three baths have been updated, and the entire house has received a beautiful face-lift. The walk-out basement is just steps away from the in-ground pool, which has a new pump and new tile! A new roof completes the package. Peaceful and serene, Don't just imagine-- make this your home!
-
2013-08-28soldstatus $75,880 281-char remark
Show marketing remark (281 chars)
Unique cedar sided 2 story home located on a cul-de-sac lot in the heart of Merrillville. Property features, 4 bedrooms, 2 baths, an unfinished basement, 2 car detached garage, fenced yard, in ground pool, deck and balcony. Property needs work and updating but has great potential.
-
2013-06-05$75,000 281-char remark
Show marketing remark (281 chars)
Unique cedar sided 2 story home located on a cul-de-sac lot in the heart of Merrillville. Property features, 4 bedrooms, 2 baths, an unfinished basement, 2 car detached garage, fenced yard, in ground pool, deck and balcony. Property needs work and updating but has great potential.
-
2005-03-18$209,900
-
1998-10-31historical
-
1998-08-16$169,900
ⓘ Source: listings_history table (triggers on properties + properties_extension) + one-shot
backfill from property_details.listing_events for pre-trigger history.
Tax reassessment forecast IN · Partial reset (capped growth)
- Current annual tax
- $2,668 · $222/mo
- Projected year-2 tax
- $2,694 · $224/mo
- Expected delta
- +$26/yr (+$2/mo · 1.0%)
ⓘ Screening estimate from a state-policy table — verify with the county assessor before closing.
Climate risk First Street
- Flood 4/10 Moderate FEMA zone X (unshaded) · 21% chance over 30 yrs
- Wildfire 1/10 Low
- Heat 2/10 Low 7 d/yr ≥101°F today · 15 d/yr by 30 yrs out
- Wind 2/10 Low 0% chance of damaging wind over 30 yrs
- Air quality 3/10 Moderate 2 unhealthy d/yr today · 3 by 30 yrs out
Nearby sold comps map
Loading sold comps map…
Walkable amenities ~0.75 mi
Loading nearby amenities…
Taxation est. · year 1
- Rental income
- $28,987
- − Mortgage interest
- −$17,925
- − Property taxes
- −$2,668
- − Insurance
- −$1,600
- − Repairs & maintenance
- −$2,319
- − Management
- −$2,319
- − Depreciation
- −$9,309
- Taxable loss
- −$7,153
- Est. tax savings @ 24.0%
- +$1,717
- After-tax cash flow
- $211/yr
For passive investors: Depreciation is non-cash, so a rental often shows a tax loss while cash-flowing — sheltering income. Rental losses are passive: they offset passive income freely, and up to $25,000/yr can offset ordinary (W-2) income if you actively participate and your MAGI is under $100k (phasing out to $0 by $150k); unused losses carry forward. On sale, claimed depreciation is recaptured at up to 25%, and gains may owe capital-gains tax (a 1031 exchange can defer both). Figures are a year-1 estimate at your 24.0% rate — not tax advice; consult a CPA.
Schools (NCES district)
- District
- Merrillville Community School Corporation
- NCES district ID
- 1809690
- Math proficiency
- 22% ▼ -17.00%
- Reading proficiency
- 36% ▼ -8.00%
- Median HH income
- $54,401
- Composite
- 25.74/100
- National rank
- #7375
- State rank
- #240 of 301 in IN
Livability — Merrillville
- Score
- 76/100
- State rank
- #50
- US rank
- #3393
Category grades
Schools grade is shown separately in the Schools card above.
Census & demographics
- Census place
- Merrillville, IN
- County
- Lake County · 422,878 people
- City population
- 39,243
- Metro
- Chicago-Naperville-Elgin, IL-IN-WI
- Population (ZIP)
- 39,243
- Household income
- $64,127
- Rent vs Own
- Severe rent burden
- 1644.0
Population outlook (Lake County) Hauer SSP2
- Today (2025)
- 484,026 people
- By 2030
- 478,091 · -1.2%
- By 2040
- 462,974 · -4.3%
- By 2050
- 449,894 · -7.1%
- By 2075
- 436,169 · -9.9%
- By 2100
- 426,607 · -11.9%
Race, ethnicity, and origin ACS 2023
- Neighborhood character
- Diverse neighborhood (Simpson 0.66)
- Race & ethnicity
- Black 46% White 32% Hispanic / Latino 16% Two or more races 9% Asian 2%
- Hispanic origin (detail)
- Mexican 11% Puerto Rican 3%
- Common ancestry
- Romanian 4% Iranian 2% Italian 1%
- Foreign-born
- 7% · Canada
- Languages at home
- 88% English-only · Spanish 7% Other Indo-European 2%
Political lean MEDSL · Lake
- 2024 margin
- Lean D (+5.6) · D 52.1% · R 46.5% · Other 1.5%
- 2008→2024 swing
- -28.6pp toward R · 2008: 34.3pp · 2024: 5.6pp
- All cycles
- 2024: D+5.6 2020: D+15.1 2016: D+20.6 2012: D+31.0 2008: D+34.3
Not yet ingested
- Civics
- —
Market trends
- HPI YoY
- ▼ -180.11%
- Current HPI
- 240.8833
- Rent YoY
- ▲ 4.10%
- Metro
- Chicago-Naperville-Elgin, IL-IN-WI
- State GDP YoY
- ▲ 2.90%
- F500 in state
- 18
Industry mix (Fortune 500 HQ in IN)
| Industry | F500 HQs | Revenue |
|---|---|---|
| Industrial Machinery | 2 | $37B |
|
||
| Healthcare | 1 | $177B |
|
||
| Pharmaceuticals | 1 | $45B |
|
||
| Metals / Steel | 1 | $18B |
|
||
| Agriculture | 1 | $17B |
|
||
| Packaging | 1 | $12B |
|
||
Price history
+88.3% since first listed9 events — show timeline
- 2026-05-25 Pending — NIRA MLS as Distributed by MLS Grid
- 2026-05-22 Listed $320,000 NIRA MLS as Distributed by MLS Grid
- 2014-01-24 Sold (MLS) $177,000 NIRA MLS as Distributed by MLS Grid
- 2013-11-15 Listed $179,000 NIRA MLS as Distributed by MLS Grid
- 2013-08-28 Sold (MLS) $75,880 NIRA MLS as Distributed by MLS Grid
- 2013-06-05 Listed $75,000 NIRA MLS as Distributed by MLS Grid
- 2005-03-18 Listed $209,900 NIRA MLS as Distributed by MLS Grid
- 1998-10-31 Listing Removed — NIRA MLS as Distributed by MLS Grid
- 1998-08-16 Listed $169,900 NIRA MLS as Distributed by MLS Grid
Property tax history
+1.3%/yrLatest (2024): $2,668 · +2.2% YoY. Source: county tax records.
Cash-flow waterfall
monthlySold comps — $/sqft
last 12 mo · ≤1 miLoading sold comps…