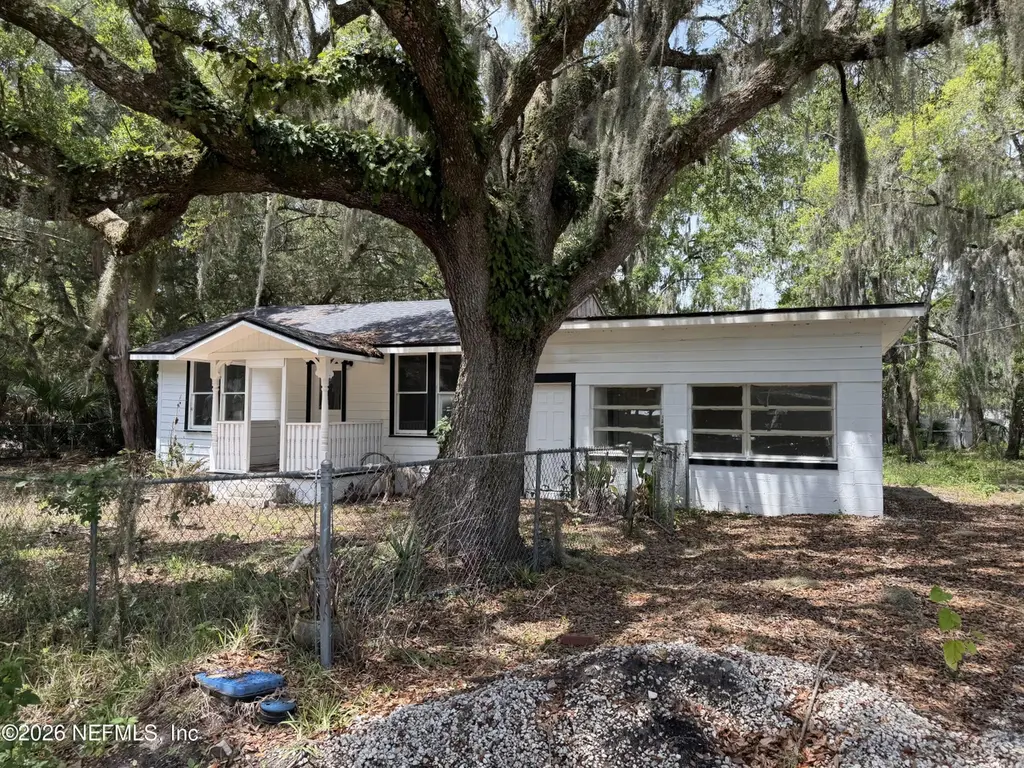
2891 Del Rio Dr Dr · St. Augustine, FL
Flood risk 1/10 · Minimal
- FEMA flood zone
- X (unshaded)
- Chance of flooding over 30 yrs
- 0.0%
- Est. flood insurance / yr
- $507 – $1,088
Fire risk 3/10 · Minor
- Est. fire insurance / yr
- $947 – $1,759
Heat risk 9/10 · Severe
- Hot days now (above 106°F)
- 7 days/yr
- Hot days in 30 yrs
- 20 days/yr
Wind risk 10/10 · Severe
- Chance of severe wind over 30 yrs
- 99.0%
Air-quality risk 3/10 · Minor
- Unhealthy air days now
- 3 days/yr
- Unhealthy air days in 30 yrs
- 3 days/yr
Risk factors via First Street. Map © Google.
Why this score? — see what drove the D grade
The composite is a weighted blend of 9 inputs, each scored 0–100. Each bar is that input's sub-score; the figure is the points it added to the 100-point composite (weight × sub-score).
- ARV discount +11.7/15.0
- Cash flow +11.5/30.0
- Schools +6.4/10.0
- DSCR +3.4/10.0
- 1% rule +2.6/10.0
- Rent growth +2.6/5.0
- Livability +2.5/5.0
- Condition / age +2.5/5.0
- Appreciation +0.0/10.0
$258,000
🖨 Deal sheet (PDF) 📄 Offer letter ✓ Due diligence
Listing remarks MLS
sold comp stat purposes only
Key facts
- Quiet neighborhood
- No hoa
- New roof
Tags
Property features AI
Finance
- HOA & community: Not a senior community
Exterior
- Parking: Off-street parking
- Utilities: Public sewer; Sewer and water connected
- Exterior features: No private pool; Single-family residence; Used as a single-family home
Interior
- Bedrooms: 3 bedrooms
- Bathrooms: 1 full bathroom
- Heating & cooling: Central heating; Central air conditioning
- Interior features: Electric oven; Microwave
Neighborhood map
What this means for you Summary
Snapshot
- This is a 3-bed/1.0-bath single-family listed at $258k.
Deal economics
- At list price, monthly cash flow is $-85 ($-1k/yr) — negative.
- To cash-flow at today's rent, offer at most $243k (5.8% below list).
- To meet the 1% rule (rent ≥ 1% of price), the offer needs to be $195k (24.4% below list).
- Recommended offer: $195k (24.4% below list) — sets the bar for 1% rule.
- Cap rate 5.9% vs local median 3.1% in St. Augustine — top-decile yield for the area; either an underpriced asset or a hidden risk that comps aren't pricing in. Stress-test before assuming the spread holds.
Location & tenants
- Location reads: area grade D — affects rentability + tenant quality, not the cash-flow math above.
- St. Johns (rural): math 75% / reading 73% proficiency, ranked #2 of 73 in FL (top 3%) — strong family-tenant draw, lease renewals of 3-5y typical; only 20% free/reduced lunch — higher-income household profile.
- Zoned schools: Crookshank Elementary School (math 64% / reading 62%, grade B, #582 of 2,144 statewide, top 28%, 704 students, 64% FRL); Sebastian Middle School (math 59% / reading 59%, grade B, #144 of 571 statewide, top 26%, 654 students, 42% FRL); St. Augustine High School (math 54% / reading 62%, grade C, #120 of 667 statewide, top 18%, 1,784 students, 38% FRL) — zoned schools average 48% FRL vs 20% district-wide (28 pts higher); higher-poverty schools than district average — tighter screening recommended.
- Zoned-school proficiency averages 60% at this address vs 74% district-wide (-14 pts) — the specific schools serving this property underperform the St. Johns average; the district grade overstates school quality for this exact location.
- Market conditions: Rents flat; 636 active listings in the ZIP; 34 comparable units currently listed for rent nearby; rentals at typical pace (median 23d on market — plan ~3-4 weeks tenant-placement turnaround); 5,575 units permitted in St. Johns County in 2024 (584 in 5+ unit buildings).
Forward outlook
- Local home prices are declining (-3.0%/yr); year-one equity from $2k of loan paydown is wiped out by about $8k of value loss. Plan a longer hold.
- St. Johns County population projected at +60% by 2050 — long-run rental-demand tailwind backs the buy-and-hold thesis.
Negotiation context
- It's been on market 21 days — a 2% lower offer ($254k) is reasonable based on typical stale-listing flexibility.
- 2 sale attempts since 2y ago with the ask held roughly flat each time — persistent listings suggest the price (not the market) is what's stuck; bring a comps-based counter.
- Current owner paid $125k; list at $258k implies a 106% gain — meaningful room to come down on a strong offer.
Risks & watch-outs
- Watch-outs: built in 1938 — expect roof / HVAC / electrical / plumbing capex.
- Climate carrying-cost: severe wind risk, 99% chance of damaging wind over 30y; extreme-heat days projected 7→20/yr by 2055 (HVAC capex compounding) — expect insurance premiums to compound above CPI over the hold.
Questions for the listing agent
- What do current leases actually rent for vs. the listed asking? Can we see a recent rent roll and the last 12 months of T-12 income?
- Built in 1938 — when were the roof, HVAC, electrical panel, plumbing, and water heater last replaced?
- Is there a deadline driving the sale (1031 exchange, divorce, estate, relocation)? That informs how much negotiation room exists.
- The area grade is low — what's the realistic commute time and amenity access for the typical tenant pool here? Any planned neighborhood developments (good or bad) we should know about?
- What's the average days-on-market for RENTAL listings here right now (not sales)? A rising rental-DOM trend means longer vacancies and softer asking-rent achievability than the comps imply.
- What's the recent tenant-quality profile in this submarket — average credit score on applications, eviction rate, late-payment / NSF rate, and stable-employment percentage? A property-management company in the area should have these aggregated.
- How much new for-sale + rental construction is in the pipeline within 1–3 miles? Heavy new supply typically softens prices + rents 12–24 months out; constrained supply supports both.
Investment metrics
- 1% rule
- 0.76% ✗
- Cap rate
- 5.90%
- Cash-on-cash
- -1.41%
- DSCR
- 0.94
- GRM
- 11.0
CMA / ARV
- ARV (median comp)
- $284,377
- List price
- $258,000
- Delta
- -9.28%
- Verdict
- FAIR
- Comps
- 20 within 1.0 mi
Show comp detail 12 sales within ~0.75 mi
| Address | Dist | Beds/Ba | Sqft | Sold | Price | $/sf | Match |
|---|---|---|---|---|---|---|---|
| 2812 N 1st St | 0.30mi | 2/2.0 (-1) | 1,064 (-3%) | 4mo | $238,000 | $224 | 68 |
| 2925 N 1st St | 0.34mi | 3/2.0 | 1,160 (+6%) | 6mo | $290,000 | $250 | 66 |
| 94 Red House Cir | 0.62mi | 2/2.5 (-1) | 1,109 (+1%) | 1mo | $213,000 | $192 | 58 |
| 348 Armas Ave | 0.63mi | 3/2.0 | 1,062 (-4%) | 4mo | $285,000 | $268 | 58 |
| 2843 N Eighth St | 0.68mi | 3/2.0 | 1,144 (+4%) | 1mo | $283,000 | $247 | 57 |
| 360 Varella Ave | 0.47mi | 2/1.0 (-1) | 1,034 (-6%) | 7mo | $190,000 | $184 | 57 |
| 347 Fortuna Ave | 0.57mi | 3/1.0 | 1,016 (-8%) | 5mo | $230,000 | $226 | 57 |
| 432 Pomont Ave | 0.50mi | 3/1.0 | 992 (-10%) | 9mo | $245,000 | $247 | 53 |
| 2885 N Eighth St | 0.68mi | 3/2.0 | 1,096 (-0%) | 14mo | $314,000 | $286 | 52 |
| 256 1/2 Cervantes | 0.74mi | 2/1.0 (-1) | 1,164 (+6%) | 3mo | $235,000 | $202 | 49 |
| 2867 N Eighth St | 0.68mi | 3/2.0 | 1,170 (+6%) | 10mo | $295,000 | $252 | 45 |
| 2942 N 7th St | 0.62mi | 3/2.0 | 1,171 (+6%) | 14mo | $295,000 | $252 | 45 |
Match score weights: distance 35% · size 25% · config 20% · recency 20%. Top-matched comps best support the ARV.
Projected returns pro-forma
-3.0% appreciation · 0.25% rent growth · sell at horizon
- IRR
- -21.5%
- Equity multiple
- 0.27×
- Total profit
- $-52,538
- Equity at exit
- $38,469
- IRR
- -22.5%
- Equity multiple
- -0.02×
- Total profit
- $-73,395
- Equity at exit
- $22,307
Cash invested: $72,240 (down + closing). Projections, not guarantees.
Landlord ↔ Tenant lean methodology
- Overall (STATE)
- 87 Strongly Landlord-Friendly
- State Florida
- 87 Strongly Landlord-Friendly · R+3
- County
- — inherits STATE
- City
- — inherits STATE
ZIP-level market 32084
- Rents YoY
- 0.2%
- Active inventory
- 636
- Price-to-rent
- 11.0×
Monthly cashflow live
- Estimated rent
- $1,951 high interval (Pro) →
- Mortgage (P&I)
- −$1,353
- Tax from tax record
- −$166 /mo · $1,993/yr
- Insurance
- −$108
- HOA
- −$0
- Vacancy / Maint / Mgmt
- −$410
- Net cashflow
- $-85
Break-even live
Sensitivity live
| Price | -10% $61 | -5% $-12 | +0% $-85 | +5% $-158 | +10% $-231 |
|---|---|---|---|---|---|
| Rent | -10% $-239 | -5% $-162 | +0% $-85 | +5% $-8 | +10% $69 |
| Rate | -1.0pp $45 | -0.5pp $-19 | base $-85 | +0.5pp $-152 | +1.0pp $-220 |
UW: 25.0% down · 7.5% · 30yr · 1.5% tax · 5.0% vac · 8.0% maint · 8.0% mgmt
Financing live
Cash to close
- Down payment
- $64,500
- Closing costs
- $7,740
- Reserves months
- —
- Total cash needed
- —
Loan-product check · same deal, 3 products live
Conventional
25% down · 7.5% · 30yr
- Down + closing
- —
- Monthly P&I
- —
- Monthly cashflow
- —
- DSCR
- —
- Eligible?
- —
Personal DTI + credit; lowest rate.
DSCR
20% down · 8.5% · 30yr
- Down + closing
- —
- Monthly P&I
- —
- Monthly cashflow
- —
- DSCR
- —
- Eligible?
- —
No personal income docs; deal must DSCR.
Hard money
10% down · 12.0% · 12mo
- Down + closing
- —
- Monthly P&I
- —
- Monthly cashflow
- —
- DSCR
- —
- Eligible?
- —
Short-term bridge; refi at stabilization.
Rent comps 34 comps
| Address | Beds | Baths | Sqft | Rent | $/sqft | DOM | Units | Dist |
|---|---|---|---|---|---|---|---|---|
| 2781 Schaller Rd Saint Augustine, FL | 3.0 | 2.0 | 1294 | $1,895 | $1.46 | 25d | 1 | 0.29mi |
| 510 Florida Club Blvd #101 Saint Augustine, FL | 3.0 | 2.0 | 1285 | $1,850 | $1.44 | 22d | 1 | 0.48mi |
| 520 Florida Club Blvd #104 Saint Augustine, FL | 2.0 | 2.0 | 1131 | $1,700 | $1.50 | 19d | 1 | 0.50mi |
| 79 Red House Cir Saint Augustine, FL | 2.0 | 2.5 | 1109 | $1,695 | $1.53 | 21d | 1 | 0.57mi |
| 197 Whispering Brook Dr Saint Augustine, FL | 2.0 | 2.5 | 1109 | $1,900 | $1.71 | 25d | 1 | 0.57mi |
| 48 Red House Cir Saint Augustine, FL | 3.0 | 2.5 | 1337 | $1,800 | $1.35 | 25d | 1 | 0.58mi |
| 98 Red House Cir Saint Augustine, FL | 2.0 | 2.5 | 1109 | $1,600 | $1.44 | 19d | 1 | 0.59mi |
| 98 Red House Cir Saint Augustine, FL | 2.0 | 2.5 | 1109 | $1,600 | $1.44 | 25d | 1 | 0.59mi |
| 106 Red House Cir Saint Augustine, FL | 2.0 | 2.0 | 1109 | $1,650 | $1.49 | 25d | 1 | 0.59mi |
| 106 Whispering Brook Dr Saint Augustine, FL | 2.0 | 2.5 | 1109 | $1,800 | $1.62 | 25d | 1 | 0.63mi |
| 2897 N 10th St Saint Augustine, FL | 3.0 | 2.0 | 1046 | $2,100 | $2.01 | 25d | 1 | 0.77mi |
| 725 Flagler Crossing Dr Saint Augustine, FL | 1.0–3.0 | 1.0–2.0 | 1002 | $2,117 | $2.11 | 4d | 37 | 0.86mi |
| 100 Lasa Dr Saint Augustine, FL | 1.0–3.0 | 1.0–2.0 | 1013 | $1,959 | $1.93 | 4d | 46 | 1.10mi |
| 289 W Jayce Way Saint Augustine, FL | 3.0 | 2.0 | 1102 | $1,851 | $1.68 | 15d | 1 | 1.11mi |
| 1160 N Saint Johns St Saint Augustine, FL | 3.0 | 2.0 | 1426 | $1,900 | $1.33 | 9d | 1 | 1.17mi |
| 119 Plantation Point Dr St. Augustine, FL | 3.0 | 2.0 | 1186 | $1,795 | $1.51 | 25d | 1 | 1.22mi |
| 119 Plantation Point Dr St. Augustine, FL | 3.0 | 2.0 | 1186 | $1,795 | $1.51 | 23d | 1 | 1.22mi |
| 127 Plantation Point Dr St. Augustine, FL | 3.0 | 2.0 | 1186 | $1,825 | $1.54 | 23d | 1 | 1.22mi |
| 2231 Vista Cove Rd Saint Augustine, FL | 3.0 | 2.0 | 1448 | $2,000 | $1.38 | 12d | 1 | 1.24mi |
| 1005 Bella Vista Blvd #205 St. Augustine, FL | 2.0 | 2.0 | 1285 | $1,850 | $1.44 | 25d | 1 | 1.25mi |
| 2089 W Lymington Way Saint Augustine, FL | 3.0 | 2.0 | 1318 | $1,976 | $1.50 | 5d | 1 | 1.26mi |
| 177 Palmer St Unit B St. Augustine, FL | 2.0 | 1.0 | 900 | $1,350 | $1.50 | 25d | 1 | 1.29mi |
| 32 Grant St Saint Augustine, FL | 2.0 | 1.0 | 1064 | $1,775 | $1.67 | 5d | 1 | 1.30mi |
| 232 Nesmith Ave Saint Augustine, FL | 4.0 | 2.0 | 1405 | $2,795 | $1.99 | 5d | 1 | 1.33mi |
| 8 Park Ave Unit 1281965P St. Augustine, FL | 3.0 | 3.5 | 1442 | $4,937 | $3.42 | 14d | 1 | 1.34mi |
| 7 Park Ave Saint Augustine, FL | 2.0 | 1.0 | 811 | $2,395 | $2.95 | 25d | 1 | 1.34mi |
| 228 Nesmith Ave Saint Augustine, FL | 2.0 | 2.0 | 1080 | $2,500 | $2.31 | 16d | 1 | 1.34mi |
| 4010 Grande Vista Blvd #118 St. Augustine, FL | 2.0 | 2.0 | 1212 | $1,595 | $1.32 | 25d | 1 | 1.35mi |
| 3425 Haley Pointe Rd St Augustine, FL | 3.0 | 2.0 | 1393 | $2,300 | $1.65 | 25d | 1 | 1.37mi |
| 1329 Truman Dr Saint Augustine, FL | 3.0 | 2.0 | 1229 | $2,030 | $1.65 | 25d | 1 | 1.37mi |
| 1035 Bella Vista Blvd #122 St. Augustine, FL | 2.0 | 2.0 | 1212 | $1,850 | $1.53 | 25d | 1 | 1.37mi |
| 15 Grant St Saint Augustine, FL | 2.0 | 2.0 | 1092 | $1,999 | $1.83 | 25d | 1 | 1.38mi |
| 1080 Bella Vista Blvd St Augustine, FL | 2.0 | 2.0 | 1233 | $1,798 | $1.46 | 21d | 2 | 1.42mi |
| 1080 Bella Vista Blvd #128 St. Augustine, FL | 2.0 | 2.0 | 1284 | $1,995 | $1.55 | 5d | 1 | 1.43mi |
Listing history 8 events
-
2026-06-03days on market $258,000 Active 21 DOM
-
2026-06-02days on market $258,000 Active 20 DOM
-
2026-06-01days on market $258,000 Active 19 DOM
-
2026-05-31days on market $258,000 Active 18 DOM
-
2026-05-13$258,000 Active 535-char remark
-
2024-09-30soldstatus $125,000
-
2024-09-17soldstatus $125,000 28-char remark
Show marketing remark (28 chars)
sold comp stat purposes only
-
2024-08-08$125,000 28-char remark
Show marketing remark (28 chars)
sold comp stat purposes only
ⓘ Source: listings_history table (triggers on properties + properties_extension) + one-shot
backfill from property_details.listing_events for pre-trigger history.
Tax reassessment forecast FL · Resets to sale price
- Current annual tax
- $1,993 · $166/mo
- Projected year-2 tax
- $2,141 · $178/mo
- Expected delta
- +$149/yr (+$12/mo · 7.5%)
ⓘ Screening estimate from a state-policy table — verify with the county assessor before closing.
Climate risk First Street
- Flood 1/10 Low FEMA zone X (unshaded) · 0% chance over 30 yrs
- Wildfire 3/10 Moderate
- Heat 9/10 Extreme 7 d/yr ≥106°F today · 20 d/yr by 30 yrs out
- Wind 10/10 Extreme 99% chance of damaging wind over 30 yrs
- Air quality 3/10 Moderate 3 unhealthy d/yr today · 3 by 30 yrs out
Nearby sold comps map
Loading sold comps map…
Walkable amenities ~0.75 mi
Loading nearby amenities…
Taxation est. · year 1
- Rental income
- $23,417
- − Mortgage interest
- −$14,452
- − Property taxes
- −$1,993
- − Insurance
- −$1,290
- − Repairs & maintenance
- −$1,873
- − Management
- −$1,873
- − Depreciation
- −$7,505
- Taxable loss
- −$5,570
- Est. tax savings @ 24.0%
- +$1,337
- After-tax cash flow
- $318/yr
For passive investors: Depreciation is non-cash, so a rental often shows a tax loss while cash-flowing — sheltering income. Rental losses are passive: they offset passive income freely, and up to $25,000/yr can offset ordinary (W-2) income if you actively participate and your MAGI is under $100k (phasing out to $0 by $150k); unused losses carry forward. On sale, claimed depreciation is recaptured at up to 25%, and gains may owe capital-gains tax (a 1031 exchange can defer both). Figures are a year-1 estimate at your 24.0% rate — not tax advice; consult a CPA.
Schools (NCES district)
- District
- St. Johns
- NCES district ID
- 1201740
- Math proficiency
- 75% ▼ -5.00%
- Reading proficiency
- 73% ▼ -2.00%
- Median HH income
- $66,842
- Composite
- 64.31/100
- National rank
- #556
- State rank
- #2 of 73 in FL
Livability — St. Augustine
No livability data for this city. (Only ~50 U.S. cities are tracked.)
Census & demographics
- County
- Saint Johns County · 301,599 people
- Metro
- Jacksonville, FL
- Population (ZIP)
- 37,291
- Household income
- $73,837
- Rent vs Own
- Severe rent burden
- 1748.0
Population outlook (St. Johns County) Hauer SSP2
- Today (2025)
- 303,941 people
- By 2030
- 342,590 · +12.7%
- By 2040
- 417,328 · +37.3%
- By 2050
- 487,011 · +60.2%
- By 2075
- 635,395 · +109.1%
- By 2100
- 717,469 · +136.1%
Race, ethnicity, and origin ACS 2023
- Neighborhood character
- Predominantly White (73%)
- Race & ethnicity
- White 73% Hispanic / Latino 12% Black 11% Two or more races 8%
- Hispanic origin (detail)
- Mexican 2% Puerto Rican 4% Cuban 1%
- Common ancestry
- Lithuanian 3% Romanian 2% Slovak 2%
- Foreign-born
- 6% · Canada, Jamaica
- Languages at home
- 91% English-only · Spanish 6% Other Indo-European 1%
Political lean MEDSL · St. Johns
- 2024 margin
- Solid R (+31.4) · D 33.9% · R 65.2%
- 2008→2024 swing
- +0.2pp no change · 2008: -31.6pp · 2024: -31.4pp
- All cycles
- 2024: R+31.4 2020: R+26.7 2016: R+33.4 2012: R+37.8 2008: R+31.6
Not yet ingested
- Civics
- —
Market trends
- HPI YoY
- ▼ -287.02%
- Current HPI
- 330.9505
- Rent YoY
- ▲ 0.25%
- Metro
- Jacksonville, FL
- State GDP YoY
- ▲ 3.28%
- F500 in state
- 36
Industry mix (Fortune 500 HQ in FL)
| Industry | F500 HQs | Revenue |
|---|---|---|
| Industrial Technology | 2 | $29B |
|
||
| Insurance | 2 | $17B |
|
||
| Retail | 1 | $60B |
|
||
| Technology Distribution | 1 | $58B |
|
||
| Homebuilding | 1 | $35B |
|
||
| Technology Manufacturing | 1 | $35B |
|
||
Price history
+106.4% since first listed5 events — show timeline
- 2026-06-03 Listing Removed — realMLS
- 2026-05-13 Listed $258,000 realMLS
- 2024-09-30 Sold (Public Records) $125,000 Public Records
- 2024-09-17 Sold (MLS) $125,000 St. Augustine and St. Johns County Board of REALTORS®
- 2024-08-08 Listed $125,000 St. Augustine and St. Johns County Board of REALTORS®
Property tax history
+6.0%/yrLatest (2025): $1,993 · -5.9% YoY. Source: county tax records.
Cash-flow waterfall
monthlySold comps — $/sqft
last 12 mo · ≤1 miLoading sold comps…