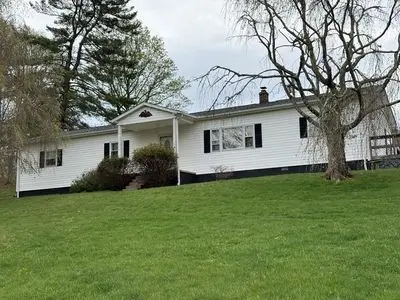
219 Blackberry Ln · Galax, VA
Flood risk 1/10 · Minimal
- FEMA flood zone
- X (unshaded)
- Chance of flooding over 30 yrs
- 0.0%
- Est. flood insurance / yr
- $507 – $1,088
Fire risk 5/10 · Moderate
- Est. fire insurance / yr
- $666 – $1,236
Heat risk 3/10 · Minor
- Hot days now (above 92°F)
- 7 days/yr
- Hot days in 30 yrs
- 19 days/yr
Wind risk 2/10 · Minimal
- Chance of severe wind over 30 yrs
- 1.0%
Air-quality risk 1/10 · Minimal
- Unhealthy air days now
- 0 days/yr
- Unhealthy air days in 30 yrs
- 0 days/yr
Risk factors via First Street. Map © Google.
Why this score? — see what drove the C- grade
The composite is a weighted blend of 9 inputs, each scored 0–100. Each bar is that input's sub-score; the figure is the points it added to the 100-point composite (weight × sub-score).
- Cash flow +19.9/30.0
- ARV discount +7.5/15.0
- DSCR +6.3/10.0
- Schools +5.4/10.0
- 1% rule +4.2/10.0
- Livability +3.3/5.0
- Rent growth +2.5/5.0
- Condition / age +2.5/5.0
- Appreciation +0.0/10.0
$135,000
🖨 Deal sheet (PDF) 📄 Offer letter ✓ Due diligence
Listing remarks MLS
4 BEDROOMS, 2 BATHS, 1632 SQ. FT. 1.45 ACRES OF LAND LOCATED IN GALAX, VIRGINIA. ROOM TO GROW IN THIS COUNTRY SETTING. TAX CARD STATES PROPERTY IS DOUBLEWIDE. APPEARS TO BE SINGLEWIDE WITH ADDITIONS.
Key facts
- Large lot
- Low-traffic street
- 1.45 acre lot
Tags
Property features AI
Exterior
- Utilities: Private well water; Septic tank sewer
- Home design: Single family residence; One story
- Construction: Vinyl siding; Shingle roof; Built with crawl space foundation
- Exterior features: Deck; Cleared and level lot (1.45 acres)
Interior
- Kitchen: Electric range; Microwave; Refrigerator
- Flooring: Carpet; Vinyl
- Bathrooms: 2 full bathrooms
- Heating & cooling: Heat pump; Electric heating; Baseboard heating; Central cooling (ceiling fans)
- Interior features: Ceiling fan(s); Crawl space basement
- Laundry & utility: Washer; Dryer
Neighborhood map
What this means for you Summary
Snapshot
- This is a 4-bed/2.0-bath single-family listed at $135k.
Deal economics
- At list price, monthly cash flow is $163 ($2k/yr) — positive.
- The deal already cash-flows at list — no discount required.
- To meet the 1% rule (rent ≥ 1% of price), the offer needs to be $124k (7.9% below list).
- Recommended offer: $124k (7.9% below list) — sets the bar for 1% rule.
- Cap rate 7.7% vs local median 3.7% in Galax — top-decile yield for the area; either an underpriced asset or a hidden risk that comps aren't pricing in. Stress-test before assuming the spread holds.
Location & tenants
- Location reads 66/100 on livability (#327 in VA) — a middle-class / working-renter tenant base. Strengths: cost of living A+, health & safety A+, housing A-; Watch: crime F, amenities F, commute F.
- Carroll County Public School District (rural): math 60% / reading 70% proficiency, ranked #46 of 131 in VA (top 35%) — acceptable for families but not a draw, mixed tenant base, ~2y average lease.
- Zoned schools: Gladeville Elementary (math 57% / reading 62%, grade B-, #536 of 1,108 statewide, top 51%, 267 students, 85% FRL); Carroll County Middle (math 54% / reading 72%, grade B+, #134 of 342 statewide, top 40%, 756 students, 84% FRL); Carroll County High (math 64% / reading 67%, grade B, #204 of 319 statewide, top 65%, 1,069 students, 81% FRL) — zoned schools average 83% FRL vs 48% district-wide (35 pts higher); higher-poverty schools than district average — tighter screening recommended.
- Market conditions: 122 active listings in the ZIP; 80 units permitted in Carroll County in 2024 (0 in 5+ unit buildings).
Forward outlook
- Local home prices are declining (-3.0%/yr); year-one equity from $933 of loan paydown is wiped out by about $4k of value loss. Plan a longer hold.
- Carroll County population projected at -18% by 2050 — secular population decline; favor cash flow + early exit over multi-decade hold.
Negotiation context
- It's been on market 31 days — a 3% lower offer ($131k) is reasonable based on typical stale-listing flexibility.
- 2 sale attempts since 9y ago with the ask held roughly flat each time — persistent listings suggest the price (not the market) is what's stuck; bring a comps-based counter.
- Current owner paid $34k; list at $135k implies a 297% gain — meaningful room to come down on a strong offer.
Risks & watch-outs
- Climate carrying-cost: moderate wildfire risk — expect insurance premiums to compound above CPI over the hold.
Questions for the listing agent
- It's been on market 31 days. Have you received any prior offers? Is the seller open to a 8% concession, seller financing, or rate buy-down credit?
- Is there a deadline driving the sale (1031 exchange, divorce, estate, relocation)? That informs how much negotiation room exists.
- Schools are B-rated — typically a magnet for longer-tenancy family renters. What's the average tenant stay here, and is there a school-zone premium baked into asking?
- Crime grade is F in this area — have there been break-ins, vandalism, or insurance claims at this property in the last 3 years? What carrier currently insures it and at what premium?
- What's the average days-on-market for RENTAL listings here right now (not sales)? A rising rental-DOM trend means longer vacancies and softer asking-rent achievability than the comps imply.
- What's the recent tenant-quality profile in this submarket — average credit score on applications, eviction rate, late-payment / NSF rate, and stable-employment percentage? A property-management company in the area should have these aggregated.
- How much new for-sale + rental construction is in the pipeline within 1–3 miles? Heavy new supply typically softens prices + rents 12–24 months out; constrained supply supports both.
Investment metrics
- 1% rule
- 0.92% ✗
- Cap rate
- 7.74%
- Cash-on-cash
- 5.18%
- DSCR
- 1.23
- GRM
- 9.0
CMA / ARV
- ARV (on-the-fly)
- $300,288
- Comps found
- 6
Show comp detail 6 sales within ~0.75 mi
| Address | Dist | Beds/Ba | Sqft | Sold | Price | $/sf | Match |
|---|---|---|---|---|---|---|---|
| 977 Cranberry Rd | 0.24mi | 3/2.0 (-1) | 1,700 (+4%) | 4mo | $337,500 | $199 | 73 |
| 782 Timberline Dr | 0.31mi | 3/2.0 (-1) | 1,700 (+4%) | 19mo | $358,000 | $211 | 58 |
| 768 Timberline Dr | 0.32mi | 3/2.0 (-1) | 1,729 (+6%) | 15mo | $319,000 | $184 | 58 |
| 521 Timberline Dr | 0.56mi | 3/2.5 (-1) | 1,711 (+5%) | 4mo | $213,000 | $124 | 55 |
| 21 Cedar Pt | 0.47mi | 3/2.0 (-1) | 1,848 (+13%) | 1mo | $257,500 | $139 | 50 |
| 1449 Cranberry Rd | 0.49mi | 3/1.0 (-1) | 1,400 (-14%) | 2mo | $198,000 | $141 | 43 |
Match score weights: distance 35% · size 25% · config 20% · recency 20%. Top-matched comps best support the ARV.
Projected returns pro-forma
-3.0% appreciation · 3.0% rent growth · sell at horizon
- IRR
- -8.3%
- Equity multiple
- 0.69×
- Total profit
- $-11,532
- Equity at exit
- $20,129
- IRR
- 1.2%
- Equity multiple
- 1.08×
- Total profit
- $3,136
- Equity at exit
- $11,672
Cash invested: $37,800 (down + closing). Projections, not guarantees.
Landlord ↔ Tenant lean methodology
- Overall (STATE)
- 55 Moderately Landlord-Leaning
- State Virginia
- 55 Moderately Landlord-Leaning · D+2
- County
- — inherits STATE
- City
- — inherits STATE
ZIP-level market 24333
- Home prices YoY
- -29.1%
- Active inventory
- 122
- Price-to-rent
- 9.0×
Monthly cashflow live
- Estimated rent
- $1,244 medium interval (Pro) →
- Mortgage (P&I)
- −$708
- Tax from tax record
- −$55 /mo · $660/yr
- Insurance
- −$56
- HOA
- −$0
- Vacancy / Maint / Mgmt
- −$261
- Net cashflow
- $163
Break-even live
Sensitivity live
| Price | -10% $240 | -5% $201 | +0% $163 | +5% $125 | +10% $87 |
|---|---|---|---|---|---|
| Rent | -10% $65 | -5% $114 | +0% $163 | +5% $212 | +10% $261 |
| Rate | -1.0pp $231 | -0.5pp $198 | base $163 | +0.5pp $128 | +1.0pp $93 |
UW: 25.0% down · 7.5% · 30yr · 1.5% tax · 5.0% vac · 8.0% maint · 8.0% mgmt
Financing live
Cash to close
- Down payment
- $33,750
- Closing costs
- $4,050
- Reserves months
- —
- Total cash needed
- —
Loan-product check · same deal, 3 products live
Conventional
25% down · 7.5% · 30yr
- Down + closing
- —
- Monthly P&I
- —
- Monthly cashflow
- —
- DSCR
- —
- Eligible?
- —
Personal DTI + credit; lowest rate.
DSCR
20% down · 8.5% · 30yr
- Down + closing
- —
- Monthly P&I
- —
- Monthly cashflow
- —
- DSCR
- —
- Eligible?
- —
No personal income docs; deal must DSCR.
Hard money
10% down · 12.0% · 12mo
- Down + closing
- —
- Monthly P&I
- —
- Monthly cashflow
- —
- DSCR
- —
- Eligible?
- —
Short-term bridge; refi at stabilization.
Listing history 5 events
-
2026-05-16status Pending
-
2026-04-15$135,000 Active
-
2017-08-30soldstatus $34,000 199-char remark
Show marketing remark (199 chars)
4 BEDROOMS, 2 BATHS, 1632 SQ. FT. 1.45 ACRES OF LAND LOCATED IN GALAX, VIRGINIA. ROOM TO GROW IN THIS COUNTRY SETTING. TAX CARD STATES PROPERTY IS DOUBLEWIDE. APPEARS TO BE SINGLEWIDE WITH ADDITIONS.
-
2017-07-26$36,100 199-char remark
Show marketing remark (199 chars)
4 BEDROOMS, 2 BATHS, 1632 SQ. FT. 1.45 ACRES OF LAND LOCATED IN GALAX, VIRGINIA. ROOM TO GROW IN THIS COUNTRY SETTING. TAX CARD STATES PROPERTY IS DOUBLEWIDE. APPEARS TO BE SINGLEWIDE WITH ADDITIONS.
-
2006-06-13soldstatus $95,000
ⓘ Source: listings_history table (triggers on properties + properties_extension) + one-shot
backfill from property_details.listing_events for pre-trigger history.
Tax reassessment forecast VA · Resets to sale price
- Current annual tax
- $660 · $55/mo
- Projected year-2 tax
- $1,107 · $92/mo
- Expected delta
- +$447/yr (+$37/mo · 67.7%)
ⓘ Screening estimate from a state-policy table — verify with the county assessor before closing.
Climate risk First Street
- Flood 1/10 Low FEMA zone X (unshaded) · 0% chance over 30 yrs
- Wildfire 5/10 Major
- Heat 3/10 Moderate 7 d/yr ≥92°F today · 19 d/yr by 30 yrs out
- Wind 2/10 Low 100% chance of damaging wind over 30 yrs
- Air quality 1/10 Low 0 unhealthy d/yr today · 0 by 30 yrs out
Nearby sold comps map
Loading sold comps map…
Walkable amenities ~0.75 mi
Loading nearby amenities…
Taxation est. · year 1
- Rental income
- $14,923
- − Mortgage interest
- −$7,562
- − Property taxes
- −$660
- − Insurance
- −$675
- − Repairs & maintenance
- −$1,194
- − Management
- −$1,194
- − Depreciation
- −$3,927
- Taxable loss
- −$289
- Est. tax savings @ 24.0%
- +$69
- After-tax cash flow
- $2,028/yr
For passive investors: Depreciation is non-cash, so a rental often shows a tax loss while cash-flowing — sheltering income. Rental losses are passive: they offset passive income freely, and up to $25,000/yr can offset ordinary (W-2) income if you actively participate and your MAGI is under $100k (phasing out to $0 by $150k); unused losses carry forward. On sale, claimed depreciation is recaptured at up to 25%, and gains may owe capital-gains tax (a 1031 exchange can defer both). Figures are a year-1 estimate at your 24.0% rate — not tax advice; consult a CPA.
Schools (NCES district)
- District
- Carroll County Public School District
- NCES district ID
- 5100690
- Math proficiency
- 60% ▼ -25.00%
- Reading proficiency
- 70% ▼ -10.00%
- Median HH income
- $36,359
- Composite
- 53.88/100
- National rank
- #1406
- State rank
- #46 of 131 in VA
Livability — Galax
- Score
- 66/100
- State rank
- #327
- US rank
- #12370
Category grades
Schools grade is shown separately in the Schools card above.
Census & demographics
- Population (ZIP)
- 17,841
Population outlook (Carroll County) Hauer SSP2
- Today (2025)
- 28,768 people
- By 2030
- 27,909 · -3.0%
- By 2040
- 25,788 · -10.4%
- By 2050
- 23,522 · -18.2%
- By 2075
- 19,045 · -33.8%
- By 2100
- 14,801 · -48.6%
Race, ethnicity, and origin ACS 2023
- Neighborhood character
- Predominantly White (84%)
- Race & ethnicity
- White 84% Hispanic / Latino 10% Two or more races 6% Black 3%
- Hispanic origin (detail)
- Mexican 5% Puerto Rican 1%
- Common ancestry
- Serbian 2% Slovak 1% Romanian 1%
- Foreign-born
- 5% · Canada, South Korea
- Languages at home
- 91% English-only · Spanish 8%
Political lean MEDSL · Carroll
- 2024 margin
- Solid R (+63.3) · D 18.1% · R 81.4%
- 2008→2024 swing
- -30.9pp toward R · 2008: -32.4pp · 2024: -63.3pp
- All cycles
- 2024: R+63.3 2020: R+62.7 2016: R+59.6 2012: R+39.4 2008: R+32.4
Not yet ingested
- Civics
- —
Market trends
- HPI YoY
- ▼ -69.21%
- Current HPI
- 168.5375
- Rent YoY
- —
- Metro
- —
- State GDP YoY
- ▲ 2.40%
- F500 in state
- 50
Industry mix (Fortune 500 HQ in VA)
| Industry | F500 HQs | Revenue |
|---|---|---|
| Aerospace / Defense | 4 | $236B |
|
||
| Technology / Defense | 3 | $32B |
|
||
| Financial Services | 2 | $176B |
|
||
| Utilities | 2 | $27B |
|
||
| Insurance | 2 | $25B |
|
||
| Technology | 2 | $15B |
|
||
Price history
+42.1% since first listed5 events — show timeline
- 2026-05-16 Pending — SWVAR
- 2026-04-15 Listed $135,000 SWVAR
- 2017-08-30 Sold (MLS) $34,000 SWVAR
- 2017-07-26 Listed $36,100 SWVAR
- 2006-06-13 Sold (Public Records) $95,000 Public Records
Property tax history
+0.7%/yrLatest (2025): $660 · +29.2% YoY. Source: county tax records.
Cash-flow waterfall
monthlySold comps — $/sqft
last 12 mo · ≤1 miLoading sold comps…