 🏗️ New Construction
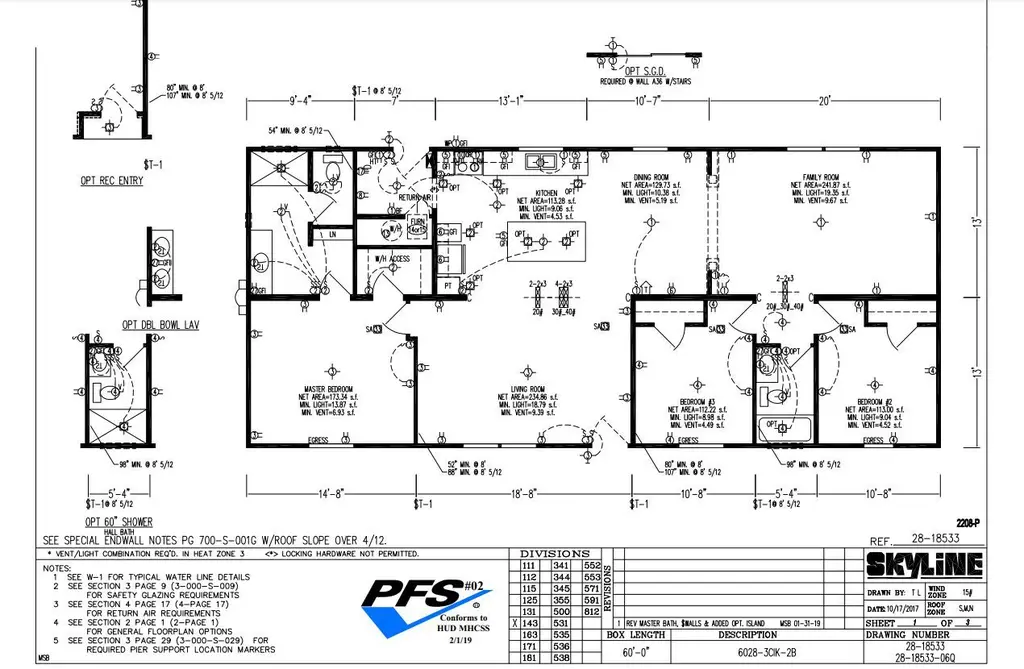
Champion Skyline FX 2208 P Plan · Sparta, MI
Flood risk No data
- FEMA flood zone
- —
- Chance of flooding over 30 yrs
- —
- Est. flood insurance / yr
- —
Fire risk No data
- Est. fire insurance / yr
- —
Heat risk No data
- Hot days now (above threshold)
- —
- Hot days in 30 yrs
- —
Wind risk No data
- Chance of severe wind over 30 yrs
- —
Air-quality risk No data
- Unhealthy air days now
- —
- Unhealthy air days in 30 yrs
- —
Risk factors via First Street. Map © Google.
Why this score? — see what drove the B- grade
The composite is a weighted blend of 9 inputs, each scored 0–100. Each bar is that input's sub-score; the figure is the points it added to the 100-point composite (weight × sub-score).
- Cash flow +30.0/30.0
- 1% rule +10.0/10.0
- DSCR +10.0/10.0
- ARV discount +7.5/15.0
- Livability +4.0/5.0
- Schools +3.5/10.0
- Rent growth +2.5/5.0
- Condition / age +1.0/5.0
- Appreciation +0.0/10.0
$162,900
🖨 Deal sheet 📄 Offer letter ✓ Due diligence
Listing remarks MLS
Sparta offers residents the best of both worlds! Being close to Grand Rapids, offering the benefits of living near a large city, and providing a small-town community feel. Summers in Sparta are filled with plenty of community events including a Farmer's Market, concerts, movies in Rogers Park, Sparta Town & Country Days, Celtic Fest, Michigan Apple Fest and Sparta Gus Macker 3-on-3 Basketball Tournament. The Rogue River is located nearby the Riverview Manufactured Home Community and is popular for Trout fishing and inner tube floating. This community is intersected in parts by the 92-mile long White Pine Trail, extending from Grand Rapids to Cadillac, where people enjoy walking, running, biking, and in the winter months, snowmobiling. This family-friendly community lies within the Spartan Area School District.
Key facts
- Listed 864 days
Neighborhood map
What this means for you Summary
Snapshot
- This is a 4-bed/2.0-bath manufactured listed at $163k. Condition is rated poor.
Deal economics
- At list price, monthly cash flow is $644 ($8k/yr) — positive.
- The deal already cash-flows at list — no discount required.
- Meets the 1% rule at list price ($2k rent vs $163k).
- Recommended offer: $143k (12.0% below list) — sets the bar for market timing.
- Cap rate 12.6% vs local median 4.5% in Sparta — top-decile yield for the area; either an underpriced asset or a hidden risk that comps aren't pricing in. Stress-test before assuming the spread holds.
Location & tenants
- Location reads 80/100 on livability (#83 in MI, #1,786 nationally) — a professional / high-income tenant draw. Strengths: cost of living A+, housing A+, health & safety A+; Watch: amenities D+, employment D, commute F.
- Sparta Area Schools (town): math 33% / reading 47% proficiency, ranked #201 of 540 in MI (top 37%) — families likely to look elsewhere, expect single-tenant / working-renter base with shorter leases.
- Market conditions: 100 active listings in the ZIP; 2,253 units permitted in Kent County in 2024 (969 in 5+ unit buildings).
Forward outlook
- Local home prices are declining (-3.0%/yr); year-one equity from $850 of loan paydown is wiped out by about $4k of value loss. Plan a longer hold.
- Kent County population projected at +22% by 2050 — long-run rental-demand tailwind backs the buy-and-hold thesis.
- At projected returns (-3.0% appreciation + 3.0% rent growth), your $34k cash investment doubles in ~6 years — after that, you're playing with house money.
Negotiation context
- It's been on market 864 days — a 12% lower offer ($143k) is reasonable based on typical stale-listing flexibility.
Questions for the listing agent
- It's been on market 864 days. Have you received any prior offers? Is the seller open to a 12% concession, seller financing, or rate buy-down credit?
- Have any recent inspections been done? Can we get a copy of the seller's disclosures and any deferred-maintenance estimates?
- Why hasn't it sold? Are there any deal-killer items the seller is aware of (foundation, flood, title, zoning, code violations)?
- Is there a deadline driving the sale (1031 exchange, divorce, estate, relocation)? That informs how much negotiation room exists.
- What's the average days-on-market for RENTAL listings here right now (not sales)? A rising rental-DOM trend means longer vacancies and softer asking-rent achievability than the comps imply.
- What's the recent tenant-quality profile in this submarket — average credit score on applications, eviction rate, late-payment / NSF rate, and stable-employment percentage? A property-management company in the area should have these aggregated.
- How much new for-sale + rental construction is in the pipeline within 1–3 miles? Heavy new supply typically softens prices + rents 12–24 months out; constrained supply supports both.
Investment metrics
- 1% rule
- 1.54% ✓
- Cap rate
- 12.58%
- Cash-on-cash
- 22.45%
- DSCR
- 2.00
- GRM
- 5.4
CMA / ARV
- ARV (median comp)
- $122,903
- List price
- $162,900
- Delta
- 32.54%
- Verdict
- OVERPRICED
- Comps
- 4 within 1.0 mi
Show comp detail 8 sales within ~0.75 mi
| Address | Dist | Beds/Ba | Sqft | Sold | Price | $/sf | Match |
|---|---|---|---|---|---|---|---|
| 3 Happy End #3 | 0.09mi | 3/2.0 (-1) | 1,680 (0%) | 8mo | $134,000 | $80 | 84 |
| 222 Circle Dr #222 | 0.17mi | 4/2.0 | 1,680 (0%) | 13mo | $139,900 | $83 | 82 |
| 108 San Souci Dr #108 | 0.08mi | 4/2.0 | 1,680 (0%) | 20mo | $159,900 | $95 | 80 |
| 81 Viking Dr #81 | 0.01mi | 4/2.0 | 1,568 (-7%) | 12mo | $144,900 | $92 | 79 |
| 75 Viking Dr #75 | 0.04mi | 4/2.0 | 1,568 (-7%) | 13mo | $144,900 | $92 | 76 |
| 31 Traveler Dr #31 | 0.07mi | 4/2.0 | 1,568 (-7%) | 13mo | $144,900 | $92 | 74 |
| 116 San Souci Dr #116 | 0.11mi | 3/2.0 (-1) | 1,568 (-7%) | 9mo | $139,900 | $89 | 71 |
| 115 San Souci Dr NW #115 | 0.20mi | 3/2.0 (-1) | 1,568 (-7%) | 15mo | $137,000 | $87 | 62 |
Match score weights: distance 35% · size 25% · config 20% · recency 20%. Top-matched comps best support the ARV.
Projected returns pro-forma
-3.0% appreciation · 3.0% rent growth · sell at horizon
- IRR
- 15.3%
- Equity multiple
- 1.61×
- Total profit
- $21,113
- Equity at exit
- $18,325
- IRR
- 24.0%
- Equity multiple
- 3.07×
- Total profit
- $71,294
- Equity at exit
- $10,626
Cash invested: $34,413 (down + closing). Projections, not guarantees.
Landlord ↔ Tenant lean methodology
- Overall (STATE)
- 62 Landlord-Friendly
- State Michigan
- 62 Landlord-Friendly · EVEN
- County
- — inherits STATE
- City
- — inherits STATE
ZIP-level market 49345
- Home prices YoY
- -27.3%
- Active inventory
- 100
- Price-to-rent
- 7.2×
Monthly cashflow live
- Estimated rent
- $1,890 medium interval (Pro) →
- Mortgage (P&I)
- −$645
- Tax est. 1.5%
- −$154 /mo · $1,844/yr
- Insurance
- −$51
- HOA
- −$0
- Vacancy / Maint / Mgmt
- −$397
- Net cashflow
- $644
Break-even live
UW: 25.0% down · 7.5% · 30yr · 1.5% tax · 5.0% vac · 8.0% maint · 8.0% mgmt
Financing live
Cash to close
- Down payment
- $30,726
- Closing costs
- $3,687
- Reserves months
- —
- Total cash needed
- —
Loan-product check · same deal, 3 products live
Conventional
25% down · 7.5% · 30yr
- Down + closing
- —
- Monthly P&I
- —
- Monthly cashflow
- —
- DSCR
- —
- Eligible?
- —
Personal DTI + credit; lowest rate.
DSCR
20% down · 8.5% · 30yr
- Down + closing
- —
- Monthly P&I
- —
- Monthly cashflow
- —
- DSCR
- —
- Eligible?
- —
No personal income docs; deal must DSCR.
Hard money
10% down · 12.0% · 12mo
- Down + closing
- —
- Monthly P&I
- —
- Monthly cashflow
- —
- DSCR
- —
- Eligible?
- —
Short-term bridge; refi at stabilization.
Listing history 15 events
-
2026-06-18days on market $162,900 Active 864 DOM
-
2026-06-17days on market $162,900 Active 863 DOM
-
2026-06-16days on market $162,900 Active 862 DOM
-
2026-06-15days on market $162,900 Active 861 DOM
-
2026-06-14days on market $162,900 Active 859 DOM
-
2026-06-13days on market $162,900 Active 858 DOM
-
2026-06-10days on market $162,900 Active 856 DOM
-
2026-06-09days on market $162,900 Active 855 DOM
-
2026-06-08days on market $162,900 Active 854 DOM
-
2026-06-07days on market $162,900 Active 853 DOM
-
2026-06-03days on market $162,900 Active 849 DOM
-
2026-06-03days on market $162,900 Active 848 DOM
-
2026-06-01days on market $162,900 Active 847 DOM
-
2026-05-31days on market $162,900 Active 846 DOM
-
2024-02-05$162,900 Active 827-char remark
Show marketing remark (827 chars)
Sparta offers residents the best of both worlds! Being close to Grand Rapids, offering the benefits of living near a large city, and providing a small-town community feel. Summers in Sparta are filled with plenty of community events including a Farmer's Market, concerts, movies in Rogers Park, Sparta Town & Country Days, Celtic Fest, Michigan Apple Fest and Sparta Gus Macker 3-on-3 Basketball Tournament. The Rogue River is located nearby the Riverview Manufactured Home Community and is popular for Trout fishing and inner tube floating. This community is intersected in parts by the 92-mile long White Pine Trail, extending from Grand Rapids to Cadillac, where people enjoy walking, running, biking, and in the winter months, snowmobiling. This family-friendly community lies within the Spartan Area School District.
ⓘ Source: listings_history table (triggers on properties + properties_extension) + one-shot
backfill from property_details.listing_events for pre-trigger history.
Nearby sold comps map
Loading sold comps map…
Walkable amenities ~0.75 mi
Loading nearby amenities…
Taxation est. · year 1
- Rental income
- $22,680
- − Mortgage interest
- −$6,885
- − Property taxes
- −$1,844
- − Insurance
- −$615
- − Repairs & maintenance
- −$1,814
- − Management
- −$1,814
- − Depreciation
- −$3,575
- Taxable income
- $6,133
- Est. tax owed @ 24.0%
- −$1,472
- After-tax cash flow
- $6,253/yr
For passive investors: Depreciation is non-cash, so a rental often shows a tax loss while cash-flowing — sheltering income. Rental losses are passive: they offset passive income freely, and up to $25,000/yr can offset ordinary (W-2) income if you actively participate and your MAGI is under $100k (phasing out to $0 by $150k); unused losses carry forward. On sale, claimed depreciation is recaptured at up to 25%, and gains may owe capital-gains tax (a 1031 exchange can defer both). Figures are a year-1 estimate at your 24.0% rate — not tax advice; consult a CPA.
Condition & rehab AI · 1 photo
This manufactured home requires extensive repairs and updates across all systems and areas, significantly impacting its current condition and value. Significant investments in kitchen, bathrooms, roof, exterior, flooring, interior walls, windows, HVAC, and landscaping are necessary to bring it up to a livable standard.
Repairs flagged
- Major Kitchen cabinets — No photos provided.
- Major Bathroom fixtures — No photos provided.
- Major Roof — No photos provided.
- Major Exterior siding — No photos provided.
- Major Flooring — No photos provided.
- Major Interior walls/paint — No photos provided.
- Major Windows — No photos provided.
- Major Foundation/structure — No photos provided.
- Major HVAC/mechanicals — No photos provided.
- Major Landscaping/curb appeal — No photos provided.
Value-add opportunities
- Both New kitchen cabinets and appliances — Modernizing the kitchen will improve both resale and rental value.
- Both New bathroom fixtures and tiling — Updating bathrooms will enhance both resale and rental appeal.
- Both New roof and siding — A new roof and siding will significantly improve the home's curb appeal and value.
- Both New flooring and paint — Fresh flooring and paint will make the home more attractive and increase its value.
- Both New windows and HVAC system — Upgrading windows and HVAC will improve energy efficiency and comfort, boosting both resale and rental value.
- Both Landscaping and curb appeal — A well-maintained yard and landscaping will enhance the home's curb appeal and attract more buyers/renters.
Renovation cost estimate screening
| Repair item | Severity | Est. cost |
|---|---|---|
| Kitchen cabinets · No photos provided. | Major | $15,000–50,000 |
| Bathroom fixtures · No photos provided. | Major | $15,000–50,000 |
| Roof · No photos provided. | Major | $15,000–50,000 |
| Exterior siding · No photos provided. | Major | $15,000–50,000 |
| Flooring · No photos provided. | Major | $15,000–50,000 |
| Interior walls/paint · No photos provided. | Major | $15,000–50,000 |
| Windows · No photos provided. | Major | $15,000–50,000 |
| Foundation/structure · No photos provided. | Major | $15,000–50,000 |
| HVAC/mechanicals · No photos provided. | Major | $15,000–50,000 |
| Landscaping/curb appeal · No photos provided. | Major | $15,000–50,000 |
| Total estimated repair cost · 10 items | $150,000–500,000 |
Value-add ROI direction
- Both New kitchen cabinets and appliances — Modernizing the kitchen will improve both resale and rental value. ↑
- Both New bathroom fixtures and tiling — Updating bathrooms will enhance both resale and rental appeal. ↑
- Both New roof and siding — A new roof and siding will significantly improve the home's curb appeal and value. ↑
- Both New flooring and paint — Fresh flooring and paint will make the home more attractive and increase its value. ↑
- Both New windows and HVAC system — Upgrading windows and HVAC will improve energy efficiency and comfort, boosting both resale and rental value. ↑
- Both Landscaping and curb appeal — A well-maintained yard and landscaping will enhance the home's curb appeal and attract more buyers/renters. ↑
ⓘ Cost ranges are severity-bucket heuristics (US national rule-of-thumb). Get contractor quotes + a written scope before underwriting a rehab budget.
Schools (NCES district)
- District
- Sparta Area Schools
- NCES district ID
- 2632370
- Math proficiency
- 33% ▼ -15.00%
- Reading proficiency
- 47% ▼ -9.00%
- Median HH income
- $54,917
- Composite
- 34.91/100
- National rank
- #5074
- State rank
- #201 of 540 in MI
Livability — Sparta
- Score
- 80/100
- State rank
- #83
- US rank
- #1786
Category grades
Schools grade is shown separately in the Schools card above.
Census & demographics
- City population
- 13,189
- Population (ZIP)
- 13,189
Population outlook (Kent County) Hauer SSP2
- Today (2025)
- 712,484 people
- By 2030
- 748,618 · +5.1%
- By 2040
- 814,777 · +14.4%
- By 2050
- 868,556 · +21.9%
- By 2075
- 966,487 · +35.7%
- By 2100
- 967,975 · +35.9%
Race, ethnicity, and origin ACS 2023
- Neighborhood character
- Predominantly White (90%)
- Race & ethnicity
- White 90% Two or more races 5% Hispanic / Latino 3% Asian 2%
- Common ancestry
- Iranian 17% Romanian 9% Lithuanian 4%
- Foreign-born
- 2% · Vietnam, South Korea, Canada
- Languages at home
- 96% English-only · Spanish 1% Other Indo-European 1% Vietnamese 1%
Political lean MEDSL · Kent
- 2024 margin
- Lean D (+5.4) · D 51.8% · R 46.5% · Other 1.7%
- 2008→2024 swing
- +4.8pp toward D · 2008: 0.5pp · 2024: 5.4pp
- All cycles
- 2024: D+5.4 2020: D+6.1 2016: R+3.1 2012: R+7.9 2008: D+0.5
Not yet ingested
- Civics
- —
Market trends
- HPI YoY
- ▼ -109.19%
- Current HPI
- 290.9224
- Rent YoY
- —
- Metro
- —
- State GDP YoY
- ▲ 1.37%
- F500 in state
- 28
Industry mix (Fortune 500 HQ in MI)
| Industry | F500 HQs | Revenue |
|---|---|---|
| Automotive Parts | 3 | $48B |
|
||
| Automotive | 2 | $372B |
|
||
| Chemicals | 1 | $45B |
|
||
| Automotive Retail | 1 | $29B |
|
||
| Healthcare / Medical Devices | 1 | $23B |
|
||
| Automotive Technology | 1 | $20B |
|
||
Price history
1 event — show timeline
- 2024-02-05 Listed $162,900 Zillow
Cash-flow waterfall
monthlySold comps — $/sqft
last 12 mo · ≤1 miLoading sold comps…