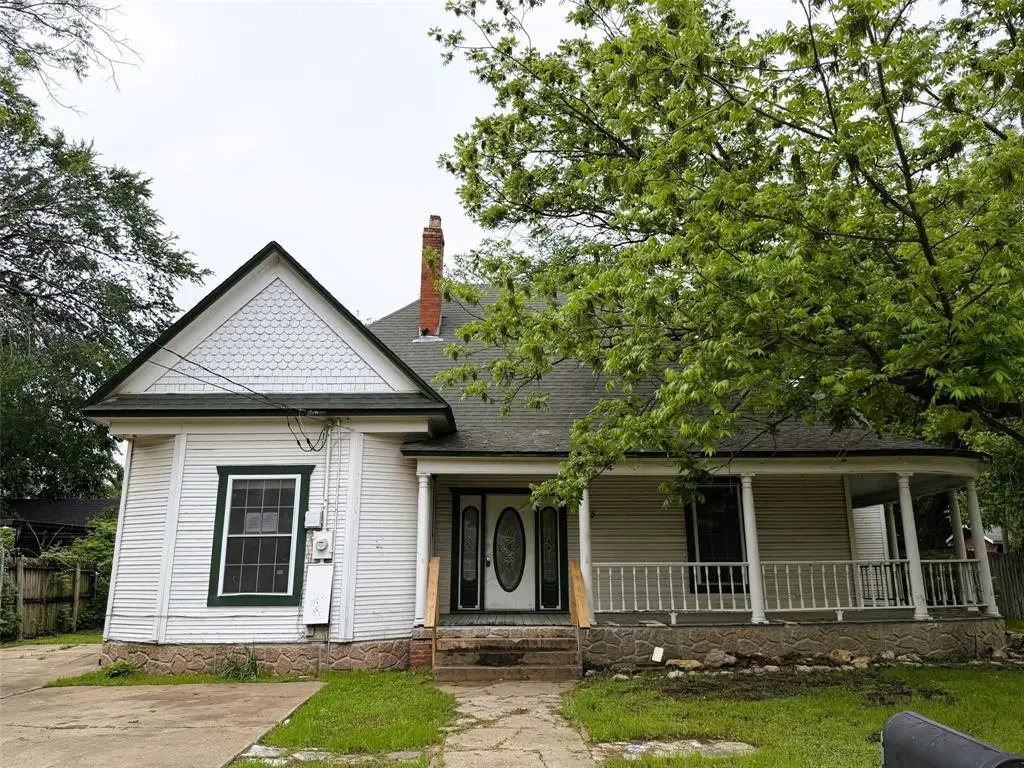
215 Heath St · Cleburne, TX
Flood risk 1/10 · Minimal
- FEMA flood zone
- X (unshaded)
- Chance of flooding over 30 yrs
- 0.0%
- Est. flood insurance / yr
- $507 – $1,088
Fire risk 5/10 · Moderate
- Est. fire insurance / yr
- $1,222 – $2,270
Heat risk 7/10 · Major
- Hot days now (above 109°F)
- 7 days/yr
- Hot days in 30 yrs
- 24 days/yr
Wind risk 6/10 · Moderate
- Chance of severe wind over 30 yrs
- 27.0%
Air-quality risk 2/10 · Minimal
- Unhealthy air days now
- 1 days/yr
- Unhealthy air days in 30 yrs
- 2 days/yr
Risk factors via First Street. Map © Google.
Why this score? — see what drove the B+ grade
The composite is a weighted blend of 9 inputs, each scored 0–100. Each bar is that input's sub-score; the figure is the points it added to the 100-point composite (weight × sub-score).
- Cash flow +29.7/30.0
- ARV discount +15.0/15.0
- DSCR +10.0/10.0
- 1% rule +9.2/10.0
- Livability +3.4/5.0
- Schools +2.9/10.0
- Rent growth +2.5/5.0
- Condition / age +2.5/5.0
- Appreciation +0.0/10.0
$130,000
🖨 Deal sheet 📄 Offer letter ✓ Due diligence
Listing remarks
HUD case number 513-135605. SOLD AS IS with all faults. Here's your chance to own a piece of historic Cleburne. A Craftsman from early 1900s, this 3 bedroom 2 bath home in Original Cleburne must have been something to see in its prime. Appears to have good bones and could be great opportunity to restore back to its original beauty. Large, wrap-around covered porch fulfills a wish list of many buyers. Large kitchen can accommodate a breakfast table to add an additional dining area. Or, make it the main dining and turn the dining room into an additional living room or another item on the wish list. Primary bedroom with private ensuite bath is accessed via the second bedroom and shares the la
Key facts
- Large kitchen
- Historic cleburne
- Large walk-in closet
Tags
Property features AI
Finance
- Other: Possession at closing/funding
- Financial info: Listing terms include Cash, Conventional, FHA, FHA-203K, and VA Loan; Special listing conditions: HUD owned
- HOA & community: No homeowners association
Exterior
- Parking: Driveway; no garage
- Utilities: City water; City sewer; Individual water meter; Electricity available; Overhead utilities; Curbs; asphalt access
- Home design: Single family residence; Residential property; One story; Preowned
- Construction: Aluminum siding and wood exterior; Asphalt composition shingle roof; Pillar/post/pier foundation; Year built: preowned (year not specified)
- Exterior features: Covered porch(es); Covered front porch; Wrap-around porch; Wood fence in back yard; Landscaped, level lot with large backyard grass and many trees; Corner lot; Subdivision setting
Interior
- Kitchen: Built-in cabinets; Dual sinks; Eat-in kitchen; Solid surface counters; Dishwasher; Electric range; Refrigerator; Electric water heater
- Bedrooms: Primary bedroom (level 1) with ensuite bath and walk-in closet; Bedroom (level 1) with walk-in closet; Bedroom (level 1) with walk-in closet
- Flooring: Wood flooring; Linoleum
- Bathrooms: 2 full bathrooms; Primary bathroom includes ensuite, medicine cabinet, and solid surface countertops; Second bathroom with solid surface countertops
- Heating & cooling: Central heating; Electric heating; Fireplace heating (2 fireplaces); Central air; Ceiling fan(s); Electric cooling
- Interior features: Walk-in closet(s); Window coverings; One living area; One dining area; Total 9 rooms; Levels: One
- Laundry & utility: Separate utility room; Utility room (full size W/D area); Washer hookup; Electric dryer hookup
Neighborhood map
What this means for you Summary
Snapshot
- This is a 3-bed/1.0-bath single-family listed at $130k.
Deal economics
- At list price, monthly cash flow is $474 ($6k/yr) — positive.
- The deal already cash-flows at list — no discount required.
- Meets the 1% rule at list price ($2k rent vs $130k).
- Cap rate 10.7% vs local median 3.6% in Cleburne — top-decile yield for the area; either an underpriced asset or a hidden risk that comps aren't pricing in. Stress-test before assuming the spread holds.
Location & tenants
- Location reads 68/100 on livability (#460 in TX) — a middle-class / working-renter tenant base. Strengths: cost of living A+, housing A+, health & safety A+; Watch: employment C-, amenities F, commute F.
- Cleburne ISD (town): math 34% / reading 33% proficiency, ranked #537 of 826 in TX (top 65%) — families likely to look elsewhere, expect single-tenant / working-renter base with shorter leases.
- Zoned schools: Santa Fe El (math 37% / reading 32%, grade F, #1,995 of 4,322 statewide, top 50%, 409 students, 91% FRL) — zoned schools average 91% FRL vs 56% district-wide (36 pts higher); higher-poverty schools than district average — tighter screening recommended.
- Market conditions: 335 active listings in the ZIP; 37 comparable units currently listed for rent nearby; rentals at typical pace (median 25d on market — plan ~3-4 weeks tenant-placement turnaround); 41% of comp listings sitting > 30 days — soft ceiling on asking rent; 2,152 units permitted in Johnson County in 2024 (76 in 5+ unit buildings).
Forward outlook
- Local home prices are declining (-3.0%/yr); year-one equity from $899 of loan paydown is wiped out by about $4k of value loss. Plan a longer hold.
- Johnson County population projected at +24% by 2050 — long-run rental-demand tailwind backs the buy-and-hold thesis.
- At projected returns (-3.0% appreciation + 3.0% rent growth), your $36k cash investment doubles in ~8 years — after that, you're playing with house money.
Negotiation context
- Only 12 days on market — expect competitive offers; lowballing is unlikely to land.
Risks & watch-outs
- Climate carrying-cost: major wind risk, 27% chance of damaging wind over 30y; moderate wildfire risk; extreme-heat days projected 7→24/yr by 2055 (HVAC capex compounding) — expect insurance premiums to compound above CPI over the hold.
Questions for the listing agent
- Is there a deadline driving the sale (1031 exchange, divorce, estate, relocation)? That informs how much negotiation room exists.
- Schools are F-rated, which usually means shorter tenancies and higher turnover. Who's the typical renter profile here, and what's been the actual vacancy rate?
- What's the average days-on-market for RENTAL listings here right now (not sales)? A rising rental-DOM trend means longer vacancies and softer asking-rent achievability than the comps imply.
- What's the recent tenant-quality profile in this submarket — average credit score on applications, eviction rate, late-payment / NSF rate, and stable-employment percentage? A property-management company in the area should have these aggregated.
- How much new for-sale + rental construction is in the pipeline within 1–3 miles? Heavy new supply typically softens prices + rents 12–24 months out; constrained supply supports both.
Investment metrics
- 1% rule
- 1.42% ✓
- Cap rate
- 10.67%
- Cash-on-cash
- 15.63%
- DSCR
- 1.70
- GRM
- 5.9
CMA / ARV
- ARV (median comp)
- $203,607
- List price
- $130,000
- Delta
- -36.15%
- Verdict
- UNDERPRICED
- Comps
- 20 within 1.0 mi
Show comp detail 12 sales within ~0.75 mi
| Address | Dist | Beds/Ba | Sqft | Sold | Price | $/sf | Match |
|---|---|---|---|---|---|---|---|
| 822 N Robinson St | 0.46mi | 3/1.0 | 1,575 (-4%) | 2mo | $100,000 | $63 | 70 |
| 206 Williams Ave | 0.44mi | 3/2.0 | 1,630 (-0%) | 8mo | $325,000 | $199 | 68 |
| 216 W Willingham St | 0.46mi | 3/2.0 | 1,592 (-3%) | 5mo | $264,900 | $166 | 66 |
| 217 W Heard St | 0.44mi | 3/2.0 | 1,494 (-9%) | 2mo | $229,900 | $154 | 59 |
| 511 W Wilson St | 0.69mi | 3/2.0 | 1,604 (-2%) | 2mo | $329,000 | $205 | 59 |
| 910 Baird St | 0.62mi | 3/2.0 | 1,557 (-5%) | 2mo | $260,000 | $167 | 57 |
| 702 N Walnut St | 0.47mi | 4/3.0 (+1) | 1,680 (+3%) | 6mo | $275,000 | $164 | 55 |
| 413 Shaw St | 0.68mi | 3/1.0 | 1,713 (+5%) | 7mo | $160,000 | $93 | 54 |
| 422 W Wilson St | 0.62mi | 3/2.0 | 1,745 (+7%) | 4mo | $239,500 | $137 | 53 |
| 226 W Willingham St | 0.51mi | 3/2.0 | 1,450 (-11%) | 3mo | $249,900 | $172 | 51 |
| 1300 N Brazos Ave | 0.44mi | 3/2.5 | 1,398 (-15%) | 3mo | $203,900 | $146 | 47 |
| 416 W Willingham St | 0.71mi | 3/3.0 | 1,708 (+4%) | 8mo | $213,999 | $125 | 45 |
Match score weights: distance 35% · size 25% · config 20% · recency 20%. Top-matched comps best support the ARV.
Projected returns pro-forma
-3.0% appreciation · 3.0% rent growth · sell at horizon
- IRR
- 6.5%
- Equity multiple
- 1.25×
- Total profit
- $9,212
- Equity at exit
- $19,383
- IRR
- 15.9%
- Equity multiple
- 2.30×
- Total profit
- $47,235
- Equity at exit
- $11,240
Cash invested: $36,400 (down + closing). Projections, not guarantees.
Landlord ↔ Tenant lean methodology
- Overall (STATE)
- 87 Strongly Landlord-Friendly
- State Texas
- 87 Strongly Landlord-Friendly · R+5
- County
- — inherits STATE
- City
- — inherits STATE
ZIP-level market 76031
- Home prices YoY
- -17.6%
- Active inventory
- 335
- Price-to-rent
- 5.9×
Monthly cashflow live
- Estimated rent
- $1,848 high interval (Pro) →
- Mortgage (P&I)
- −$682
- Tax from tax record
- −$250 /mo · $2,996/yr
- Insurance
- −$54
- HOA
- −$0
- Vacancy / Maint / Mgmt
- −$388
- Net cashflow
- $474
Break-even live
UW: 25.0% down · 7.5% · 30yr · 1.5% tax · 5.0% vac · 8.0% maint · 8.0% mgmt
Financing live
Cash to close
- Down payment
- $32,500
- Closing costs
- $3,900
- Reserves months
- —
- Total cash needed
- —
Loan-product check · same deal, 3 products live
Conventional
25% down · 7.5% · 30yr
- Down + closing
- —
- Monthly P&I
- —
- Monthly cashflow
- —
- DSCR
- —
- Eligible?
- —
Personal DTI + credit; lowest rate.
DSCR
20% down · 8.5% · 30yr
- Down + closing
- —
- Monthly P&I
- —
- Monthly cashflow
- —
- DSCR
- —
- Eligible?
- —
No personal income docs; deal must DSCR.
Hard money
10% down · 12.0% · 12mo
- Down + closing
- —
- Monthly P&I
- —
- Monthly cashflow
- —
- DSCR
- —
- Eligible?
- —
Short-term bridge; refi at stabilization.
Rent comps 37 comps
| Address | Beds | Baths | Sqft | Rent | $/sqft | DOM | Units | Dist |
|---|---|---|---|---|---|---|---|---|
| 612 N Robinson St Cleburne, TX | 3.0 | 2.5 | 1311 | $2,200 | $1.68 | 44d | 1 | 0.01mi |
| 110 E Wilson St Unit B Cleburne, TX | 3.0 | 2.5 | 1400 | $1,900 | $1.36 | 25d | 1 | 0.16mi |
| 104 May Ave Cleburne, TX | 3.0 | 2.0 | 1164 | $1,550 | $1.33 | 44d | 1 | 0.18mi |
| 103 May Ave Cleburne, TX | 3.0 | 2.0 | 1262 | $1,795 | $1.42 | 6d | 1 | 0.19mi |
| 438 Sabine Ave Cleburne, TX | 3.0 | 2.0 | 1230 | $1,650 | $1.34 | 13d | 1 | 0.53mi |
| 1005 N Buffalo Ave Cleburne, TX | 3.0 | 1.0 | 1146 | $1,500 | $1.31 | 44d | 1 | 0.59mi |
| 1005 N Buffalo Ave Cleburne, TX | 3.0 | 1.0 | 1146 | $1,500 | $1.31 | 3d | 1 | 0.59mi |
| 1005 N Buffalo Ave Cleburne, TX | 3.0 | 1.0 | 1146 | $1,500 | $1.31 | 25d | 1 | 0.59mi |
| 114 Scurlock Ave Cleburne, TX | 4.0 | 2.0 | 1457 | $1,770 | $1.21 | 44d | 1 | 0.61mi |
| 413 Shaw St Cleburne, TX | 4.0 | 2.0 | 1713 | $2,100 | $1.23 | 44d | 1 | 0.72mi |
| 318 College St Unit B Cleburne, TX | 2.0 | 1.0 | 1256 | $1,150 | $0.92 | 25d | 1 | 0.77mi |
| 704 S Anglin St Cleburne, TX | 4.0 | 3.0 | 2000 | $2,110 | $1.05 | 25d | 1 | 0.81mi |
| 1005 Granbury St Unit A Cleburne, TX | 3.0 | 2.0 | 1362 | $2,050 | $1.51 | 25d | 1 | 0.81mi |
| 405 College St Cleburne, TX | 3.0 | 2.0 | 1396 | $1,650 | $1.18 | 6d | 1 | 0.82mi |
| 405 Madison St Unit Na Cleburne, TX | 3.0 | 2.0 | 1645 | $1,975 | $1.20 | 44d | 1 | 0.82mi |
| 303 Eastland St Cleburne, TX | 3.0 | 3.0 | 1254 | $1,950 | $1.56 | 44d | 1 | 0.88mi |
| 706 S Brazos Ave Unit B Cleburne, TX | 4.0 | 2.0 | 1400 | $1,800 | $1.29 | 25d | 1 | 0.91mi |
| 805 N Douglas Ave Cleburne, TX | 3.0 | 2.0 | 1460 | $1,999 | $1.37 | 44d | 1 | 0.98mi |
| 514 Euclid St Cleburne, TX | 3.0 | 2.0 | 1152 | $1,595 | $1.38 | 44d | 1 | 1.02mi |
| 226 Seclusion Dr Cleburne, TX | 3.0–4.0 | 2.0 | 1641 | $2,205 | $1.34 | 1d | 1 | 1.02mi |
| 1405 Granbury St Cleburne, TX | 3.0 | 1.0 | 1278 | $1,545 | $1.21 | 25d | 1 | 1.07mi |
| 1218 E James St Cleburne, TX | 3.0 | 2.0 | 1335 | $1,695 | $1.27 | 44d | 1 | 1.08mi |
| 960 Traction Trl Cleburne, TX | 4.0 | 2.0 | 1836 | $2,200 | $1.20 | 44d | 1 | 1.12mi |
| 1507 Granbury St Cleburne, TX | 3.0 | 2.0 | 1140 | $1,811 | $1.59 | 25d | 1 | 1.13mi |
| 1108 Poindexter Ave Cleburne, TX | 3.0 | 1.0 | 1300 | $1,550 | $1.19 | 44d | 1 | 1.14mi |
| 521 Woodard Ave Unit One Cleburne, TX | 2.0 | 1.0 | 1350 | $1,000 | $0.74 | 44d | 1 | 1.15mi |
| 1606 Granbury St Unit A Cleburne, TX | 3.0 | 2.0 | 1289 | $1,650 | $1.28 | 13d | 1 | 1.16mi |
| 1315 Joslin St Cleburne, TX | 3.0 | 2.0 | 1294 | $1,595 | $1.23 | 7d | 1 | 1.18mi |
| 807 W Smith St Cleburne, TX | 3.0 | 2.0 | 1223 | $1,845 | $1.51 | 13d | 1 | 1.19mi |
| 404 Rose Ave Cleburne, TX | 4.0 | 2.0 | 1763 | $2,249 | $1.28 | 7d | 1 | 1.25mi |
| 203 Willana Ct Cleburne, TX | 3.0 | 2.0 | 1100 | $1,700 | $1.55 | 21d | 1 | 1.25mi |
| 414 Rose Ave Cleburne, TX | 4.0 | 2.0 | 1763 | $2,214 | $1.26 | 2d | 1 | 1.26mi |
| 1705 N Robinson St Cleburne, TX | 3.0 | 2.0 | 1076 | $1,450 | $1.35 | 25d | 1 | 1.33mi |
| 301 Pearl St Cleburne, TX | 3.0 | 2.0 | 1405 | $1,900 | $1.35 | 25d | 1 | 1.34mi |
| 1202 Spell Ave Cleburne, TX | 3.0 | 2.0 | 1482 | $1,850 | $1.25 | 13d | 1 | 1.36mi |
| 805 Bluffview Dr Cleburne, TX | 4.0 | 2.5 | 2203 | $2,245 | $1.02 | 44d | 1 | 1.37mi |
| 872 Eagles Nest Dr Cleburne, TX | 4.0 | 2.5 | 2203 | $2,200 | $1.00 | 44d | 1 | 1.49mi |
Listing history 4 events
-
2026-05-15$130,000 Active 1311-char remark
-
2018-08-01soldstatus
-
2012-01-19soldstatus
-
1995-10-27soldstatus
ⓘ Source: listings_history table (triggers on properties + properties_extension) + one-shot
backfill from property_details.listing_events for pre-trigger history.
Tax reassessment forecast TX · Resets to sale price
- Current annual tax
- $2,996 · $250/mo
- Projected year-2 tax
- $2,996 · $250/mo
- Expected delta
- $0/yr ($0/mo · 0.0%)
ⓘ Screening estimate from a state-policy table — verify with the county assessor before closing.
Climate risk First Street
- Flood 1/10 Low FEMA zone X (unshaded) · 0% chance over 30 yrs
- Wildfire 5/10 Major
- Heat 7/10 Severe 7 d/yr ≥109°F today · 24 d/yr by 30 yrs out
- Wind 6/10 Major 27% chance of damaging wind over 30 yrs
- Air quality 2/10 Low 1 unhealthy d/yr today · 2 by 30 yrs out
Nearby sold comps map
Loading sold comps map…
Walkable amenities ~0.75 mi
Loading nearby amenities…
Taxation est. · year 1
- Rental income
- $22,172
- − Mortgage interest
- −$7,282
- − Property taxes
- −$2,996
- − Insurance
- −$650
- − Repairs & maintenance
- −$1,774
- − Management
- −$1,774
- − Depreciation
- −$3,782
- Taxable income
- $3,915
- Est. tax owed @ 24.0%
- −$940
- After-tax cash flow
- $4,750/yr
For passive investors: Depreciation is non-cash, so a rental often shows a tax loss while cash-flowing — sheltering income. Rental losses are passive: they offset passive income freely, and up to $25,000/yr can offset ordinary (W-2) income if you actively participate and your MAGI is under $100k (phasing out to $0 by $150k); unused losses carry forward. On sale, claimed depreciation is recaptured at up to 25%, and gains may owe capital-gains tax (a 1031 exchange can defer both). Figures are a year-1 estimate at your 24.0% rate — not tax advice; consult a CPA.
Schools (NCES district)
- District
- Cleburne ISD
- NCES district ID
- 4814310
- Math proficiency
- 34% ▼ -2.00%
- Reading proficiency
- 33% ▼ -2.00%
- Median HH income
- $48,788
- Composite
- 29.0/100
- National rank
- #6618
- State rank
- #537 of 826 in TX
Livability — Cleburne
- Score
- 68/100
- State rank
- #460
- US rank
- #9292
Category grades
Schools grade is shown separately in the Schools card above.
Census & demographics
- Census place
- Cleburne, TX
- City population
- 29,538
- Population (ZIP)
- 18,697
Population outlook (Johnson County) Hauer SSP2
- Today (2025)
- 179,678 people
- By 2030
- 189,208 · +5.3%
- By 2040
- 207,261 · +15.4%
- By 2050
- 223,064 · +24.1%
- By 2075
- 259,979 · +44.7%
- By 2100
- 275,395 · +53.3%
Race, ethnicity, and origin ACS 2023
- Neighborhood character
- Predominantly White (66%)
- Race & ethnicity
- White 66% Hispanic / Latino 28% Two or more races 12% Black 3%
- Hispanic origin (detail)
- Mexican 23% Puerto Rican 3%
- Common ancestry
- Italian 1% Lithuanian 1% Slovak 1%
- Foreign-born
- 5% · Canada, Vietnam
- Languages at home
- 77% English-only · Spanish 22% Vietnamese 0%
Political lean MEDSL · Johnson
- 2024 margin
- Solid R (+51.4) · D 23.9% · R 75.3%
- 2008→2024 swing
- -3.9pp toward R · 2008: -47.5pp · 2024: -51.4pp
- All cycles
- 2024: R+51.4 2020: R+53.0 2016: R+58.3 2012: R+55.6 2008: R+47.5
Not yet ingested
- Civics
- —
Market trends
- HPI YoY
- ▼ -59.43%
- Current HPI
- 277.598
- Rent YoY
- —
- Metro
- —
- State GDP YoY
- ▲ 3.95%
- F500 in state
- 110
Industry mix (Fortune 500 HQ in TX)
| Industry | F500 HQs | Revenue |
|---|---|---|
| Energy | 16 | $1,198B |
|
||
| Technology | 5 | $198B |
|
||
| Engineering / Construction | 4 | $72B |
|
||
| Energy Services | 3 | $60B |
|
||
| Utilities | 3 | $41B |
|
||
| Healthcare | 2 | $330B |
|
||
Price history
5 events — show timeline
- 2026-05-27 Pending — NTREIS
- 2026-05-15 Listed $130,000 NTREIS
- 2018-08-01 Sold (Public Records) — Public Records
- 2012-01-19 Sold (Public Records) — Public Records
- 1995-10-27 Sold (Public Records) — Public Records
Property tax history
+4.8%/yrLatest (2025): $2,996 · +1.5% YoY. Source: county tax records.
Cash-flow waterfall
monthlySold comps — $/sqft
last 12 mo · ≤1 miLoading sold comps…