 Multi-family
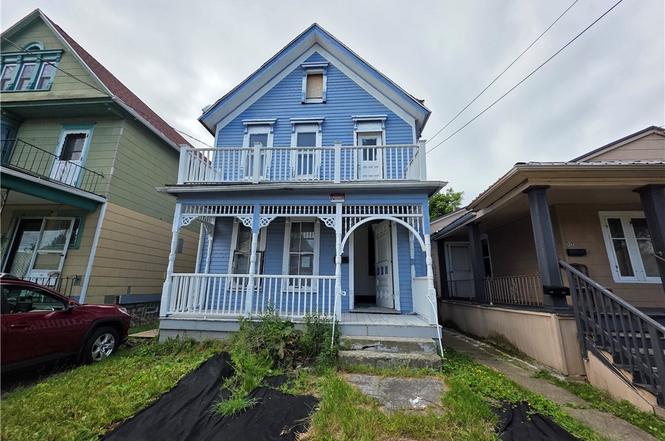
511 Dodge St · Buffalo, NY
Flood risk 1/10 · Minimal
- FEMA flood zone
- X (unshaded)
- Chance of flooding over 30 yrs
- 0.0%
- Est. flood insurance / yr
- $473 – $860
Fire risk 1/10 · Minimal
- Est. fire insurance / yr
- $691 – $1,283
Heat risk 2/10 · Minimal
- Hot days now (above 93°F)
- 7 days/yr
- Hot days in 30 yrs
- 15 days/yr
Wind risk 1/10 · Minimal
- Chance of severe wind over 30 yrs
- —
Air-quality risk 3/10 · Minor
- Unhealthy air days now
- 2 days/yr
- Unhealthy air days in 30 yrs
- 3 days/yr
Risk factors via First Street. Map © Google.
Why this score? — see what drove the C+ grade
The composite is a weighted blend of 9 inputs, each scored 0–100. Each bar is that input's sub-score; the figure is the points it added to the 100-point composite (weight × sub-score).
- Cash flow +30.0/30.0
- 1% rule +10.0/10.0
- DSCR +10.0/10.0
- Livability +3.9/5.0
- Schools +3.3/10.0
- Rent growth +2.5/5.0
- Condition / age +2.5/5.0
- ARV discount +0.0/15.0
- Appreciation +0.0/10.0
$135,000
🖨 Deal sheet 📄 Offer letter ✓ Due diligence
Multi-family units
County records classify this as Multi-Family (2-4 Unit). Listing-text estimate: 1 unit. estimate disagrees with records
Listing remarks MLS
3-Unit Multi-Family with Great Potential! Excellent investment opportunity in a convenient location. Each unit offers a functional layout and plenty of potential. With some updating, this property can become a strong income producer or a great owner-occupied option with rental income. Sold "as is". As per seller's directive, Delayed negotiation date is set up for 08/07/2025 12 noon. .. .
Key facts
- Investment property
- Full renovation
- 3,270 sq ft lot
Tags
Property features AI
Finance
- Financial info: Multi-unit property with 3 total units; Three separate gas meters; Two separate electric meters; Operating expense details: see remarks; Owner pays: see remarks; Rent includes: see remarks
Exterior
- Parking: See remarks for parking details
- Utilities: Public water connected; Sewer connected
- Home design: Single-story building; Resale property; Wood siding exterior
- Construction: Wood siding construction; Existing (previously built)
- Exterior features: Rectangular residential lot; City street frontage; Lot dimensions approximately 30 x 109
Interior
- Kitchen: Eat-in kitchen in one unit; Kitchens with dining area in two units
- Bedrooms: Two 2-bedroom units; One studio/one-bedroom-like unit with eat-in kitchen
- Bathrooms: Three full bathrooms (one per unit)
- Heating & cooling: Gas heating; Forced air; Space heaters
- Interior features: Partial basement
- Laundry & utility: Gas water heater
Neighborhood map
What this means for you Summary
Snapshot
- This is a 4-bed/2.0-bath multifamily listed at $135k.
Deal economics
- At list price, monthly cash flow is $3k ($35k/yr) — positive.
- The deal already cash-flows at list — no discount required.
- Meets the 1% rule at list price ($5k rent vs $135k).
- Cap rate 31.9% vs local median 8.0% in Buffalo — top-decile yield for the area; either an underpriced asset or a hidden risk that comps aren't pricing in. Stress-test before assuming the spread holds.
Location & tenants
- Location reads 77/100 on livability (#195 in NY, #3,011 nationally) — a middle-class / working-renter tenant base. Strengths: commute A+, housing A+, health & safety A+; Watch: crime F, employment D-.
- Buffalo City School District (urban): math 41% / reading 40% proficiency, ranked #535 of 590 in NY (top 91%) — families likely to look elsewhere, expect single-tenant / working-renter base with shorter leases; 75% free/reduced lunch — lower-income household profile, screen leases tightly.
- Market conditions: 54 active listings in the ZIP; 8 comparable units currently listed for rent nearby; rentals lingering (median 44d on market — plan ~5-8 weeks vacancy on turnover, expect pricing pressure); 50% of comp listings sitting > 30 days — soft ceiling on asking rent; 1,244 units permitted in Erie County in 2024 (563 in 5+ unit buildings).
- At $4,650/mo this rent would consume 115% of the median local household income ($48k/yr) (locally 723% of renters already pay >50% of income on rent) — very limited rent-growth headroom before tenants either downsize or default.
Forward outlook
- Local home prices are declining (-3.0%/yr); year-one equity from $933 of loan paydown is wiped out by about $4k of value loss. Plan a longer hold.
- At projected returns (-3.0% appreciation + 3.0% rent growth), your $38k cash investment doubles in ~2 years — after that, you're playing with house money.
Negotiation context
- Only 1 days on market — expect competitive offers; lowballing is unlikely to land.
- 8 sale attempts since 9y ago with the ask held roughly flat each time — persistent listings suggest the price (not the market) is what's stuck; bring a comps-based counter.
- Current owner paid $80k; list at $135k implies a 69% gain — meaningful room to come down on a strong offer.
Risks & watch-outs
- Watch-outs: built in 1920 — expect roof / HVAC / electrical / plumbing capex.
Questions for the listing agent
- Built in 1920 — when were the roof, HVAC, electrical panel, plumbing, and water heater last replaced?
- Is there a deadline driving the sale (1031 exchange, divorce, estate, relocation)? That informs how much negotiation room exists.
- Crime grade is F in this area — have there been break-ins, vandalism, or insurance claims at this property in the last 3 years? What carrier currently insures it and at what premium?
- What's the average days-on-market for RENTAL listings here right now (not sales)? A rising rental-DOM trend means longer vacancies and softer asking-rent achievability than the comps imply.
- What's the recent tenant-quality profile in this submarket — average credit score on applications, eviction rate, late-payment / NSF rate, and stable-employment percentage? A property-management company in the area should have these aggregated.
- How much new apartment / multifamily construction is in the pipeline within 1–3 miles? Heavy new supply (>2% of stock underway) typically softens rents 12–24 months out; light construction supports rent growth.
Investment metrics
- 1% rule
- 3.44% ✓
- Cap rate
- 31.90%
- Cash-on-cash
- 91.44%
- DSCR
- 5.07
- GRM
- 2.4
CMA / ARV
- ARV (on-the-fly)
- $94,868
- Comps found
- 9
Show comp detail 9 sales within ~0.75 mi
| Address | Dist | Beds/Ba | Sqft | Sold | Price | $/sf | Match |
|---|---|---|---|---|---|---|---|
| 511 Dodge St | 0.00mi | 5/3.0 (+1) | 2,564 (0%) | 8mo | $80,000 | $31 | 84 |
| 361 E North St Unit S | 0.40mi | 5/2.5 (+1) | 2,544 (-1%) | 3mo | $172,500 | $68 | 70 |
| 37 Pershing Ave | 0.31mi | 5/3.0 (+1) | 2,641 (+3%) | 1mo | $85,000 | $32 | 70 |
| 53 Pershing Ave | 0.29mi | 5/2.0 (+1) | 2,360 (-8%) | 11mo | $149,000 | $63 | 59 |
| 354 Fox St | 0.31mi | 4/2.0 | 2,380 (-7%) | 19mo | $110,000 | $46 | 58 |
| 421 E Utica St | 0.39mi | 5/2.0 (+1) | 2,377 (-7%) | 10mo | $210,000 | $88 | 56 |
| 553 E North St | 0.25mi | 5/2.0 (+1) | 2,272 (-11%) | 16mo | $83,800 | $37 | 51 |
| 502 Glenwood Ave | 0.50mi | 5/2.0 (+1) | 2,294 (-10%) | 7mo | $20,500 | $9 | 48 |
| 506 Glenwood Ave | 0.50mi | 5/2.0 (+1) | 2,310 (-10%) | 23mo | $79,000 | $34 | 36 |
Match score weights: distance 35% · size 25% · config 20% · recency 20%. Top-matched comps best support the ARV.
Projected returns pro-forma
-3.0% appreciation · 3.0% rent growth · sell at horizon
- IRR
- 92.2%
- Equity multiple
- 5.27×
- Total profit
- $161,563
- Equity at exit
- $20,129
- IRR
- 95.0%
- Equity multiple
- 10.97×
- Total profit
- $376,848
- Equity at exit
- $11,672
Cash invested: $37,800 (down + closing). Projections, not guarantees.
Landlord ↔ Tenant lean methodology
- Overall (STATE)
- 15 Strongly Tenant-Friendly
- State New York
- 15 Strongly Tenant-Friendly · D+10
- County
- — inherits STATE
- City
- — inherits STATE
ZIP-level market 14208
- Home prices YoY
- -3.4%
- Active inventory
- 54
- Price-to-rent
- 7.1×
Monthly cashflow live
- Estimated rent
- $4,650 high interval (Pro) →
- Mortgage (P&I)
- −$708
- Tax from tax record
- −$29 /mo · $347/yr
- Insurance
- −$56
- HOA
- −$0
- Vacancy / Maint / Mgmt
- −$976
- Net cashflow
- $2,880
Break-even live
3-unit breakdown (identical units grouped — click to expand)
| Units | Beds | Baths | Est. rent |
|---|---|---|---|
| 2× units | 2 | 1 | $3,190 |
| #1 | 2 | 1 | $1,595 |
| #2 | 2 | 1 | $1,595 |
| 1× unit | 1 | 1 | $1,460 |
| Total (3 units) | $4,650 | ||
UW: 25.0% down · 7.5% · 30yr · 1.5% tax · 5.0% vac · 8.0% maint · 8.0% mgmt
Financing live
Cash to close
- Down payment
- $33,750
- Closing costs
- $4,050
- Reserves months
- —
- Total cash needed
- —
Loan-product check · same deal, 3 products live
Conventional
25% down · 7.5% · 30yr
- Down + closing
- —
- Monthly P&I
- —
- Monthly cashflow
- —
- DSCR
- —
- Eligible?
- —
Personal DTI + credit; lowest rate.
DSCR
20% down · 8.5% · 30yr
- Down + closing
- —
- Monthly P&I
- —
- Monthly cashflow
- —
- DSCR
- —
- Eligible?
- —
No personal income docs; deal must DSCR.
Hard money
10% down · 12.0% · 12mo
- Down + closing
- —
- Monthly P&I
- —
- Monthly cashflow
- —
- DSCR
- —
- Eligible?
- —
Short-term bridge; refi at stabilization.
Rent comps 8 comps
| Address | Beds | Baths | Sqft | Rent | $/sqft | DOM | Units | Dist |
|---|---|---|---|---|---|---|---|---|
| 518 Wilson St Buffalo, NY | 5.0 | 1.5 | 1848 | $1,500 | $0.81 | 23d | 1 | 0.55mi |
| 79 Walden Ave Buffalo, NY | 3.0 | 1.0 | 2528 | $1,250 | $0.49 | 43d | 1 | 0.75mi |
| 28 Lonsdale Rd Buffalo, NY | 3.0 | 1.0 | 2735 | $1,725 | $0.63 | 43d | 1 | 0.77mi |
| 82 Butler Ave Unit 2 Buffalo, NY | 3.0 | 1.0 | 2752 | $1,300 | $0.47 | 43d | 1 | 0.79mi |
| 73 Inter Park Ave Buffalo, NY | 3.0 | 1.0 | 2080 | $1,300 | $0.62 | 14d | 1 | 0.81mi |
| 563 Humboldt Pkwy Buffalo, NY | 3.0 | 1.0 | 2004 | $1,200 | $0.60 | 23d | 1 | 1.03mi |
| 491 Emslie St Buffalo, NY | 3.0 | 1.0 | 2488 | $1,200 | $0.48 | 14d | 1 | 1.05mi |
| 98 E Delavan Ave Buffalo, NY | 4.0 | 2.0 | 3105 | $2,000 | $0.64 | 43d | 1 | 1.23mi |
Listing history 2 events
-
2026-06-19remarks 699-char remark
-
2026-06-19$135,000 Active 1 DOM
ⓘ Source: listings_history table (triggers on properties + properties_extension) + one-shot
backfill from property_details.listing_events for pre-trigger history.
Tax reassessment forecast NY · Partial reset (capped growth)
- Current annual tax
- $347 · $29/mo
- Projected year-2 tax
- $1,314 · $110/mo
- Expected delta
- +$967/yr (+$81/mo · 279.0%)
ⓘ Screening estimate from a state-policy table — verify with the county assessor before closing.
Climate risk First Street
- Flood 1/10 Low FEMA zone X (unshaded) · 0% chance over 30 yrs
- Wildfire 1/10 Low
- Heat 2/10 Low 7 d/yr ≥93°F today · 15 d/yr by 30 yrs out
- Wind 1/10 Low
- Air quality 3/10 Moderate 2 unhealthy d/yr today · 3 by 30 yrs out
Nearby sold comps map
Loading sold comps map…
Walkable amenities ~0.75 mi
Loading nearby amenities…
Taxation est. · year 1
- Rental income
- $55,800
- − Mortgage interest
- −$7,562
- − Property taxes
- −$347
- − Insurance
- −$675
- − Repairs & maintenance
- −$4,464
- − Management
- −$4,464
- − Depreciation
- −$3,927
- Taxable income
- $34,361
- Est. tax owed @ 24.0%
- −$8,247
- After-tax cash flow
- $26,318/yr
For passive investors: Depreciation is non-cash, so a rental often shows a tax loss while cash-flowing — sheltering income. Rental losses are passive: they offset passive income freely, and up to $25,000/yr can offset ordinary (W-2) income if you actively participate and your MAGI is under $100k (phasing out to $0 by $150k); unused losses carry forward. On sale, claimed depreciation is recaptured at up to 25%, and gains may owe capital-gains tax (a 1031 exchange can defer both). Figures are a year-1 estimate at your 24.0% rate — not tax advice; consult a CPA.
Schools (NCES district)
- District
- Buffalo City School District
- NCES district ID
- 3605850
- Math proficiency
- 41% ▲ 11.00%
- Reading proficiency
- 40% ▲ 7.00%
- Median HH income
- $31,665
- Composite
- 33.17/100
- National rank
- #5544
- State rank
- #535 of 590 in NY
Livability — Buffalo
- Score
- 77/100
- State rank
- #195
- US rank
- #3011
Category grades
Schools grade is shown separately in the Schools card above.
Census & demographics
- Census place
- Buffalo, NY
- County
- Erie County · 714,559 people
- City population
- 440,021
- Metro
- Buffalo-Cheektowaga, NY
- Population (ZIP)
- 12,572
- Household income
- $48,476
- Rent vs Own
- Severe rent burden
- 723.0
Population outlook (Erie County) Hauer SSP2
- Today (2025)
- 933,037 people
- By 2030
- 935,181 · +0.2%
- By 2040
- 928,531 · -0.5%
- By 2050
- 905,725 · -2.9%
- By 2075
- 834,037 · -10.6%
- By 2100
- 708,033 · -24.1%
Race, ethnicity, and origin ACS 2023
- Neighborhood character
- Predominantly Black (72%)
- Race & ethnicity
- Black 72% White 15% Asian 6% Two or more races 4% Hispanic / Latino 3%
- Common ancestry
- Romanian 2% Italian 1% Hispanic 0%
- Foreign-born
- 7% · Canada, South Korea, Philippines
- Languages at home
- 89% English-only · Other Indo-European 3% Spanish 2% French/Haitian/Cajun 1%
Political lean MEDSL · Erie
- 2024 margin
- Lean D (+9.7) · D 54.8% · R 45.2%
- 2008→2024 swing
- -7.9pp toward R · 2008: 17.5pp · 2024: 9.7pp
- All cycles
- 2024: D+9.7 2020: D+14.7 2016: D+4.8 2012: D+15.6 2008: D+17.5
Not yet ingested
- Civics
- —
Market trends
- HPI YoY
- ▼ -16.37%
- Current HPI
- 459.2084
- Rent YoY
- —
- Metro
- Buffalo-Cheektowaga, NY
- State GDP YoY
- ▲ 2.60%
- F500 in state
- 92
Industry mix (Fortune 500 HQ in NY)
| Industry | F500 HQs | Revenue |
|---|---|---|
| Financial Services | 10 | $950B |
|
||
| Consumer Goods | 9 | $162B |
|
||
| Insurance | 4 | $225B |
|
||
| Telecommunications | 2 | $144B |
|
||
| Pharmaceuticals | 2 | $112B |
|
||
| Media / Entertainment | 2 | $69B |
|
||
Price history
+170.5% since first listed24 events — show timeline
- 2026-06-18 Listed $135,000 WNYREIS
- 2025-10-13 Sold (MLS) $80,000 WNYREIS
- 2025-10-06 Sold (Public Records) $80,000 Public Records
- 2025-08-11 Pending — WNYREIS
- 2025-07-31 Listed $59,900 WNYREIS
- 2025-02-05 Relisted — WNYREIS
- 2025-02-05 Price Changed $119,000 WNYREIS
- 2025-01-16 Pending — WNYREIS
- 2024-12-16 Relisted — WNYREIS
- 2024-12-16 Price Changed $120,000 WNYREIS
- 2024-05-18 Pending — WNYREIS
- 2024-04-24 Listed $75,000 WNYREIS
- 2023-10-31 Listing Removed — WNYREIS
- 2023-06-15 Price Changed $125,000 WNYREIS
- 2022-12-13 Price Changed $128,000 WNYREIS
- 2022-10-31 Listed $130,000 WNYREIS
- 2018-08-06 Sold (MLS) $21,000 WNYREIS
- 2018-03-16 Pending — WNYREIS
- 2018-01-05 Pending — WNYREIS
- 2017-12-22 Price Changed $24,900 WNYREIS
- 2017-12-19 Listed $39,000 WNYREIS
- 2017-09-18 Pending — WNYREIS
- 2017-09-18 Listing Removed — WNYREIS
- 2017-06-19 Listed $49,900 WNYREIS
Property tax history
+9.1%/yrLatest (2025): $347 · +34.5% YoY. Source: county tax records.
Cash-flow waterfall
monthlySold comps — $/sqft
last 12 mo · ≤1 miLoading sold comps…