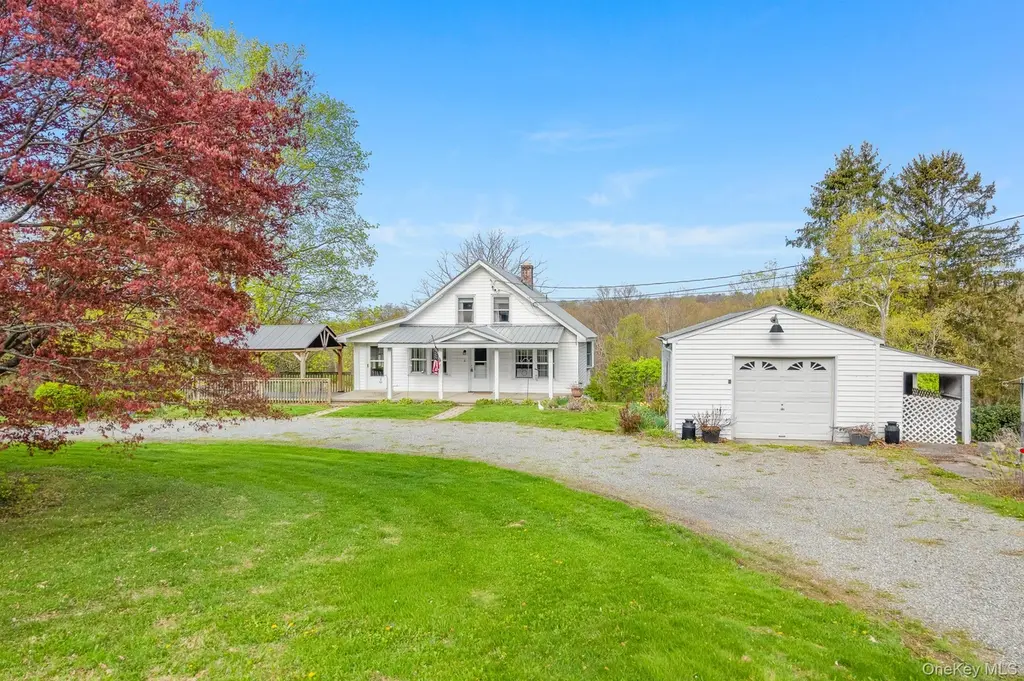
81 Verbank Rd · Millbrook, NY
Flood risk 1/10 · Minimal
- FEMA flood zone
- X (unshaded)
- Chance of flooding over 30 yrs
- 0.0%
- Est. flood insurance / yr
- $473 – $860
Fire risk 5/10 · Moderate
- Est. fire insurance / yr
- $691 – $1,283
Heat risk 4/10 · Minor
- Hot days now (above 95°F)
- 7 days/yr
- Hot days in 30 yrs
- 15 days/yr
Wind risk 4/10 · Minor
- Chance of severe wind over 30 yrs
- 15.0%
Air-quality risk 3/10 · Minor
- Unhealthy air days now
- 2 days/yr
- Unhealthy air days in 30 yrs
- 3 days/yr
Risk factors via First Street. Map © Google.
Why this score? — see what drove the C- grade
The composite is a weighted blend of 9 inputs, each scored 0–100. Each bar is that input's sub-score; the figure is the points it added to the 100-point composite (weight × sub-score).
- ARV discount +15.0/15.0
- Cash flow +12.2/30.0
- Schools +5.8/10.0
- DSCR +3.6/10.0
- Livability +3.4/5.0
- 1% rule +3.2/10.0
- Rent growth +2.5/5.0
- Condition / age +2.5/5.0
- Appreciation +2.4/10.0
$359,000
🖨 Deal sheet 📄 Offer letter ✓ Due diligence
Listing remarks
Welcome to 81 Verbank Road, a mid-century colonial set on nearly an acre in a peaceful country setting, just minutes from the Village of Millbrook. This charming home offers great potential, indoor and outdoor living space, and a flexible layout. Enjoy morning coffee on the covered front porch or relax on the covered rear deck overlooking the property. The main entrance opens to a generously sized living room featuring hardwood floors and an abundance of natural light from numerous windows. The oversized, updated galley kitchen offers ample counter space for meal prep, along with plenty of cabinetry for storage. Just off the kitchen, the dining room features a custom chandelier and provides
Key facts
- Covered front porch
- Ample counter space
- Nearly an acre
Tags
Property features AI
Exterior
- Parking: Driveway; Garage (1.5 spaces); Off-street parking; Private parking
- Utilities: Electric service by Central Hudson; Propane available; Water connected; Septic tank; Trash collection (private); Cable available; Electricity connected
- Home design: Single family residence
- Construction: Frame construction
- Exterior features: Frame construction; Not waterfront
Interior
- Kitchen: Dishwasher; Gas range; Refrigerator; Granite counters
- Bedrooms: Includes a first-floor bedroom
- Bathrooms: 2 full bathrooms
- Heating & cooling: Baseboard heating; Oil heating; No central cooling
- Interior features: First-floor bedroom; First-floor full bath; Built-in features; Formal dining room; Galley-style kitchen; Granite counters; Storage; Washer/dryer hookup; Partially finished walk-out basement
- Laundry & utility: Washer; Dryer; Washer/dryer hookup
Neighborhood map
What this means for you Summary
Snapshot
- This is a 3-bed/2.0-bath single-family listed at $359k.
Deal economics
- At list price, monthly cash flow is $-71 ($-850/yr) — negative.
- To cash-flow at today's rent, offer at most $346k (3.5% below list).
- To meet the 1% rule (rent ≥ 1% of price), the offer needs to be $295k (17.8% below list).
- Recommended offer: $295k (17.8% below list) — sets the bar for 1% rule.
- Cap rate 6.1% vs local median 2.1% in Millbrook — top-decile yield for the area; either an underpriced asset or a hidden risk that comps aren't pricing in. Stress-test before assuming the spread holds.
Location & tenants
- Location reads 68/100 on livability (#524 in NY) — a middle-class / working-renter tenant base. Strengths: crime A+, employment A; Watch: amenities F, commute F, cost of living F.
- Millbrook Central School District (rural): math 65% / reading 63% proficiency, ranked #198 of 755 in NY (top 26%) — acceptable for families but not a draw, mixed tenant base, ~2y average lease; only 17% free/reduced lunch — higher-income household profile.
- Zoned schools: Alden Place Elementary School (math 67% / reading 77%, grade A-, #378 of 2,108 statewide, top 20%, 169 students, 30% FRL); Millbrook Middle School (math 42% / reading 67%, grade B-, #214 of 729 statewide, top 31%, 202 students, 37% FRL); Millbrook High School (math 87%, 271 students, 34% FRL) — zoned schools average 33% FRL vs 17% district-wide (16 pts higher); higher-poverty schools than district average — tighter screening recommended.
- Market conditions: 46 active listings in the ZIP; 1 comparable units currently listed for rent nearby; 620 units permitted in Dutchess County in 2024 (242 in 5+ unit buildings).
Forward outlook
- Local home prices are declining (-3.0%/yr); year-one equity from $2k of loan paydown is wiped out by about $11k of value loss. Plan a longer hold.
- Dutchess County population projected at -11% by 2050 — secular population decline; favor cash flow + early exit over multi-decade hold.
Negotiation context
- It's been on market 42 days — a 3% lower offer ($348k) is reasonable based on typical stale-listing flexibility.
- 2 sale attempts with the ask held roughly flat each time — persistent listings suggest the price (not the market) is what's stuck; bring a comps-based counter.
Risks & watch-outs
- Watch-outs: built in 1940 — expect roof / HVAC / electrical / plumbing capex.
- Climate carrying-cost: moderate wildfire risk — expect insurance premiums to compound above CPI over the hold.
Questions for the listing agent
- What do current leases actually rent for vs. the listed asking? Can we see a recent rent roll and the last 12 months of T-12 income?
- It's been on market 42 days. Have you received any prior offers? Is the seller open to a 18% concession, seller financing, or rate buy-down credit?
- Built in 1940 — when were the roof, HVAC, electrical panel, plumbing, and water heater last replaced?
- Is there a deadline driving the sale (1031 exchange, divorce, estate, relocation)? That informs how much negotiation room exists.
- Schools are A-rated — typically a magnet for longer-tenancy family renters. What's the average tenant stay here, and is there a school-zone premium baked into asking?
- What's the average days-on-market for RENTAL listings here right now (not sales)? A rising rental-DOM trend means longer vacancies and softer asking-rent achievability than the comps imply.
- What's the recent tenant-quality profile in this submarket — average credit score on applications, eviction rate, late-payment / NSF rate, and stable-employment percentage? A property-management company in the area should have these aggregated.
- How much new for-sale + rental construction is in the pipeline within 1–3 miles? Heavy new supply typically softens prices + rents 12–24 months out; constrained supply supports both.
Investment metrics
- 1% rule
- 0.82% ✗
- Cap rate
- 6.06%
- Cash-on-cash
- -0.85%
- DSCR
- 0.96
- GRM
- 10.1
CMA / ARV
- ARV (median comp)
- $568,232
- List price
- $359,000
- Delta
- -36.82%
- Verdict
- UNDERPRICED
- Comps
- 5 within 1.0 mi
Projected returns pro-forma
-3.0% appreciation · 3.0% rent growth · sell at horizon
- IRR
- -17.7%
- Equity multiple
- 0.38×
- Total profit
- $-62,688
- Equity at exit
- $53,528
- IRR
- -9.8%
- Equity multiple
- 0.40×
- Total profit
- $-60,413
- Equity at exit
- $31,040
Cash invested: $100,520 (down + closing). Projections, not guarantees.
Landlord ↔ Tenant lean methodology
- Overall (STATE)
- 15 Strongly Tenant-Friendly
- State New York
- 15 Strongly Tenant-Friendly · D+10
- County
- — inherits STATE
- City
- — inherits STATE
ZIP-level market 12545
- Home prices YoY
- -2.0%
- Active inventory
- 46
- Price-to-rent
- 10.1×
Monthly cashflow live
- Estimated rent
- $2,950 medium interval (Pro) →
- Mortgage (P&I)
- −$1,883
- Tax from tax record
- −$369 /mo · $4,429/yr
- Insurance
- −$150
- HOA
- −$0
- Vacancy / Maint / Mgmt
- −$620
- Net cashflow
- $-71
Break-even live
UW: 25.0% down · 7.5% · 30yr · 1.5% tax · 5.0% vac · 8.0% maint · 8.0% mgmt
Financing live
Cash to close
- Down payment
- $89,750
- Closing costs
- $10,770
- Reserves months
- —
- Total cash needed
- —
Loan-product check · same deal, 3 products live
Conventional
25% down · 7.5% · 30yr
- Down + closing
- —
- Monthly P&I
- —
- Monthly cashflow
- —
- DSCR
- —
- Eligible?
- —
Personal DTI + credit; lowest rate.
DSCR
20% down · 8.5% · 30yr
- Down + closing
- —
- Monthly P&I
- —
- Monthly cashflow
- —
- DSCR
- —
- Eligible?
- —
No personal income docs; deal must DSCR.
Hard money
10% down · 12.0% · 12mo
- Down + closing
- —
- Monthly P&I
- —
- Monthly cashflow
- —
- DSCR
- —
- Eligible?
- —
Short-term bridge; refi at stabilization.
Rent comps 1 comps
| Address | Beds | Baths | Sqft | Rent | $/sqft | DOM | Units | Dist |
|---|---|---|---|---|---|---|---|---|
| 58 On the Grn Verbank, NY | 3.0 | 1.0 | 1382 | $2,950 | $2.13 | 21d | 1 | 0.79mi |
Listing history 17 events
-
2026-06-18days on market $359,000 Active 42 DOM
-
2026-06-17days on market $359,000 Active 41 DOM
-
2026-06-16days on market $359,000 Active 40 DOM
-
2026-06-15days on market $359,000 Active 39 DOM
-
2026-06-13days on market $359,000 Active 37 DOM
-
2026-06-12days on market $359,000 Active 36 DOM
-
2026-06-09days on market $359,000 Active 33 DOM
-
2026-06-08days on market $359,000 Active 32 DOM
-
2026-06-07days on market $359,000 Active 31 DOM
-
2026-06-07days on market $359,000 Active 30 DOM
-
2026-06-04days on market $359,000 Active 27 DOM
-
2026-06-02days on market $359,000 Active 26 DOM
-
2026-06-01days on market $359,000 Active 25 DOM
-
2026-05-31days on market $359,000 Active 24 DOM
-
2026-05-06$359,000 Active 1371-char remark
-
2026-03-30historical
-
2026-02-26$349,000 Active
ⓘ Source: listings_history table (triggers on properties + properties_extension) + one-shot
backfill from property_details.listing_events for pre-trigger history.
Tax reassessment forecast NY · Partial reset (capped growth)
- Current annual tax
- $4,429 · $369/mo
- Projected year-2 tax
- $5,248 · $437/mo
- Expected delta
- +$819/yr (+$68/mo · 18.5%)
ⓘ Screening estimate from a state-policy table — verify with the county assessor before closing.
Climate risk First Street
- Flood 1/10 Low FEMA zone X (unshaded) · 0% chance over 30 yrs
- Wildfire 5/10 Major
- Heat 4/10 Moderate 7 d/yr ≥95°F today · 15 d/yr by 30 yrs out
- Wind 4/10 Moderate 15% chance of damaging wind over 30 yrs
- Air quality 3/10 Moderate 2 unhealthy d/yr today · 3 by 30 yrs out
Nearby sold comps map
Loading sold comps map…
Walkable amenities ~0.75 mi
Loading nearby amenities…
Taxation est. · year 1
- Rental income
- $35,400
- − Mortgage interest
- −$20,110
- − Property taxes
- −$4,429
- − Insurance
- −$1,795
- − Repairs & maintenance
- −$2,832
- − Management
- −$2,832
- − Depreciation
- −$10,444
- Taxable loss
- −$7,041
- Est. tax savings @ 24.0%
- +$1,690
- After-tax cash flow
- $840/yr
For passive investors: Depreciation is non-cash, so a rental often shows a tax loss while cash-flowing — sheltering income. Rental losses are passive: they offset passive income freely, and up to $25,000/yr can offset ordinary (W-2) income if you actively participate and your MAGI is under $100k (phasing out to $0 by $150k); unused losses carry forward. On sale, claimed depreciation is recaptured at up to 25%, and gains may owe capital-gains tax (a 1031 exchange can defer both). Figures are a year-1 estimate at your 24.0% rate — not tax advice; consult a CPA.
Schools (NCES district)
- District
- Millbrook Central School District
- NCES district ID
- 3619380
- Math proficiency
- 65% ▲ 1.00%
- Reading proficiency
- 63% ▲ 5.00%
- Median HH income
- $77,504
- Composite
- 58.47/100
- National rank
- #2061
- State rank
- #198 of 755 in NY
Livability — Millbrook
- Score
- 68/100
- State rank
- #524
- US rank
- #9248
Category grades
Schools grade is shown separately in the Schools card above.
Census & demographics
- Population (ZIP)
- 4,389
Population outlook (Dutchess County) Hauer SSP2
- Today (2025)
- 291,768 people
- By 2030
- 287,131 · -1.6%
- By 2040
- 274,881 · -5.8%
- By 2050
- 259,971 · -10.9%
- By 2075
- 235,366 · -19.3%
- By 2100
- 208,786 · -28.4%
Race, ethnicity, and origin ACS 2023
- Neighborhood character
- Predominantly White (85%)
- Race & ethnicity
- White 85% Hispanic / Latino 9% Two or more races 8% Asian 2% Black 1%
- Hispanic origin (detail)
- Mexican 4% Puerto Rican 2%
- Common ancestry
- Romanian 4% Scotch-Irish 3% Lithuanian 2%
- Foreign-born
- 9% · Canada, Dominican Republic, China
- Languages at home
- 88% English-only · Spanish 7% Other Indo-European 2% Russian/Polish/Slavic 2%
Political lean MEDSL · Dutchess
- 2024 margin
- Lean D (+5.4) · D 52.7% · R 47.3%
- 2008→2024 swing
- -3.2pp toward R · 2008: 8.6pp · 2024: 5.4pp
- All cycles
- 2024: D+5.4 2020: D+9.6 2016: R+1.1 2012: D+6.6 2008: D+8.6
Not yet ingested
- Civics
- —
Market trends
- HPI YoY
- ▼ -5.13%
- Current HPI
- 249.8789
- Rent YoY
- —
- Metro
- —
- State GDP YoY
- ▲ 2.60%
- F500 in state
- 92
Industry mix (Fortune 500 HQ in NY)
| Industry | F500 HQs | Revenue |
|---|---|---|
| Financial Services | 10 | $950B |
|
||
| Consumer Goods | 9 | $162B |
|
||
| Insurance | 4 | $225B |
|
||
| Telecommunications | 2 | $144B |
|
||
| Pharmaceuticals | 2 | $112B |
|
||
| Media / Entertainment | 2 | $69B |
|
||
Price history
+2.9% since first listed3 events — show timeline
- 2026-05-06 Listed $359,000 OneKey® MLS as Distributed by MLS Grid
- 2026-03-30 Listing Removed — OneKey® MLS as Distributed by MLS Grid
- 2026-02-26 Listed $349,000 OneKey® MLS as Distributed by MLS Grid
Property tax history
+2.3%/yrLatest (2025): $4,429 · +1.9% YoY. Source: county tax records.
Cash-flow waterfall
monthlySold comps — $/sqft
last 12 mo · ≤1 miLoading sold comps…