1019 Angel St · Josephine, TX
Flood risk 1/10 · Minimal
- FEMA flood zone
- X (unshaded)
- Chance of flooding over 30 yrs
- 0.0%
- Est. flood insurance / yr
- $507 – $1,088
Fire risk 3/10 · Minor
- Est. fire insurance / yr
- $1,222 – $2,270
Heat risk 8/10 · Major
- Hot days now (above 110°F)
- 7 days/yr
- Hot days in 30 yrs
- 23 days/yr
Wind risk 6/10 · Moderate
- Chance of severe wind over 30 yrs
- 27.0%
Air-quality risk 2/10 · Minimal
- Unhealthy air days now
- 1 days/yr
- Unhealthy air days in 30 yrs
- 1 days/yr
Risk factors via First Street. Map © Google.
Why this score? — see what drove the D- grade
The composite is a weighted blend of 9 inputs, each scored 0–100. Each bar is that input's sub-score; the figure is the points it added to the 100-point composite (weight × sub-score).
- ARV discount +10.9/15.0
- Appreciation +10.0/10.0
- Cash flow +5.8/30.0
- Schools +3.2/10.0
- Livability +3.0/5.0
- Rent growth +2.5/5.0
- Condition / age +2.5/5.0
- 1% rule +1.4/10.0
- DSCR +0.2/10.0
$358,094
🖨 Deal sheet (PDF) 📄 Offer letter ✓ Due diligence
Listing remarks MLS
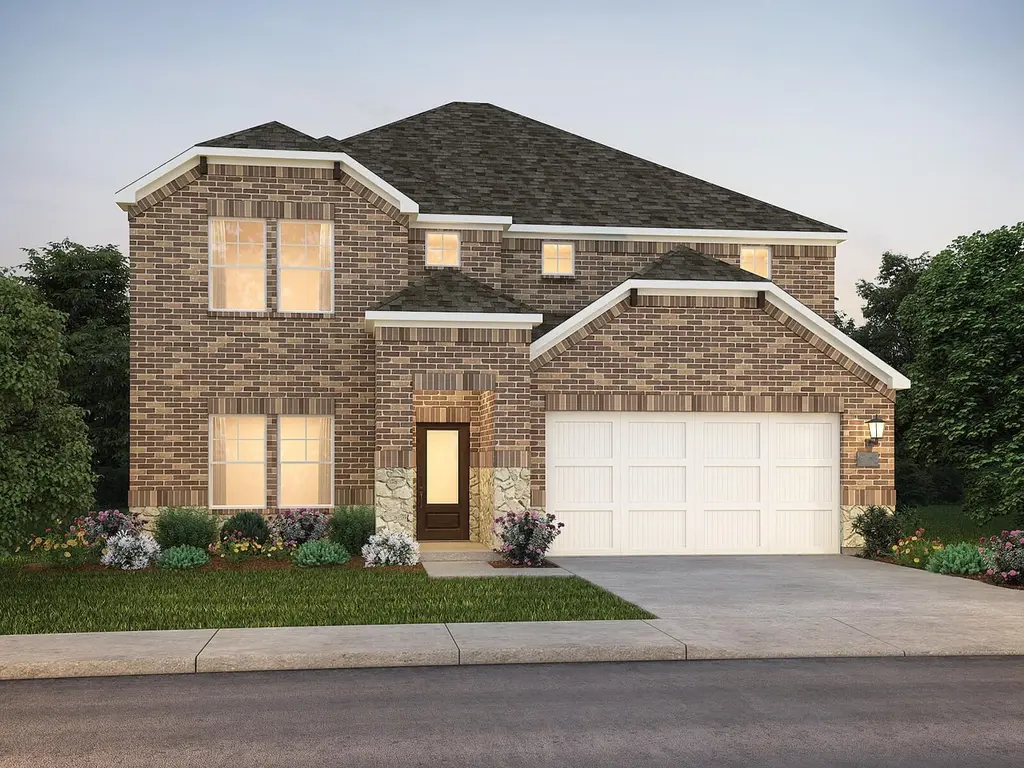
Skip the theater and enjoy movie night at home from the comfort of the Kessler's second-story game room. White cabinets with veined white quartz countertops, muted beige EVP flooring with light taupe carpet.
Key facts
- Whole home blinds
- White cabinets
- Light taupe carpet
Tags
Property features AI
Finance
- Other: Municipal utility district: No; Directions provided to property
- Financial info: Accepts Cash, Conventional, FHA, and VA financing; Treat as clear loan type; No second mortgage
- HOA & community: Mandatory association; Annual association fee of 600; Association covers grounds maintenance and management fees; HOA managed by Alamo Management
Exterior
- Parking: Attached garage with two covered spaces; Garage with 2-car single door and garage door opener
- Utilities: City water; City sewer; Low-flow fixtures
- Home design: Single family residence; Residential property; Two-story; New construction (incomplete, 2026); Smart home features included; Subdivision: Morgan Farms
- Construction: Brick, rock/stone, and vinyl siding exterior; Composition roof; Slab foundation; Year built 2026 (new construction - incomplete)
- Exterior features: Wood fencing; Community pool; Park
Interior
- Kitchen: Gas cooktop; Gas oven; Microwave; Dishwasher; Disposal; Refrigerator
- Bedrooms: Primary bedroom on level 1 (15 x 14); Bedroom on level 2 (12 x 12); Bedroom on level 2 (13 x 13); Bedroom on level 2 (12 x 12)
- Flooring: Carpet; Ceramic tile; Luxury vinyl plank
- Bathrooms: Three full bathrooms
- Heating & cooling: Electric heating; Heat pump
- Interior features: Cable TV available; High-speed internet available; Smart home system; Two living areas; One dining area; Seven total rooms; Two levels
- Laundry & utility: Washer; Dryer; Energy Star qualified heat pump
Neighborhood map
What this means for you Summary
Snapshot
- This is a 5-bed/3.0-bath single-family listed at $358k.
Deal economics
- At list price, monthly cash flow is $-717 ($-9k/yr) — negative.
- To cash-flow at today's rent, offer at most $254k (29.0% below list).
- To meet the 1% rule (rent ≥ 1% of price), the offer needs to be $229k (36.1% below list).
- Recommended offer: $229k (36.1% below list) — sets the bar for 1% rule.
Location & tenants
- Location reads 60/100 on livability (#1,076 in TX) — a middle-class / working-renter tenant base. Strengths: cost of living A+, housing A+, crime A-; Watch: amenities F, commute F, health & safety F.
- Community ISD (rural): math 30% / reading 38% proficiency, ranked #479 of 826 in TX (top 58%) — families likely to look elsewhere, expect single-tenant / working-renter base with shorter leases.
- Zoned schools: John & Barbara Roderick El (678 students, 52% FRL); Leland E Edge Middle (math 25% / reading 35%, grade F, #1,056 of 1,662 statewide, top 65%, 931 students, 53% FRL) — zoned schools average 52% FRL vs 36% district-wide (17 pts higher); higher-poverty schools than district average — tighter screening recommended.
- Market conditions: 421 active listings in the ZIP; 19,194 units permitted in Collin County in 2024 (3,988 in 5+ unit buildings).
Forward outlook
- In year one you build about $38k of equity ($2k loan paydown + $36k appreciation (10.0% local appreciation)).
- Collin County population projected at +60% by 2050 — long-run rental-demand tailwind backs the buy-and-hold thesis.
- By year 2, paydown + projected appreciation supports a ~$62k cash-out refi (75% LTV) — recoverable capital for the next deal without selling this one.
Negotiation context
- It's been on market 20 days — a 2% lower offer ($353k) is reasonable based on typical stale-listing flexibility.
- 3 sale attempts; this cycle's ask has dropped $20k (5%) from the opening price — seller is motivated, your offer sets the floor, not the list.
Risks & watch-outs
- Climate carrying-cost: major wind risk, 27% chance of damaging wind over 30y; extreme-heat days projected 7→23/yr by 2055 (HVAC capex compounding) — expect insurance premiums to compound above CPI over the hold.
Questions for the listing agent
- What do current leases actually rent for vs. the listed asking? Can we see a recent rent roll and the last 12 months of T-12 income?
- What does the HOA fee cover, when was the last increase, and are there any pending special assessments or reserve-fund shortfalls?
- Is there a deadline driving the sale (1031 exchange, divorce, estate, relocation)? That informs how much negotiation room exists.
- Schools are F-rated, which usually means shorter tenancies and higher turnover. Who's the typical renter profile here, and what's been the actual vacancy rate?
- The area grade is low — what's the realistic commute time and amenity access for the typical tenant pool here? Any planned neighborhood developments (good or bad) we should know about?
- What's the average days-on-market for RENTAL listings here right now (not sales)? A rising rental-DOM trend means longer vacancies and softer asking-rent achievability than the comps imply.
- What's the recent tenant-quality profile in this submarket — average credit score on applications, eviction rate, late-payment / NSF rate, and stable-employment percentage? A property-management company in the area should have these aggregated.
- How much new for-sale + rental construction is in the pipeline within 1–3 miles? Heavy new supply typically softens prices + rents 12–24 months out; constrained supply supports both.
Investment metrics
- 1% rule
- 0.64% ✗
- Cap rate
- 3.89%
- Cash-on-cash
- -8.58%
- DSCR
- 0.62
- GRM
- 13.0
CMA / ARV
- ARV (median comp)
- $386,913
- List price
- $358,094
- Delta
- -2.28%
- Verdict
- FAIR
- Comps
- 20 within 1.0 mi
Show comp detail 2 sales within ~0.75 mi
| Address | Dist | Beds/Ba | Sqft | Sold | Price | $/sf | Match |
|---|---|---|---|---|---|---|---|
| 911 Lexington Ln | 0.42mi | 5/3.0 | 2,722 (-11%) | 23mo | $358,990 | $132 | 43 |
| 314 Timber Ridge Dr | 0.51mi | 4/2.0 (-1) | 2,630 (-14%) | 3mo | $471,900 | $179 | 42 |
Match score weights: distance 35% · size 25% · config 20% · recency 20%. Top-matched comps best support the ARV.
Projected returns pro-forma
10.0% appreciation · 3.0% rent growth · sell at horizon
- IRR
- 18.2%
- Equity multiple
- 2.49×
- Total profit
- $149,441
- Equity at exit
- $322,599
- IRR
- 17.0%
- Equity multiple
- 5.75×
- Total profit
- $476,110
- Equity at exit
- $695,698
Cash invested: $100,266 (down + closing). Projections, not guarantees.
Landlord ↔ Tenant lean methodology
- Overall (STATE)
- 87 Strongly Landlord-Friendly
- State Texas
- 87 Strongly Landlord-Friendly · R+5
- County
- — inherits STATE
- City
- — inherits STATE
ZIP-level market 75173
- Home prices YoY
- 3.1%
- Active inventory
- 421
- Price-to-rent
- 13.0×
Monthly cashflow live
- Estimated rent
- $2,289 medium interval (Pro) →
- Mortgage (P&I)
- −$1,878
- Tax est. 1.5%
- −$448 /mo · $5,371/yr
- Insurance
- −$149
- HOA
- −$50
- Vacancy / Maint / Mgmt
- −$481
- Net cashflow
- $-717
Break-even live
Sensitivity live
| Price | -10% $-469 | -5% $-593 | +0% $-717 | +5% $-841 | +10% $-964 |
|---|---|---|---|---|---|
| Rent | -10% $-898 | -5% $-807 | +0% $-717 | +5% $-626 | +10% $-536 |
| Rate | -1.0pp $-536 | -0.5pp $-626 | base $-717 | +0.5pp $-810 | +1.0pp $-904 |
UW: 25.0% down · 7.5% · 30yr · 1.5% tax · 5.0% vac · 8.0% maint · 8.0% mgmt
Financing live
Cash to close
- Down payment
- $89,524
- Closing costs
- $10,743
- Reserves months
- —
- Total cash needed
- —
Loan-product check · same deal, 3 products live
Conventional
25% down · 7.5% · 30yr
- Down + closing
- —
- Monthly P&I
- —
- Monthly cashflow
- —
- DSCR
- —
- Eligible?
- —
Personal DTI + credit; lowest rate.
DSCR
20% down · 8.5% · 30yr
- Down + closing
- —
- Monthly P&I
- —
- Monthly cashflow
- —
- DSCR
- —
- Eligible?
- —
No personal income docs; deal must DSCR.
Hard money
10% down · 12.0% · 12mo
- Down + closing
- —
- Monthly P&I
- —
- Monthly cashflow
- —
- DSCR
- —
- Eligible?
- —
Short-term bridge; refi at stabilization.
HOA detail
- Monthly dues
- $50 · $600/yr
Listing history 19 events
-
2026-06-21days on market $358,094 Active 20 DOM
-
2026-06-18days on market $358,094 Active 17 DOM
-
2026-06-17days on market $358,094 Active 16 DOM
-
2026-06-16days on market $358,094 Active 15 DOM
-
2026-06-15days on market $358,094 Active 14 DOM
-
2026-06-13days on market $358,094 Active 12 DOM
-
2026-06-13days on market $358,094 Active 11 DOM
-
2026-06-09days on market $358,094 Active 8 DOM
-
2026-06-08days on market $358,094 Active 7 DOM
-
2026-06-07days on market $358,094 Active 6 DOM
-
2026-06-04days on market $358,094 Active 3 DOM
-
2026-06-03days on market $358,094 Active 2 DOM
-
2026-06-02remarks 599-char remark
Show marketing remark (207 chars)
Skip the theater and enjoy movie night at home from the comfort of the Kessler's second-story game room. White cabinets with veined white quartz countertops, muted beige EVP flooring with light taupe carpet.
-
2026-06-02pricedays on market $358,094 Active 1 DOM
Show marketing remark (207 chars)
Skip the theater and enjoy movie night at home from the comfort of the Kessler's second-story game room. White cabinets with veined white quartz countertops, muted beige EVP flooring with light taupe carpet.
-
2026-06-01days on market $378,094 Active 18 DOM
-
2026-05-31days on market $378,094 Active 17 DOM
-
2026-05-14$378,094 Active 207-char remark
Show marketing remark (207 chars)
Skip the theater and enjoy movie night at home from the comfort of the Kessler's second-story game room. White cabinets with veined white quartz countertops, muted beige EVP flooring with light taupe carpet.
-
2026-05-07$378,094 Active
-
2026-05-07historical
ⓘ Source: listings_history table (triggers on properties + properties_extension) + one-shot
backfill from property_details.listing_events for pre-trigger history.
Climate risk First Street
- Flood 1/10 Low FEMA zone X (unshaded) · 0% chance over 30 yrs
- Wildfire 3/10 Moderate
- Heat 8/10 Severe 7 d/yr ≥110°F today · 23 d/yr by 30 yrs out
- Wind 6/10 Major 27% chance of damaging wind over 30 yrs
- Air quality 2/10 Low 1 unhealthy d/yr today · 1 by 30 yrs out
Nearby sold comps map
Loading sold comps map…
Walkable amenities ~0.75 mi
Loading nearby amenities…
Taxation est. · year 1
- Rental income
- $27,462
- − Mortgage interest
- −$20,059
- − Property taxes
- −$5,371
- − Insurance
- −$1,790
- − Repairs & maintenance
- −$2,197
- − Management
- −$2,197
- − HOA
- −$600
- − Depreciation
- −$10,417
- Taxable loss
- −$15,170
- Est. tax savings @ 24.0%
- +$3,641
- After-tax cash flow
- $-4,961/yr
For passive investors: Depreciation is non-cash, so a rental often shows a tax loss while cash-flowing — sheltering income. Rental losses are passive: they offset passive income freely, and up to $25,000/yr can offset ordinary (W-2) income if you actively participate and your MAGI is under $100k (phasing out to $0 by $150k); unused losses carry forward. On sale, claimed depreciation is recaptured at up to 25%, and gains may owe capital-gains tax (a 1031 exchange can defer both). Figures are a year-1 estimate at your 24.0% rate — not tax advice; consult a CPA.
Schools (NCES district)
- District
- Community ISD
- NCES district ID
- 4814850
- Math proficiency
- 30% ▼ -23.00%
- Reading proficiency
- 38% ▼ -11.00%
- Median HH income
- $71,841
- Composite
- 31.58/100
- National rank
- #5951
- State rank
- #479 of 826 in TX
Livability — Josephine
- Score
- 60/100
- State rank
- #1076
- US rank
- #19105
Category grades
Schools grade is shown separately in the Schools card above.
Census & demographics
- Population (ZIP)
- 9,284
Population outlook (Collin County) Hauer SSP2
- Today (2025)
- 1,210,074 people
- By 2030
- 1,358,201 · +12.2%
- By 2040
- 1,654,061 · +36.7%
- By 2050
- 1,937,359 · +60.1%
- By 2075
- 2,567,039 · +112.1%
- By 2100
- 2,952,048 · +144.0%
Race, ethnicity, and origin ACS 2023
- Neighborhood character
- Majority White (65%)
- Race & ethnicity
- White 65% Hispanic / Latino 28% Two or more races 15% Black 2% Native American 1%
- Hispanic origin (detail)
- Mexican 26%
- Common ancestry
- Slovak 2% Serbian 1% Iranian 1%
- Foreign-born
- 17% · Canada, Jamaica
- Languages at home
- 74% English-only · Spanish 24% Arabic 1%
Political lean MEDSL · Collin
- 2024 margin
- R (+11.1) · D 43.1% · R 54.3% · Other 2.6%
- 2008→2024 swing
- +14.4pp toward D · 2008: -25.6pp · 2024: -11.1pp
- All cycles
- 2024: R+11.1 2020: R+4.3 2016: R+17.0 2012: R+31.6 2008: R+25.6
Not yet ingested
- Civics
- —
Market trends
- HPI YoY
- ▲ 10.09%
- Current HPI
- 331.12
- Rent YoY
- —
- Metro
- —
- State GDP YoY
- ▲ 3.95%
- F500 in state
- 110
Industry mix (Fortune 500 HQ in TX)
| Industry | F500 HQs | Revenue |
|---|---|---|
| Energy | 16 | $1,198B |
|
||
| Technology | 5 | $198B |
|
||
| Engineering / Construction | 4 | $72B |
|
||
| Energy Services | 3 | $60B |
|
||
| Utilities | 3 | $41B |
|
||
| Healthcare | 2 | $330B |
|
||
Price history
-5.3% since first listed5 events — show timeline
- 2026-06-02 Price Changed $358,094 Zillow
- 2026-05-14 Listed $378,094 Zillow
- 2026-05-08 Listed $358,094 NTREIS
- 2026-05-07 Listing Removed — NTREIS
- 2026-05-07 Listed $378,094 NTREIS
Cash-flow waterfall
monthlySold comps — $/sqft
last 12 mo · ≤1 miLoading sold comps…