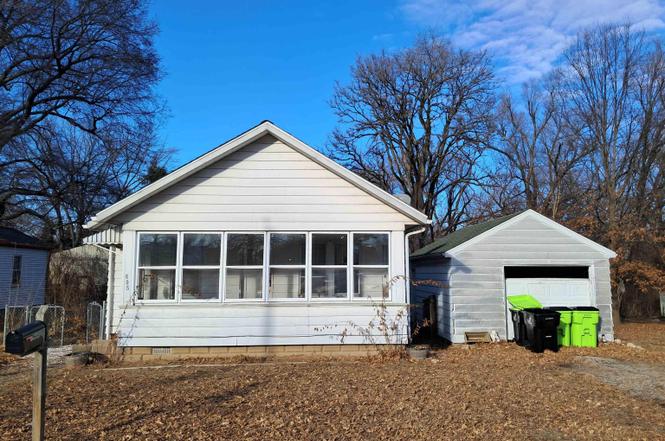
605 Franklin St · Bartonville, IL
Flood risk 1/10 · Minimal
- FEMA flood zone
- X
- Chance of flooding over 30 yrs
- 0.0%
- Est. flood insurance / yr
- $473 – $860
Fire risk 1/10 · Minimal
- Est. fire insurance / yr
- $804 – $1,492
Heat risk 3/10 · Minor
- Hot days now (above 105°F)
- 7 days/yr
- Hot days in 30 yrs
- 17 days/yr
Wind risk 2/10 · Minimal
- Chance of severe wind over 30 yrs
- 1.0%
Air-quality risk 2/10 · Minimal
- Unhealthy air days now
- 1 days/yr
- Unhealthy air days in 30 yrs
- 3 days/yr
Risk factors via First Street. Map © Google.
Why this score? — see what drove the B grade
The composite is a weighted blend of 9 inputs, each scored 0–100. Each bar is that input's sub-score; the figure is the points it added to the 100-point composite (weight × sub-score).
- Cash flow +30.0/30.0
- ARV discount +13.5/15.0
- DSCR +10.0/10.0
- 1% rule +9.0/10.0
- Livability +3.1/5.0
- Schools +2.9/10.0
- Rent growth +2.5/5.0
- Condition / age +2.5/5.0
- Appreciation +0.0/10.0
$65,000
🖨 Deal sheet 📄 Offer letter ✓ Due diligence
Listing remarks
Cute 2-bedroom home for someone to fix it up and make it their own or turn it into a rental. Massive office area on upper floor and plenty of space in the basement, there's lots of potential. Newer central air makes one less thing for you to worry with when the summer months arrive. THIS HOME IS A SHORT SALE, AND OFFERS WILL NEED TO BE BANK APPROVED.
Key facts
- 8,580 sq ft lot
- Garage
- Built 1940
Property features AI
Exterior
- Parking: Detached 1-car garage
- Utilities: Public water; Public sewer
- Home design: Single family residence; Built in 1940
- Construction: Shingle roof; Building area approx. 816 (total)
- Exterior features: Level lot; Lot dimensions approximately 65 x 132
Interior
- Kitchen: Kitchen on main level — approx. 11' x 8'
- Bedrooms: Two bedrooms on the main level (each with egress window) — approx. 11' x 10' and 10' x 10'
- Flooring: Hardwood flooring in bedrooms, dining room and other main areas; Laminate flooring in the kitchen; Other flooring in living room and upper-level office
- Bathrooms: Two full bathrooms and one half bathroom
- Heating & cooling: Central air conditioning; Forced air heating; Gas water heater
- Interior features: One fireplace; Full unfinished basement with egress window
Neighborhood map
What this means for you Summary
Snapshot
- This is a 2-bed/1.0-bath single-family listed at $65k.
Deal economics
- At list price, monthly cash flow is $270 ($3k/yr) — positive.
- The deal already cash-flows at list — no discount required.
- Meets the 1% rule at list price ($910 rent vs $65k).
- Recommended offer: $57k (12.0% below list) — sets the bar for market timing.
- Cap rate 11.3% vs local median 3.6% in Bartonville — top-decile yield for the area; either an underpriced asset or a hidden risk that comps aren't pricing in. Stress-test before assuming the spread holds.
Location & tenants
- Location reads 62/100 on livability (#840 in IL) — a middle-class / working-renter tenant base. Strengths: cost of living A+, housing A+; Watch: crime D+, amenities F, commute F.
- Limestone Chsd 310 (rural): math 25% / reading 35% proficiency, ranked #486 of 919 in IL (top 53%) — families likely to look elsewhere, expect single-tenant / working-renter base with shorter leases.
- Zoned schools: Limestone Community High School (math 17% / reading 22%, grade F, #397 of 693 statewide, top 61%, 924 students, 0% FRL).
- Market conditions: 51 active listings in the ZIP; 2 comparable units currently listed for rent nearby; 73 units permitted in Peoria County in 2024 (0 in 5+ unit buildings).
Forward outlook
- Local home prices are declining (-3.0%/yr); year-one equity from $449 of loan paydown is wiped out by about $2k of value loss. Plan a longer hold.
- Peoria County population projected at -11% by 2050 — secular population decline; favor cash flow + early exit over multi-decade hold.
- At projected returns (-3.0% appreciation + 3.0% rent growth), your $18k cash investment doubles in ~7 years — after that, you're playing with house money.
Negotiation context
- It's been on market 167 days — a 12% lower offer ($57k) is reasonable based on typical stale-listing flexibility.
- 3 sale attempts since 23y ago; this cycle's ask has dropped $15k (19%) from the opening price — seller is motivated, your offer sets the floor, not the list.
Risks & watch-outs
- Watch-outs: built in 1940 — expect roof / HVAC / electrical / plumbing capex.
Questions for the listing agent
- It's been on market 167 days. Have you received any prior offers? Is the seller open to a 12% concession, seller financing, or rate buy-down credit?
- Built in 1940 — when were the roof, HVAC, electrical panel, plumbing, and water heater last replaced?
- Why hasn't it sold? Are there any deal-killer items the seller is aware of (foundation, flood, title, zoning, code violations)?
- Is there a deadline driving the sale (1031 exchange, divorce, estate, relocation)? That informs how much negotiation room exists.
- Schools are D-rated, which usually means shorter tenancies and higher turnover. Who's the typical renter profile here, and what's been the actual vacancy rate?
- Crime grade is D in this area — have there been break-ins, vandalism, or insurance claims at this property in the last 3 years? What carrier currently insures it and at what premium?
- What's the average days-on-market for RENTAL listings here right now (not sales)? A rising rental-DOM trend means longer vacancies and softer asking-rent achievability than the comps imply.
- What's the recent tenant-quality profile in this submarket — average credit score on applications, eviction rate, late-payment / NSF rate, and stable-employment percentage? A property-management company in the area should have these aggregated.
- How much new for-sale + rental construction is in the pipeline within 1–3 miles? Heavy new supply typically softens prices + rents 12–24 months out; constrained supply supports both.
Investment metrics
- 1% rule
- 1.40% ✓
- Cap rate
- 11.28%
- Cash-on-cash
- 17.80%
- DSCR
- 1.79
- GRM
- 6.0
CMA / ARV
- ARV (on-the-fly)
- $75,072
- Comps found
- 12
Show comp detail 12 sales within ~0.75 mi
| Address | Dist | Beds/Ba | Sqft | Sold | Price | $/sf | Match |
|---|---|---|---|---|---|---|---|
| 104 Lawndale Ave | 0.10mi | 2/1.0 | 866 (+6%) | 2mo | $60,000 | $69 | 83 |
| 601 W Franklin Ave | 0.02mi | 2/2.0 | 882 (+8%) | 1mo | $46,000 | $52 | 81 |
| 426 W Garfield Ave | 0.06mi | 2/1.0 | 908 (+11%) | 12mo | $80,000 | $88 | 68 |
| 118 W Mcclure Ave | 0.24mi | 2/1.5 | 836 (+2%) | 18mo | $50,000 | $60 | 68 |
| 504 W Franklin Ave | 0.07mi | 1/1.0 (-1) | 880 (+8%) | 15mo | $32,500 | $37 | 66 |
| 404 Bird Ave | 0.26mi | 2/1.0 | 720 (-12%) | 12mo | $70,500 | $98 | 59 |
| 210 Anna St | 0.18mi | 2/1.0 | 910 (+12%) | 17mo | $83,500 | $92 | 58 |
| 207 E Rose St | 0.37mi | 3/1.0 (+1) | 920 (+13%) | 17mo | $128,900 | $140 | 42 |
| 103 Amsler St | 0.71mi | 2/1.0 | 728 (-11%) | 19mo | $91,000 | $125 | 33 |
| 16 Hialeah Dr | 0.71mi | 3/1.0 (+1) | 925 (+13%) | 9mo | $125,000 | $135 | 32 |
| 4809 Pershing Ave | 0.74mi | 2/1.0 | 720 (-12%) | 23mo | $82,500 | $115 | 27 |
| 21 Hialeah Dr | 0.74mi | 2/2.0 | 925 (+13%) | 24mo | $65,000 | $70 | 19 |
Match score weights: distance 35% · size 25% · config 20% · recency 20%. Top-matched comps best support the ARV.
Projected returns pro-forma
-3.0% appreciation · 3.0% rent growth · sell at horizon
- IRR
- 9.3%
- Equity multiple
- 1.37×
- Total profit
- $6,673
- Equity at exit
- $9,692
- IRR
- 18.5%
- Equity multiple
- 2.54×
- Total profit
- $28,005
- Equity at exit
- $5,620
Cash invested: $18,200 (down + closing). Projections, not guarantees.
Landlord ↔ Tenant lean methodology
- Overall (STATE)
- 43 Moderately Tenant-Leaning
- State Illinois
- 43 Moderately Tenant-Leaning · D+7
- County
- — inherits STATE
- City
- — inherits STATE
ZIP-level market 61607
- Home prices YoY
- -27.1%
- Active inventory
- 51
- Price-to-rent
- 6.0×
Monthly cashflow live
- Estimated rent
- $910 medium interval (Pro) →
- Mortgage (P&I)
- −$341
- Tax est. 1.5%
- −$81 /mo · $975/yr
- Insurance
- −$27
- HOA
- −$0
- Vacancy / Maint / Mgmt
- −$191
- Net cashflow
- $270
Break-even live
UW: 25.0% down · 7.5% · 30yr · 1.5% tax · 5.0% vac · 8.0% maint · 8.0% mgmt
Financing live
Cash to close
- Down payment
- $16,250
- Closing costs
- $1,950
- Reserves months
- —
- Total cash needed
- —
Loan-product check · same deal, 3 products live
Conventional
25% down · 7.5% · 30yr
- Down + closing
- —
- Monthly P&I
- —
- Monthly cashflow
- —
- DSCR
- —
- Eligible?
- —
Personal DTI + credit; lowest rate.
DSCR
20% down · 8.5% · 30yr
- Down + closing
- —
- Monthly P&I
- —
- Monthly cashflow
- —
- DSCR
- —
- Eligible?
- —
No personal income docs; deal must DSCR.
Hard money
10% down · 12.0% · 12mo
- Down + closing
- —
- Monthly P&I
- —
- Monthly cashflow
- —
- DSCR
- —
- Eligible?
- —
Short-term bridge; refi at stabilization.
Rent comps 2 comps
| Address | Beds | Baths | Sqft | Rent | $/sqft | DOM | Units | Dist |
|---|---|---|---|---|---|---|---|---|
| 5817 S Adams St Bartonville, IL | 2.0 | 1.0 | 768 | $975 | $1.27 | 13d | 1 | 0.47mi |
| 2807 W Nevada St Peoria, IL | 1.0 | 1.0 | 540 | $629 | $1.16 | 21d | 1 | 1.44mi |
Listing history 32 events
-
2026-06-19days on market $65,000 Under Contract 167 DOM
-
2026-06-18days on market $65,000 Under Contract 166 DOM
-
2026-06-17days on market $65,000 Under Contract 165 DOM
-
2026-06-16days on market $65,000 Under Contract 164 DOM
-
2026-06-15days on market $65,000 Under Contract 163 DOM
-
2026-06-14days on market $65,000 Under Contract 161 DOM
-
2026-06-13days on market $65,000 Under Contract 160 DOM
-
2026-06-10days on market $65,000 Under Contract 158 DOM
-
2026-06-09days on market $65,000 Under Contract 157 DOM
-
2026-06-08days on market $65,000 Under Contract 156 DOM
-
2026-06-07days on market $65,000 Under Contract 155 DOM
-
2026-06-03days on market $65,000 Under Contract 151 DOM
-
2026-06-02days on market $65,000 Under Contract 150 DOM
-
2026-06-01days on market $65,000 Under Contract 149 DOM
-
2026-05-31days on market $65,000 Under Contract 148 DOM
-
2026-05-30days on market $65,000 Under Contract 147 DOM
-
2026-04-30historical Under Contract
-
2026-04-24price $65,000
-
2026-03-10price $70,000
-
2026-01-03$79,900 Active
-
2025-12-17historical
-
2025-11-20historical $79,900
-
2025-11-13historical
-
2025-10-01historical
-
2021-08-06historical
-
2021-08-06historical
-
2011-03-23soldstatus $88,000
-
2011-03-22soldstatus $88,000
-
2011-01-04$90,000
-
2003-12-16soldstatus $70,000
-
2003-12-15soldstatus $70,000
-
2003-10-10$74,900
ⓘ Source: listings_history table (triggers on properties + properties_extension) + one-shot
backfill from property_details.listing_events for pre-trigger history.
Climate risk First Street
- Flood 1/10 Low FEMA zone X · 0% chance over 30 yrs
- Wildfire 1/10 Low
- Heat 3/10 Moderate 7 d/yr ≥105°F today · 17 d/yr by 30 yrs out
- Wind 2/10 Low 100% chance of damaging wind over 30 yrs
- Air quality 2/10 Low 1 unhealthy d/yr today · 3 by 30 yrs out
Nearby sold comps map
Loading sold comps map…
Walkable amenities ~0.75 mi
Loading nearby amenities…
Taxation est. · year 1
- Rental income
- $10,924
- − Mortgage interest
- −$3,641
- − Property taxes
- −$975
- − Insurance
- −$325
- − Repairs & maintenance
- −$874
- − Management
- −$874
- − Depreciation
- −$1,891
- Taxable income
- $2,344
- Est. tax owed @ 24.0%
- −$563
- After-tax cash flow
- $2,677/yr
For passive investors: Depreciation is non-cash, so a rental often shows a tax loss while cash-flowing — sheltering income. Rental losses are passive: they offset passive income freely, and up to $25,000/yr can offset ordinary (W-2) income if you actively participate and your MAGI is under $100k (phasing out to $0 by $150k); unused losses carry forward. On sale, claimed depreciation is recaptured at up to 25%, and gains may owe capital-gains tax (a 1031 exchange can defer both). Figures are a year-1 estimate at your 24.0% rate — not tax advice; consult a CPA.
Schools (NCES district)
- District
- Limestone Chsd 310
- NCES district ID
- 1722950
- Math proficiency
- 25% ▲ 5.00%
- Reading proficiency
- 35% ▲ 4.00%
- Median HH income
- $49,759
- Composite
- 28.99/100
- National rank
- #11932
- State rank
- #486 of 919 in IL
Livability — Bartonville
- Score
- 62/100
- State rank
- #840
- US rank
- #16553
Category grades
Schools grade is shown separately in the Schools card above.
Census & demographics
- Census place
- Bartonville, IL
- Population (ZIP)
- 10,734
Population outlook (Peoria County) Hauer SSP2
- Today (2025)
- 183,007 people
- By 2030
- 179,643 · -1.8%
- By 2040
- 171,782 · -6.1%
- By 2050
- 163,508 · -10.7%
- By 2075
- 140,178 · -23.4%
- By 2100
- 114,493 · -37.4%
Race, ethnicity, and origin ACS 2023
- Neighborhood character
- Predominantly White (91%)
- Race & ethnicity
- White 91% Two or more races 4% Black 2% Hispanic / Latino 2% Asian 2%
- Common ancestry
- Romanian 2% Italian 2% Portuguese 2%
- Foreign-born
- 1%
- Languages at home
- 98% English-only · Vietnamese 1% Tagalog/Filipino 1%
Political lean MEDSL · Peoria
- 2024 margin
- Toss-up / Even · D 51.5% · R 46.9% · Other 1.6%
- 2008→2024 swing
- -9.2pp toward R · 2008: 13.9pp · 2024: 4.7pp
- All cycles
- 2024: D+4.7 2020: D+6.3 2016: D+2.8 2012: D+4.4 2008: D+13.9
Not yet ingested
- Civics
- —
Market trends
- HPI YoY
- ▼ -71.81%
- Current HPI
- 193.6234
- Rent YoY
- —
- Metro
- —
- State GDP YoY
- ▲ 1.59%
- F500 in state
- 60
Industry mix (Fortune 500 HQ in IL)
| Industry | F500 HQs | Revenue |
|---|---|---|
| Insurance | 4 | $201B |
|
||
| Consumer Goods | 4 | $87B |
|
||
| Industrial Machinery | 3 | $64B |
|
||
| Healthcare | 2 | $55B |
|
||
| Retail / Pharmacy | 1 | $148B |
|
||
| Agriculture / Food | 1 | $86B |
|
||
Price history
-13.2% since first listed16 events — show timeline
- 2026-04-30 Contingent — RMLSA as Distributed by MLS Grid
- 2026-04-24 Price Changed $65,000 RMLSA as Distributed by MLS Grid
- 2026-03-10 Price Changed $70,000 RMLSA as Distributed by MLS Grid
- 2026-01-03 Listed $79,900 RMLSA as Distributed by MLS Grid
- 2025-12-17 Listing Removed — MRED as Distributed by MLS Grid
- 2025-11-20 Coming Soon $79,900 RMLSA as Distributed by MLS Grid
- 2025-11-13 Listing Removed — RMLSA as Distributed by MLS Grid
- 2025-10-01 Coming Soon — RMLSA as Distributed by MLS Grid
- 2021-08-06 Listing Removed — RMLSA as Distributed by MLS Grid
- 2021-08-06 Listing Removed — RMLSA as Distributed by MLS Grid
- 2011-03-23 Sold (MLS) $88,000 RMLSA as Distributed by MLS Grid
- 2011-03-22 Sold (Public Records) $88,000 Public Records
- 2011-01-04 Listed $90,000 RMLSA as Distributed by MLS Grid
- 2003-12-16 Sold (Public Records) $70,000 Public Records
- 2003-12-15 Sold (MLS) $70,000 RMLSA as Distributed by MLS Grid
- 2003-10-10 Listed $74,900 RMLSA as Distributed by MLS Grid
Property tax history
+4.7%/yrLatest (2024): $3,317 · +5.9% YoY. Source: county tax records.
Cash-flow waterfall
monthlySold comps — $/sqft
last 12 mo · ≤1 miLoading sold comps…