1219 S 13th St · Nederland, TX
Flood risk 7/10 · Major
- FEMA flood zone
- X
- Chance of flooding over 30 yrs
- 0.6%
- Est. flood insurance / yr
- $507 – $1,088
Fire risk 1/10 · Minimal
- Est. fire insurance / yr
- $1,222 – $2,270
Heat risk 9/10 · Severe
- Hot days now (above 110°F)
- 7 days/yr
- Hot days in 30 yrs
- 24 days/yr
Wind risk 9/10 · Severe
- Chance of severe wind over 30 yrs
- 99.0%
Air-quality risk 2/10 · Minimal
- Unhealthy air days now
- 1 days/yr
- Unhealthy air days in 30 yrs
- 1 days/yr
Risk factors via First Street. Map © Google.
Why this score? — see what drove the C+ grade
The composite is a weighted blend of 9 inputs, each scored 0–100. Each bar is that input's sub-score; the figure is the points it added to the 100-point composite (weight × sub-score).
- Cash flow +19.7/30.0
- ARV discount +15.0/15.0
- DSCR +6.2/10.0
- 1% rule +6.0/10.0
- Rent growth +4.8/5.0
- Schools +4.5/10.0
- Livability +3.8/5.0
- Condition / age +2.5/5.0
- Appreciation +0.0/10.0
$115,000
🖨 Deal sheet 📄 Offer letter ✓ Due diligence
Listing remarks MLS
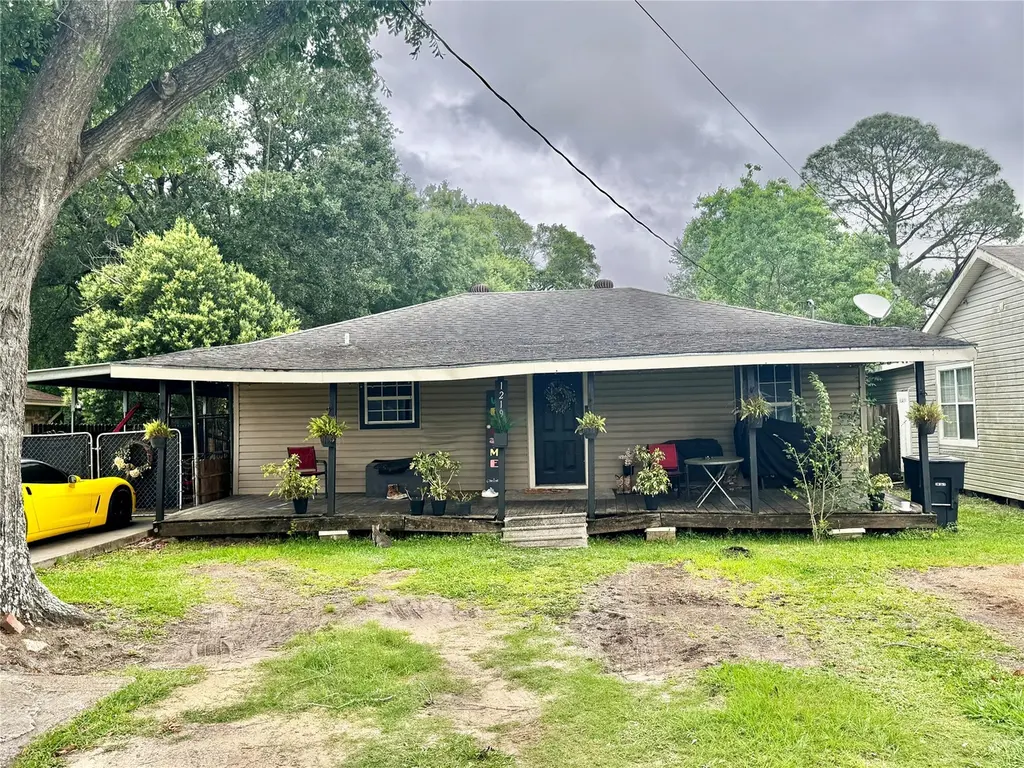
Enjoy the large covered front porch and attached carport that extends the length of the home. Could park 2 cars tandem. Fully fenced yard, laundry room off the covered carport. Owners added on some at rear of home.
Key facts
- Covered front porch
- Attached carport
- Laundry room
Tags
Property features AI
Finance
- Financial info: Lease not considered
Exterior
- Parking: Attached carport; Carport with 2 spaces
- Utilities: Public water; Public sewer; Asphalt road access
- Home design: Residential property; Built in 1978; Pillar/post/pier foundation
- Construction: Vinyl siding; Composition roof
- Exterior features: Covered patio; Patio; Deck; Private yard; Back yard fence; Storage shed(s)
Interior
- Kitchen: Dishwasher; Free-standing range (gas oven); Oven
- Bedrooms: Primary bedroom on the first floor (12 x 11); Bedroom on the first floor (11 x 11)
- Flooring: Carpet; Vinyl
- Bathrooms: 1 full bathroom
- Heating & cooling: Central heating (gas); Central air (electric)
- Interior features: Ceiling fan(s)
- Laundry & utility: Washer hookup; Electric dryer hookup; Utility room on the first floor (4 x 9)
Neighborhood map
What this means for you Summary
Snapshot
- This is a 2-bed/1.0-bath single-family listed at $115k.
Deal economics
- At list price, monthly cash flow is $68 ($811/yr) — positive.
- The deal already cash-flows at list — no discount required.
- Meets the 1% rule at list price ($1k rent vs $115k).
- Recommended offer: $112k (3.0% below list) — sets the bar for market timing.
- Cap rate 7.7% vs local median 4.6% in Nederland — top-decile yield for the area; either an underpriced asset or a hidden risk that comps aren't pricing in. Stress-test before assuming the spread holds.
Location & tenants
- Location reads 75/100 on livability (#129 in TX, #3,906 nationally) — a middle-class / working-renter tenant base. Strengths: employment A+, cost of living A+, housing A+; Watch: amenities F, commute F.
- Nederland ISD (suburban): math 51% / reading 52% proficiency, ranked #138 of 826 in TX (top 17%) — acceptable for families but not a draw, mixed tenant base, ~2y average lease.
- Zoned schools: Highland Park El (math 52% / reading 52%, grade C-, #742 of 4,322 statewide, top 19%, 432 students, 54% FRL); Central Middle (math 42% / reading 47%, grade D, #491 of 1,662 statewide, top 31%, 721 students, 55% FRL); Nederland H S (math 49% / reading 61%, grade C, #373 of 1,632 statewide, top 23%, 1,439 students, 47% FRL).
- Market conditions: Rents rising fast (+9.3%/yr); 111 active listings in the ZIP; 15 comparable units currently listed for rent nearby; rentals at typical pace (median 23d on market — plan ~3-4 weeks tenant-placement turnaround); 40% of comp listings sitting > 30 days — soft ceiling on asking rent; solid renter incomes; 343 units permitted in Jefferson County in 2024 (0 in 5+ unit buildings).
Forward outlook
- Local home prices are declining (-3.0%/yr); year-one equity from $795 of loan paydown is wiped out by about $3k of value loss. Plan a longer hold.
- At projected returns (-3.0% appreciation + 8.0% rent growth), your $32k cash investment doubles in ~10 years — after that, you're playing with house money.
Negotiation context
- It's been on market 51 days — a 3% lower offer ($112k) is reasonable based on typical stale-listing flexibility.
- 2 sale attempts with the ask held roughly flat each time — persistent listings suggest the price (not the market) is what's stuck; bring a comps-based counter.
Risks & watch-outs
- Watch-outs: flood insurance adds $66/mo.
- Climate carrying-cost: major flood risk; severe wind risk, 99% chance of damaging wind over 30y; extreme-heat days projected 7→24/yr by 2055 (HVAC capex compounding) — expect insurance premiums to compound above CPI over the hold.
Questions for the listing agent
- It's been on market 51 days. Have you received any prior offers? Is the seller open to a 3% concession, seller financing, or rate buy-down credit?
- Built in 1978 — when were the roof, HVAC, electrical panel, plumbing, and water heater last replaced?
- What's the actual annual flood-insurance premium (NFIP or private), and is the property in a SFHA with mandatory coverage?
- Is there a deadline driving the sale (1031 exchange, divorce, estate, relocation)? That informs how much negotiation room exists.
- Schools are A-rated — typically a magnet for longer-tenancy family renters. What's the average tenant stay here, and is there a school-zone premium baked into asking?
- What's the average days-on-market for RENTAL listings here right now (not sales)? A rising rental-DOM trend means longer vacancies and softer asking-rent achievability than the comps imply.
- What's the recent tenant-quality profile in this submarket — average credit score on applications, eviction rate, late-payment / NSF rate, and stable-employment percentage? A property-management company in the area should have these aggregated.
- How much new for-sale + rental construction is in the pipeline within 1–3 miles? Heavy new supply typically softens prices + rents 12–24 months out; constrained supply supports both.
Investment metrics
- 1% rule
- 1.10% ✓
- Cap rate
- 7.69%
- Cash-on-cash
- 4.99%
- DSCR
- 1.22
- GRM
- 7.6
CMA / ARV
- ARV (median comp)
- $142,839
- List price
- $115,000
- Delta
- -19.49%
- Verdict
- UNDERPRICED
- Comps
- 18 within 1.0 mi
Show comp detail 1 sale within ~0.75 mi
| Address | Dist | Beds/Ba | Sqft | Sold | Price | $/sf | Match |
|---|---|---|---|---|---|---|---|
| 807 S 12th St | 0.31mi | 2/1.0 | 960 (+11%) | 12mo | $79,900 | $83 | 57 |
Match score weights: distance 35% · size 25% · config 20% · recency 20%. Top-matched comps best support the ARV.
Projected returns pro-forma
-3.0% appreciation · 8.0% rent growth · sell at horizon
- IRR
- -6.0%
- Equity multiple
- 0.77×
- Total profit
- $-7,542
- Equity at exit
- $17,147
- IRR
- 9.5%
- Equity multiple
- 1.93×
- Total profit
- $29,830
- Equity at exit
- $9,943
Cash invested: $32,200 (down + closing). Projections, not guarantees.
Landlord ↔ Tenant lean methodology
- Overall (STATE)
- 87 Strongly Landlord-Friendly
- State Texas
- 87 Strongly Landlord-Friendly · R+5
- County
- — inherits STATE
- City
- — inherits STATE
ZIP-level market 77627
- Rents YoY
- 9.3%
- Active inventory
- 111
- Price-to-rent
- 7.6×
Monthly cashflow live
- Estimated rent
- $1,265 high interval (Pro) →
- Mortgage (P&I)
- −$603
- Tax from tax record
- −$215 /mo · $2,576/yr
- Insurance
- −$48
- Flood insurance flood zone
- −$66 /mo · $798/yr
- HOA
- −$0
- Vacancy / Maint / Mgmt
- −$266
- Net cashflow
- $68
Break-even live
UW: 25.0% down · 7.5% · 30yr · 1.5% tax · 5.0% vac · 8.0% maint · 8.0% mgmt
Financing live
Cash to close
- Down payment
- $28,750
- Closing costs
- $3,450
- Reserves months
- —
- Total cash needed
- —
Loan-product check · same deal, 3 products live
Conventional
25% down · 7.5% · 30yr
- Down + closing
- —
- Monthly P&I
- —
- Monthly cashflow
- —
- DSCR
- —
- Eligible?
- —
Personal DTI + credit; lowest rate.
DSCR
20% down · 8.5% · 30yr
- Down + closing
- —
- Monthly P&I
- —
- Monthly cashflow
- —
- DSCR
- —
- Eligible?
- —
No personal income docs; deal must DSCR.
Hard money
10% down · 12.0% · 12mo
- Down + closing
- —
- Monthly P&I
- —
- Monthly cashflow
- —
- DSCR
- —
- Eligible?
- —
Short-term bridge; refi at stabilization.
Rent comps 15 comps
| Address | Beds | Baths | Sqft | Rent | $/sqft | DOM | Units | Dist |
|---|---|---|---|---|---|---|---|---|
| 1619 Avenue G Unit G Nederland, TX | 3.0 | 1.5 | 1100 | $1,750 | $1.59 | 23d | 1 | 0.45mi |
| 1924 Avenue H Unit H Nederland, TX | 2.0 | 1.0 | 900 | $1,000 | $1.11 | 43d | 1 | 0.55mi |
| 812 S 6th St Nederland, TX | 3.0 | 1.0 | 996 | $1,500 | $1.51 | 13d | 1 | 0.63mi |
| 1003 Avenue B Nederland, TX | 1.0–2.0 | 1.0 | 726 | $1,050 | $1.45 | 13d | 7 | 0.64mi |
| 2604 Avenue C Unit C Nederland, TX | 3.0 | 2.0 | 1008 | $1,795 | $1.78 | 43d | 1 | 1.03mi |
| 608 S 2nd St Nederland, TX | 3.0 | 1.0 | 936 | $1,600 | $1.71 | 13d | 1 | 1.04mi |
| 209 N 22nd St Unit 1 Nederland, TX | 2.0 | 1.0 | 900 | $1,100 | $1.22 | 43d | 1 | 1.04mi |
| 531 S 28th St Unit B Nederland, TX | 1.0 | 1.0 | 600 | $750 | $1.25 | 13d | 1 | 1.07mi |
| 531 S 28th St Unit B Nederland, TX | 1.0 | 1.0 | 660 | $750 | $1.14 | 23d | 1 | 1.07mi |
| 7901 Heatherbrook Trl Unit 57 Port Arthur, TX | 2.0 | 1.0 | 988 | $1,425 | $1.44 | 13d | 1 | 1.21mi |
| 7901 Heatherbrook Trl Apt 3 Port Arthur, TX | 1.0 | 1.0 | 812 | $1,325 | $1.63 | 43d | 1 | 1.24mi |
| 7901 Heatherbrook Trl Unit 190 Port Arthur, TX | 2.0 | 1.0 | 988 | $1,425 | $1.44 | 21d | 1 | 1.24mi |
| 303 Hardy Ave Unit 3 Nederland, TX | 1.0 | 1.0 | 700 | $850 | $1.21 | 43d | 1 | 1.25mi |
| 1820 Helena Ave Nederland, TX | 2.0 | 1.0 | 820 | $1,150 | $1.40 | 43d | 1 | 1.35mi |
| 1820 Helena Ave Nederland, TX | 2.0 | 1.0 | 840 | $1,100 | $1.31 | 13d | 1 | 1.35mi |
Listing history 18 events
-
2026-06-18days on market $115,000 Active 51 DOM
-
2026-06-17days on market $115,000 Active 50 DOM
-
2026-06-16days on market $115,000 Active 49 DOM
-
2026-06-15days on market $115,000 Active 48 DOM
-
2026-06-14days on market $115,000 Active 46 DOM
-
2026-06-13days on market $115,000 Active 45 DOM
-
2026-06-10days on market $115,000 Active 43 DOM
-
2026-06-09days on market $115,000 Active 42 DOM
-
2026-06-08days on market $115,000 Active 41 DOM
-
2026-06-07days on market $115,000 Active 40 DOM
-
2026-06-05days on market $115,000 Active 37 DOM
-
2026-06-03days on market $115,000 Active 36 DOM
-
2026-06-02days on market $115,000 Active 35 DOM
-
2026-06-01days on market $115,000 Active 34 DOM
-
2026-05-31days on market $115,000 Active 33 DOM
-
2026-05-30days on market $115,000 Active 32 DOM
-
2026-04-28$115,000 Active 389-char remark
Show marketing remark (214 chars)
Enjoy the large covered front porch and attached carport that extends the length of the home. Could park 2 cars tandem. Fully fenced yard, laundry room off the covered carport. Owners added on some at rear of home.
-
2026-04-28$115,000 Active 390-char remark
Show marketing remark (214 chars)
Enjoy the large covered front porch and attached carport that extends the length of the home. Could park 2 cars tandem. Fully fenced yard, laundry room off the covered carport. Owners added on some at rear of home.
ⓘ Source: listings_history table (triggers on properties + properties_extension) + one-shot
backfill from property_details.listing_events for pre-trigger history.
Tax reassessment forecast TX · Resets to sale price
- Current annual tax
- $2,576 · $215/mo
- Projected year-2 tax
- $2,576 · $215/mo
- Expected delta
- $0/yr ($0/mo · 0.0%)
ⓘ Screening estimate from a state-policy table — verify with the county assessor before closing.
Climate risk First Street
- Flood 7/10 Severe FEMA zone X · 60% chance over 30 yrs
- Wildfire 1/10 Low
- Heat 9/10 Extreme 7 d/yr ≥110°F today · 24 d/yr by 30 yrs out
- Wind 9/10 Extreme 99% chance of damaging wind over 30 yrs
- Air quality 2/10 Low 1 unhealthy d/yr today · 1 by 30 yrs out
Nearby sold comps map
Loading sold comps map…
Walkable amenities ~0.75 mi
Loading nearby amenities…
Taxation est. · year 1
- Rental income
- $15,184
- − Mortgage interest
- −$6,442
- − Property taxes
- −$2,576
- − Insurance
- −$1,372
- − Repairs & maintenance
- −$1,215
- − Management
- −$1,215
- − Depreciation
- −$3,345
- Taxable loss
- −$980
- Est. tax savings @ 24.0%
- +$235
- After-tax cash flow
- $1,046/yr
For passive investors: Depreciation is non-cash, so a rental often shows a tax loss while cash-flowing — sheltering income. Rental losses are passive: they offset passive income freely, and up to $25,000/yr can offset ordinary (W-2) income if you actively participate and your MAGI is under $100k (phasing out to $0 by $150k); unused losses carry forward. On sale, claimed depreciation is recaptured at up to 25%, and gains may owe capital-gains tax (a 1031 exchange can defer both). Figures are a year-1 estimate at your 24.0% rate — not tax advice; consult a CPA.
Schools (NCES district)
- District
- Nederland ISD
- NCES district ID
- 4832280
- Math proficiency
- 51% ▼ -3.00%
- Reading proficiency
- 52% ▼ -3.00%
- Median HH income
- $59,647
- Composite
- 44.95/100
- National rank
- #2709
- State rank
- #138 of 826 in TX
Livability — Nederland
- Score
- 75/100
- State rank
- #129
- US rank
- #3906
Category grades
Schools grade is shown separately in the Schools card above.
Census & demographics
- Census place
- Nederland, TX
- County
- Jefferson County · 203,592 people
- City population
- 22,357
- Metro
- Beaumont-Port Arthur, TX
- Population (ZIP)
- 22,357
- Household income
- $78,001
- Rent vs Own
- Severe rent burden
- 572.0
Population outlook (Jefferson County) Hauer SSP2
- Today (2025)
- 259,015 people
- By 2030
- 260,685 · +0.6%
- By 2040
- 263,309 · +1.7%
- By 2050
- 265,237 · +2.4%
- By 2075
- 270,193 · +4.3%
- By 2100
- 255,628 · -1.3%
Race, ethnicity, and origin ACS 2023
- Neighborhood character
- Predominantly White (78%)
- Race & ethnicity
- White 78% Hispanic / Latino 12% Two or more races 8% Black 4% Asian 3%
- Hispanic origin (detail)
- Mexican 8%
- Common ancestry
- Lithuanian 10% Slovak 3% Italian 2%
- Foreign-born
- 5% · Canada, Vietnam
- Languages at home
- 87% English-only · Spanish 8% Other Indo-European 1% Vietnamese 1%
Political lean MEDSL · Jefferson
- 2024 margin
- Lean R (+8.9) · D 45.1% · R 54.0%
- 2008→2024 swing
- -11.1pp toward R · 2008: 2.2pp · 2024: -8.9pp
- All cycles
- 2024: R+8.9 2020: R+1.6 2016: R+0.5 2012: D+1.6 2008: D+2.2
Not yet ingested
- Civics
- —
Market trends
- HPI YoY
- ▼ -228.91%
- Current HPI
- 176.2132
- Rent YoY
- ▲ 9.27%
- Metro
- Beaumont-Port Arthur, TX
- State GDP YoY
- ▲ 3.95%
- F500 in state
- 110
Industry mix (Fortune 500 HQ in TX)
| Industry | F500 HQs | Revenue |
|---|---|---|
| Energy | 16 | $1,198B |
|
||
| Technology | 5 | $198B |
|
||
| Engineering / Construction | 4 | $72B |
|
||
| Energy Services | 3 | $60B |
|
||
| Utilities | 3 | $41B |
|
||
| Healthcare | 2 | $330B |
|
||
Price history
+0.0% since first listed2 events — show timeline
- 2026-04-28 Listed $115,000 HARMLS
- 2026-04-28 Listed $115,000 BBOR
Property tax history
+4.7%/yrLatest (2025): $2,576 · -2.3% YoY. Source: county tax records.
Cash-flow waterfall
monthlySold comps — $/sqft
last 12 mo · ≤1 miLoading sold comps…