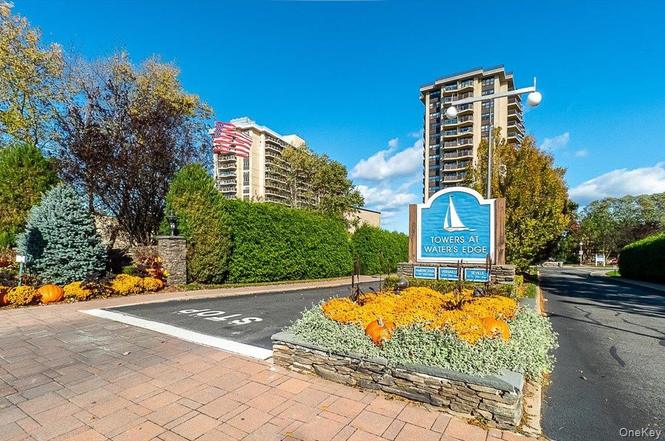
18-05 215th St Unit 8C · New York, NY
Flood risk 4/10 · Minor
- FEMA flood zone
- X (unshaded)
- Chance of flooding over 30 yrs
- 0.13%
- Est. flood insurance / yr
- $507 – $1,088
Fire risk 1/10 · Minimal
- Est. fire insurance / yr
- $691 – $1,283
Heat risk 6/10 · Moderate
- Hot days now (above 98°F)
- 7 days/yr
- Hot days in 30 yrs
- 15 days/yr
Wind risk 6/10 · Moderate
- Chance of severe wind over 30 yrs
- 27.0%
Air-quality risk 4/10 · Minor
- Unhealthy air days now
- 6 days/yr
- Unhealthy air days in 30 yrs
- 6 days/yr
Risk factors via First Street. Map © Google.
Why this score? — see what drove the D+ grade
The composite is a weighted blend of 9 inputs, each scored 0–100. Each bar is that input's sub-score; the figure is the points it added to the 100-point composite (weight × sub-score).
- Cash flow +13.0/30.0
- ARV discount +7.5/15.0
- Appreciation +6.6/10.0
- Schools +5.0/10.0
- 1% rule +4.0/10.0
- DSCR +3.9/10.0
- Livability +3.8/5.0
- Rent growth +2.5/5.0
- Condition / age +2.5/5.0
$289,900
🖨 Deal sheet 📄 Offer letter ✓ Due diligence
Listing remarks
Welcome to worry-free living in this chic and modern 1 bedroom/ 1 bath co-op in the prestigious Waters Edge /Versailles building, on the 8th floor with great water, Bridge and city view from private terrace This unit offers a sophisticated layout with a cheery and bright exposure and central air/heat throughout. But the real value is in the monthly savings: Maintenance $1339 includes ALL utilities plus assessments. Say goodbye to your Con Edison bill! Enjoy the ultimate full-service lifestyle with a 24-hour doorman, a fully-equipped on-site gym, and a sparkling swimming pool for supreme summer relaxation, Indoor Garage parking for a fee of $190/m. The building defines convenience with its
Key facts
- Central air heat
- Garage
- Community pool
Tags
Property features AI
Finance
- HOA & community: Fitness center; Playground; Pool; Tennis courts
Exterior
- Parking: Assigned parking; Garage with 1 space
- Utilities: Public sewer; Electricity connected; Water connected; Natural gas available
- Home design: Stock cooperative; 17 total stories; Entry level: 8
- Construction: Brick construction
- Exterior features: Outdoor space; Pool/Spa; Waterfront location
Interior
- Kitchen: Gas range; Refrigerator
- Bedrooms: 3 rooms total (includes bedroom(s) on entry level 8)
- Bathrooms: 1 full bathroom
- Heating & cooling: Central air conditioning; Natural gas heating
- Interior features: First-floor bedroom; Elevator access; Basement (see remarks)
- Laundry & utility: Utilities connected: electricity, water; Natural gas available
Neighborhood map
What this means for you Summary
Snapshot
- This is a 1-bed/1.0-bath condo listed at $290k.
Deal economics
- At list price, monthly cash flow is $-13 ($-159/yr) — negative.
- The deal already cash-flows at list — no discount required.
- To meet the 1% rule (rent ≥ 1% of price), the offer needs to be $261k (10.1% below list).
- Recommended offer: $255k (12.0% below list) — sets the bar for market timing.
- Cap rate 6.2% vs local median 2.6% in New York — top-decile yield for the area; either an underpriced asset or a hidden risk that comps aren't pricing in. Stress-test before assuming the spread holds.
Location & tenants
- Location reads 75/100 on livability (#268 in NY, #4,188 nationally) — a middle-class / working-renter tenant base. Strengths: amenities A+, commute A+, health & safety A; Watch: crime F, cost of living F.
- Market conditions: 219 active listings in the ZIP; 7 comparable units currently listed for rent nearby; rentals at typical pace (median 25d on market — plan ~3-4 weeks tenant-placement turnaround); solid renter incomes; 5,302 units permitted in Queens County in 2024 (4,918 in 5+ unit buildings).
- This rent runs 32% of the median local income ($99k/yr) — at the standard rent-burdened threshold; future hikes will face affordability resistance.
Forward outlook
- In year one you build about $11k of equity ($2k loan paydown + $9k appreciation (3.3% local appreciation)).
- Queens County population projected at +16% by 2050 — long-run rental-demand tailwind backs the buy-and-hold thesis.
- At projected returns (3.3% appreciation + 3.0% rent growth), your $81k cash investment doubles in ~6 years — after that, you're playing with house money.
- By year 4, paydown + projected appreciation supports a ~$39k cash-out refi (75% LTV) — recoverable capital for the next deal without selling this one.
Negotiation context
- It's been on market 137 days — a 12% lower offer ($255k) is reasonable based on typical stale-listing flexibility.
- 10 sale attempts since 14y ago with the ask held roughly flat each time — persistent listings suggest the price (not the market) is what's stuck; bring a comps-based counter.
- Current owner paid $245k; 18% above their basis — modest negotiation headroom, anchor on the comps not their cost.
Risks & watch-outs
- Climate carrying-cost: major wind risk, 27% chance of damaging wind over 30y; extreme-heat days projected 7→15/yr by 2055 (HVAC capex compounding) — expect insurance premiums to compound above CPI over the hold.
Questions for the listing agent
- What do current leases actually rent for vs. the listed asking? Can we see a recent rent roll and the last 12 months of T-12 income?
- It's been on market 137 days. Have you received any prior offers? Is the seller open to a 12% concession, seller financing, or rate buy-down credit?
- Built in 1966 — when were the roof, HVAC, electrical panel, plumbing, and water heater last replaced?
- What does the HOA fee cover, when was the last increase, and are there any pending special assessments or reserve-fund shortfalls?
- Any open or pending special assessments — roof, HVAC, plumbing, elevator, façade? What's the per-unit balance and payoff schedule, and is the seller paying it off at close or rolling it to the buyer?
- Why hasn't it sold? Are there any deal-killer items the seller is aware of (foundation, flood, title, zoning, code violations)?
- Is there a deadline driving the sale (1031 exchange, divorce, estate, relocation)? That informs how much negotiation room exists.
- Schools are B-rated — typically a magnet for longer-tenancy family renters. What's the average tenant stay here, and is there a school-zone premium baked into asking?
- Crime grade is F in this area — have there been break-ins, vandalism, or insurance claims at this property in the last 3 years? What carrier currently insures it and at what premium?
- The area grade is low — what's the realistic commute time and amenity access for the typical tenant pool here? Any planned neighborhood developments (good or bad) we should know about?
- What's the average days-on-market for RENTAL listings here right now (not sales)? A rising rental-DOM trend means longer vacancies and softer asking-rent achievability than the comps imply.
- What's the recent tenant-quality profile in this submarket — average credit score on applications, eviction rate, late-payment / NSF rate, and stable-employment percentage? A property-management company in the area should have these aggregated.
- How much new apartment / multifamily construction is in the pipeline within 1–3 miles? Heavy new supply (>2% of stock underway) typically softens rents 12–24 months out; light construction supports rent growth.
Investment metrics
- 1% rule
- 0.90% ✗
- Cap rate
- 6.24%
- Cash-on-cash
- -0.20%
- DSCR
- 0.99
- GRM
- 9.3
CMA / ARV
No comps found within radius.
Projected returns pro-forma
3.26% appreciation · 3.0% rent growth · sell at horizon
- IRR
- 8.1%
- Equity multiple
- 1.47×
- Total profit
- $38,160
- Equity at exit
- $134,608
- IRR
- 10.6%
- Equity multiple
- 2.63×
- Total profit
- $132,279
- Equity at exit
- $210,819
Cash invested: $81,172 (down + closing). Projections, not guarantees.
Landlord ↔ Tenant lean methodology
- Overall (CITY)
- 0 Strongly Tenant-Friendly
- State New York
- 15 Strongly Tenant-Friendly · D+10
- County
- — inherits STATE
- City New York
- 0 Strongly Tenant-Friendly · D+34
ZIP-level market 11360
- Home prices YoY
- 1.6%
- Active inventory
- 219
- Price-to-rent
- 9.3×
Monthly cashflow live
- Estimated rent
- $2,605 high interval (Pro) →
- Mortgage (P&I)
- −$1,520
- Tax est. 1.5%
- −$362 /mo · $4,348/yr
- Insurance
- −$121
- HOA est. from 1 same-building comp
- −$68
- Vacancy / Maint / Mgmt
- −$547
- Net cashflow
- $-13
Break-even live
UW: 25.0% down · 7.5% · 30yr · 1.5% tax · 5.0% vac · 8.0% maint · 8.0% mgmt
Financing live
Cash to close
- Down payment
- $72,475
- Closing costs
- $8,697
- Reserves months
- —
- Total cash needed
- —
Loan-product check · same deal, 3 products live
Conventional
25% down · 7.5% · 30yr
- Down + closing
- —
- Monthly P&I
- —
- Monthly cashflow
- —
- DSCR
- —
- Eligible?
- —
Personal DTI + credit; lowest rate.
DSCR
20% down · 8.5% · 30yr
- Down + closing
- —
- Monthly P&I
- —
- Monthly cashflow
- —
- DSCR
- —
- Eligible?
- —
No personal income docs; deal must DSCR.
Hard money
10% down · 12.0% · 12mo
- Down + closing
- —
- Monthly P&I
- —
- Monthly cashflow
- —
- DSCR
- —
- Eligible?
- —
Short-term bridge; refi at stabilization.
Rent comps 7 comps
| Address | Beds | Baths | Sqft | Rent | $/sqft | DOM | Units | Dist |
|---|---|---|---|---|---|---|---|---|
| 1670 Bell Blvd Bayside, NY | 2.0 | 1.0–1.5 | 600 | $2,600 | $4.33 | 2d | 4 | 0.07mi |
| 1785 215th St Unit 15J Bayside, NY | 1.0 | 1.0 | 620 | $3,500 | $5.65 | 24d | 1 | 0.09mi |
| 16-66 Bell Blvd Unit 736 Bayside, NY | — | 1.0 | 600 | $2,350 | $3.92 | 24d | 1 | 0.09mi |
| 16-05 Bell Blvd Unit 1st Floor Flushing, NY | 1.0 | 1.0 | 700 | $2,400 | $3.43 | 24d | 1 | 0.16mi |
| 206-14 Emily Rd Unit 42L Bayside, NY | 1.0 | 1.0 | 700 | $2,700 | $3.86 | 24d | 1 | 0.66mi |
| 29-04 204th St Unit 1Floor Flushing, NY | 1.0 | 1.0 | 700 | $2,600 | $3.71 | 19d | 1 | 1.01mi |
| 40-11 214th Pl Unit 2R Bayside, NY | 1.0 | 1.0 | 650 | $2,800 | $4.31 | 5d | 1 | 1.41mi |
HOA detail condo
- Monthly dues
- $0 · $0/yr
- Likely covers
- waterpoolgymdoorman
- Assessments
- None detected in remarks — confirm with the listing agent.
Listing history 37 events
-
2026-06-18days on market $289,900 Active 137 DOM
-
2026-06-17days on market $289,900 Active 136 DOM
-
2026-06-15days on market $289,900 Active 134 DOM
-
2026-06-13days on market $289,900 Active 132 DOM
-
2026-06-10days on market $289,900 Active 128 DOM
-
2026-06-08days on market $289,900 Active 127 DOM
-
2026-06-04remarks 699-char remark
-
2026-06-04days on market $289,900 Active 123 DOM
-
2026-06-03days on market $289,900 Active 122 DOM
-
2026-06-01days on market $289,900 Active 120 DOM
-
2026-05-31days on market $289,900 Active 119 DOM
-
2026-02-01$289,900 Active
-
2025-03-26historical
-
2025-02-03price $335,000
-
2024-09-25$338,000 Active
-
2023-11-24historical $2,400
-
2023-11-23$2,400
-
2023-11-16historical $2,400
-
2023-10-21$2,400
-
2016-12-01historical
-
2016-09-08soldstatus $245,000
-
2016-09-08soldstatus $245,000 Closed
-
2016-05-19status Under Contract
-
2016-03-14$259,000 New
-
2016-03-14$259,000
-
2016-01-25historical
-
2016-01-20price $285,000
-
2015-11-30$329,000 New
-
2015-06-24$290,000
-
2013-10-29soldstatus $225,000 Closed
-
2013-10-29soldstatus $1,900
-
2013-04-24status Under Contract
-
2013-03-15price $245,000
-
2012-12-29price $249,000 Price Change
-
2012-06-15$259,000 New
-
2012-06-15$245,000
-
2007-05-01soldstatus $19,904,621
ⓘ Source: listings_history table (triggers on properties + properties_extension) + one-shot
backfill from property_details.listing_events for pre-trigger history.
Climate risk First Street
- Flood 4/10 Moderate FEMA zone X (unshaded) · 13% chance over 30 yrs
- Wildfire 1/10 Low
- Heat 6/10 Major 7 d/yr ≥98°F today · 15 d/yr by 30 yrs out
- Wind 6/10 Major 27% chance of damaging wind over 30 yrs
- Air quality 4/10 Moderate 6 unhealthy d/yr today · 6 by 30 yrs out
Nearby sold comps map
Loading sold comps map…
Walkable amenities ~0.75 mi
Loading nearby amenities…
Taxation est. · year 1
- Rental income
- $31,263
- − Mortgage interest
- −$16,239
- − Property taxes
- −$4,348
- − Insurance
- −$1,450
- − Repairs & maintenance
- −$2,501
- − Management
- −$2,501
- − HOA
- −$816
- − Depreciation
- −$8,433
- Taxable loss
- −$5,025
- Est. tax savings @ 24.0%
- +$1,206
- After-tax cash flow
- $1,047/yr
For passive investors: Depreciation is non-cash, so a rental often shows a tax loss while cash-flowing — sheltering income. Rental losses are passive: they offset passive income freely, and up to $25,000/yr can offset ordinary (W-2) income if you actively participate and your MAGI is under $100k (phasing out to $0 by $150k); unused losses carry forward. On sale, claimed depreciation is recaptured at up to 25%, and gains may owe capital-gains tax (a 1031 exchange can defer both). Figures are a year-1 estimate at your 24.0% rate — not tax advice; consult a CPA.
Schools (NCES district)
No district data.
Livability — New York
- Score
- 75/100
- State rank
- #268
- US rank
- #4188
Category grades
Schools grade is shown separately in the Schools card above.
Census & demographics
- Census place
- New York, NY
- County
- Queens County · 1,914,869 people
- City population
- 7,731,280
- Metro
- New York-Newark-Jersey City, NY-NJ-PA
- Population (ZIP)
- 19,469
- Household income
- $98,875
- Rent vs Own
- Severe rent burden
- 496.0
Population outlook (Queens County) Hauer SSP2
- Today (2025)
- 2,546,320 people
- By 2030
- 2,643,059 · +3.8%
- By 2040
- 2,815,563 · +10.6%
- By 2050
- 2,944,423 · +15.6%
- By 2075
- 3,123,338 · +22.7%
- By 2100
- 3,098,688 · +21.7%
Race, ethnicity, and origin ACS 2023
- Neighborhood character
- Diverse neighborhood (Simpson 0.60)
- Race & ethnicity
- White 54% Asian 29% Hispanic / Latino 12% Two or more races 6% Black 1%
- Hispanic origin (detail)
- Puerto Rican 3% Cuban 2% Dominican 2%
- Common ancestry
- Romanian 4% Scotch-Irish 3% Estonian 1%
- Foreign-born
- 33% · China, South Korea, Canada
- Languages at home
- 58% English-only · Chinese 14% Other Indo-European 11% Korean 8%
Political lean MEDSL · Queens
- 2024 margin
- Strong D (+24.6) · D 62.3% · R 37.7%
- 2008→2024 swing
- -26.2pp toward R · 2008: 50.8pp · 2024: 24.6pp
- All cycles
- 2024: D+24.6 2020: D+45.2 2016: D+53.4 2012: D+58.5 2008: D+50.8
Not yet ingested
- Civics
- —
Market trends
- HPI YoY
- ▲ 3.26%
- Current HPI
- 204.1422
- Rent YoY
- —
- Metro
- New York-Newark-Jersey City, NY-NJ-PA
- State GDP YoY
- ▲ 2.60%
- F500 in state
- 92
Industry mix (Fortune 500 HQ in NY)
| Industry | F500 HQs | Revenue |
|---|---|---|
| Financial Services | 10 | $950B |
|
||
| Consumer Goods | 9 | $162B |
|
||
| Insurance | 4 | $225B |
|
||
| Telecommunications | 2 | $144B |
|
||
| Pharmaceuticals | 2 | $112B |
|
||
| Media / Entertainment | 2 | $69B |
|
||
Price history
-98.5% since first listed26 events — show timeline
- 2026-02-01 Listed $289,900 OneKey® MLS as Distributed by MLS Grid
- 2025-03-26 Listing Removed — OneKey® MLS as Distributed by MLS Grid
- 2025-02-03 Price Changed $335,000 OneKey® MLS as Distributed by MLS Grid
- 2024-09-25 Listed $338,000 OneKey® MLS as Distributed by MLS Grid
- 2023-11-24 Rental Removed $2,400 ONEKEY
- 2023-11-23 Listed for Rent $2,400 ONEKEY
- 2023-11-16 Rental Removed $2,400 ONEKEY
- 2023-10-21 Listed for Rent $2,400 ONEKEY
- 2016-12-01 Listing Removed — OneKey® MLS as Distributed by MLS Grid
- 2016-09-08 Sold (MLS) $245,000 OneKey® MLS as Distributed by MLS Grid
- 2016-09-08 Sold (MLS) $245,000 MLSLI
- 2016-05-19 Pending — MLSLI
- 2016-03-14 Listed $259,000 MLSLI
- 2016-03-14 Listed $259,000 OneKey® MLS as Distributed by MLS Grid
- 2016-01-25 Listing Removed — OneKey® MLS as Distributed by MLS Grid
- 2016-01-20 Price Changed $285,000 OneKey® MLS as Distributed by MLS Grid
- 2015-11-30 Listed $329,000 OneKey® MLS as Distributed by MLS Grid
- 2015-06-24 Listed $290,000 OneKey® MLS as Distributed by MLS Grid
- 2013-10-29 Sold (MLS) $1,900 OneKey® MLS as Distributed by MLS Grid
- 2013-10-29 Sold (MLS) $225,000 MLSLI
- 2013-04-24 Pending — MLSLI
- 2013-03-15 Price Changed $245,000 MLSLI
- 2012-12-29 Price Changed $249,000 MLSLI
- 2012-06-15 Listed $259,000 MLSLI
- 2012-06-15 Listed $245,000 OneKey® MLS as Distributed by MLS Grid
- 2007-05-01 Sold (Public Records) $19,904,621 Public Records
Cash-flow waterfall
monthlySold comps — $/sqft
last 12 mo · ≤1 miLoading sold comps…