 Duplex
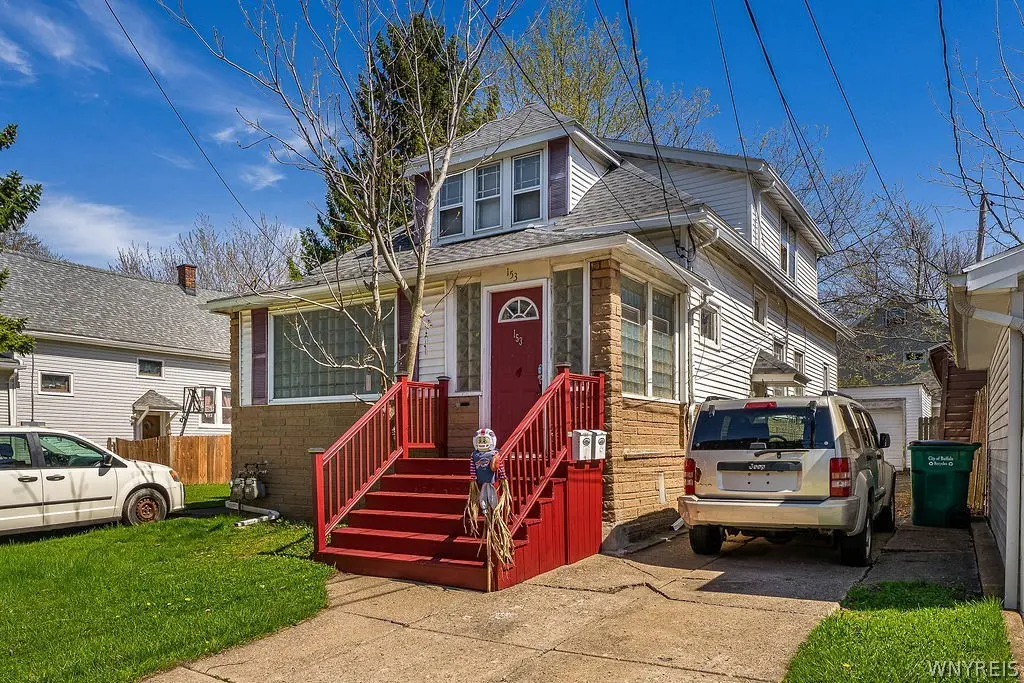
153 Columbus Ave · Buffalo, NY
Flood risk 2/10 · Minimal
- FEMA flood zone
- X (unshaded)
- Chance of flooding over 30 yrs
- 0.07%
- Est. flood insurance / yr
- $473 – $860
Fire risk 1/10 · Minimal
- Est. fire insurance / yr
- $691 – $1,283
Heat risk 3/10 · Minor
- Hot days now (above 92°F)
- 7 days/yr
- Hot days in 30 yrs
- 15 days/yr
Wind risk 1/10 · Minimal
- Chance of severe wind over 30 yrs
- —
Air-quality risk 4/10 · Minor
- Unhealthy air days now
- 3 days/yr
- Unhealthy air days in 30 yrs
- 8 days/yr
Risk factors via First Street. Map © Google.
Why this score? — see what drove the B grade
The composite is a weighted blend of 9 inputs, each scored 0–100. Each bar is that input's sub-score; the figure is the points it added to the 100-point composite (weight × sub-score).
- Cash flow +26.3/30.0
- ARV discount +15.0/15.0
- DSCR +8.9/10.0
- 1% rule +5.7/10.0
- Rent growth +4.4/5.0
- Livability +3.9/5.0
- Schools +3.3/10.0
- Condition / age +2.5/5.0
- Appreciation +0.0/10.0
$219,900
🖨 Deal sheet 📄 Offer letter ✓ Due diligence
Multi-family units
County records classify this as Multi-Family (2-4 Unit). Listing-text estimate: 2 units. confirmed
Listing remarks
Well-maintained 2-unit (upper/lower) home in South Buffalo offering strong owner-occupant or investment potential! Situated on a rare double lot, this property features two concrete driveways for ample off-street parking and a detached garage for additional storage or rental value. Each unit has separate utilities, making management simple and cost-efficient. The home is vinyl sided with a newer roof, helping minimize exterior maintenance. Inside, you’ll find hardwood floors and flexible layouts with multiple bonus rooms, offering the potential to expand bedroom count or create home offices, playrooms, or flex spaces. Conveniently located just minutes from Mercy Hospital, with easy ac
Key facts
- Vinyl sided
- Separate utilities
- Newer roof
Tags
Property features AI
Finance
- Financial info: Two-unit multi-family property with separate gas and electric meters for each unit; Rents: one unit at $850, the other at $925 (both month-to-month); Owner pays water; rent includes water; Operating expense details: see remarks
Exterior
- Parking: Detached garage with 1 space; Concrete parking with two or more spaces
- Utilities: Electricity connected (circuit breakers); Public water connected; Sewer connected; Cable available; High-speed internet available
- Home design: Two-story building; Resale property; Shingle roof; Vinyl siding (see remarks)
- Construction: Block and stone foundation; Built existing (year built details: existing)
- Exterior features: Partial fencing; Open porch; Patio/porch
Interior
- Kitchen: Oven/Range; Refrigerator; Eat-in kitchen; Formal dining room (in one unit)
- Bedrooms: Two 2-bedroom units (both month-to-month)
- Flooring: Carpet; Hardwood; Laminate; Tile; Varied flooring
- Bathrooms: Two full bathrooms (one in each unit)
- Heating & cooling: Gas forced-air heating
- Interior features: Leaded glass windows; Natural woodwork
- Laundry & utility: Laundry in unit (one unit); Gas water heater
Neighborhood map
What this means for you Summary
Snapshot
- This is a 2 × 2-bed/1.0-bath units multifamily listed at $220k.
Deal economics
- At list price, monthly cash flow is $568 ($7k/yr) — positive. Per door: $284/mo.
- The deal already cash-flows at list — no discount required.
- Meets the 1% rule at list price ($2k rent vs $220k).
- Recommended offer: $213k (3.0% below list) — sets the bar for market timing.
Location & tenants
- Location reads 77/100 on livability (#195 in NY, #3,011 nationally) — a middle-class / working-renter tenant base. Strengths: commute A+, housing A+, health & safety A+; Watch: crime F, employment D-.
- Buffalo City School District (urban): math 41% / reading 40% proficiency, ranked #535 of 590 in NY (top 91%) — families likely to look elsewhere, expect single-tenant / working-renter base with shorter leases; 75% free/reduced lunch — lower-income household profile, screen leases tightly.
- Market conditions: Rents rising fast (+7.6%/yr); 136 active listings in the ZIP; 2 comparable units currently listed for rent nearby; 1,244 units permitted in Erie County in 2024 (563 in 5+ unit buildings).
- This rent runs 40% of the median local income ($71k/yr) — at the standard rent-burdened threshold; future hikes will face affordability resistance.
Forward outlook
- Local home prices are declining (-3.0%/yr); year-one equity from $2k of loan paydown is wiped out by about $7k of value loss. Plan a longer hold.
- At projected returns (-3.0% appreciation + 7.6% rent growth), your $62k cash investment doubles in ~8 years — after that, you're playing with house money.
Negotiation context
- It's been on market 51 days — a 3% lower offer ($213k) is reasonable based on typical stale-listing flexibility.
- Current owner paid $32k; list at $220k implies a 587% gain — meaningful room to come down on a strong offer.
Risks & watch-outs
- Watch-outs: built in 1930 — expect roof / HVAC / electrical / plumbing capex.
Questions for the listing agent
- It's been on market 51 days. Have you received any prior offers? Is the seller open to a 3% concession, seller financing, or rate buy-down credit?
- Can we see the unit-by-unit rent roll, current vacancy, and any below-market leases? What's the average tenancy length?
- What capital expenditures (roof, boiler, parking lot, exteriors) have been made in the last 5 years, and what's planned in the next 2?
- Built in 1930 — when were the roof, HVAC, electrical panel, plumbing, and water heater last replaced?
- Is there a deadline driving the sale (1031 exchange, divorce, estate, relocation)? That informs how much negotiation room exists.
- Crime grade is F in this area — have there been break-ins, vandalism, or insurance claims at this property in the last 3 years? What carrier currently insures it and at what premium?
- What's the average days-on-market for RENTAL listings here right now (not sales)? A rising rental-DOM trend means longer vacancies and softer asking-rent achievability than the comps imply.
- What's the recent tenant-quality profile in this submarket — average credit score on applications, eviction rate, late-payment / NSF rate, and stable-employment percentage? A property-management company in the area should have these aggregated.
- How much new apartment / multifamily construction is in the pipeline within 1–3 miles? Heavy new supply (>2% of stock underway) typically softens rents 12–24 months out; light construction supports rent growth.
Investment metrics
- 1% rule
- 1.07% ✓
- Cap rate
- 9.39%
- Cash-on-cash
- 11.07%
- DSCR
- 1.49
- GRM
- 7.8
CMA / ARV
- ARV (median comp)
- $373,313
- List price
- $219,900
- Delta
- -41.09%
- Verdict
- UNDERPRICED
- Comps
- 20 within 1.0 mi
Show comp detail 12 sales within ~0.75 mi
| Address | Dist | Beds/Ba | Sqft | Sold | Price | $/sf | Match |
|---|---|---|---|---|---|---|---|
| 165 Lockwood Ave | 0.50mi | 4/3.0 | 1,865 (+2%) | 3mo | $195,000 | $105 | 68 |
| 183 Lockwood Ave | 0.47mi | 4/2.0 | 1,858 (+1%) | 12mo | $197,500 | $106 | 66 |
| 55 Harding Rd | 0.56mi | 4/2.0 | 1,844 (+0%) | 9mo | $275,000 | $149 | 66 |
| 16 Culver Rd | 0.61mi | 4/2.0 | 1,800 (-2%) | 7mo | $262,000 | $146 | 62 |
| 61 Princeton Pl | 0.56mi | 4/2.0 | 1,640 (-11%) | 1mo | $256,000 | $156 | 55 |
| 50 Kingston Pl | 0.53mi | 4/2.0 | 1,631 (-11%) | 1mo | $185,000 | $113 | 55 |
| 169 Altruria St | 0.50mi | 5/2.0 (+1) | 1,958 (+6%) | 8mo | $241,000 | $123 | 54 |
| 116 Melrose St | 0.55mi | 4/2.0 | 2,001 (+9%) | 8mo | $223,000 | $111 | 53 |
| 89 Melrose St | 0.50mi | 4/2.0 | 2,038 (+11%) | 7mo | $318,000 | $156 | 53 |
| 889 Tifft St | 0.44mi | 4/2.0 | 2,112 (+15%) | 4mo | $210,000 | $99 | 52 |
| 137 Lockwood Ave | 0.55mi | 5/2.0 (+1) | 1,936 (+5%) | 13mo | $204,000 | $105 | 50 |
| 70 Houston St | 0.69mi | 4/2.0 | 2,106 (+15%) | 11mo | $150,000 | $71 | 35 |
Match score weights: distance 35% · size 25% · config 20% · recency 20%. Top-matched comps best support the ARV.
Projected returns pro-forma
-3.0% appreciation · 7.62% rent growth · sell at horizon
- IRR
- 4.8%
- Equity multiple
- 1.19×
- Total profit
- $11,925
- Equity at exit
- $32,788
- IRR
- 17.8%
- Equity multiple
- 2.76×
- Total profit
- $108,360
- Equity at exit
- $19,013
Cash invested: $61,572 (down + closing). Projections, not guarantees.
Landlord ↔ Tenant lean methodology
- Overall (STATE)
- 15 Strongly Tenant-Friendly
- State New York
- 15 Strongly Tenant-Friendly · D+10
- County
- — inherits STATE
- City
- — inherits STATE
ZIP-level market 14220
- Home prices YoY
- -26.7%
- Rents YoY
- 7.6%
- Active inventory
- 136
- Price-to-rent
- 15.5×
Monthly cashflow live
- Estimated rent
- $2,358 high interval (Pro) →
- Mortgage (P&I)
- −$1,153
- Tax from tax record
- −$50 /mo · $598/yr
- Insurance
- −$92
- HOA
- −$0
- Vacancy / Maint / Mgmt
- −$495
- Net cashflow
- $568
Break-even live
2-unit breakdown (identical units grouped — click to expand)
| Units | Beds | Baths | Est. rent |
|---|---|---|---|
| 2× units | 2 | 1 | $2,358 |
| #1 | 2 | 1 | $1,179 |
| #2 | 2 | 1 | $1,179 |
| Total (2 units) | $2,358 | ||
UW: 25.0% down · 7.5% · 30yr · 1.5% tax · 5.0% vac · 8.0% maint · 8.0% mgmt
Financing live
Cash to close
- Down payment
- $54,975
- Closing costs
- $6,597
- Reserves months
- —
- Total cash needed
- —
Loan-product check · same deal, 3 products live
Conventional
25% down · 7.5% · 30yr
- Down + closing
- —
- Monthly P&I
- —
- Monthly cashflow
- —
- DSCR
- —
- Eligible?
- —
Personal DTI + credit; lowest rate.
DSCR
20% down · 8.5% · 30yr
- Down + closing
- —
- Monthly P&I
- —
- Monthly cashflow
- —
- DSCR
- —
- Eligible?
- —
No personal income docs; deal must DSCR.
Hard money
10% down · 12.0% · 12mo
- Down + closing
- —
- Monthly P&I
- —
- Monthly cashflow
- —
- DSCR
- —
- Eligible?
- —
Short-term bridge; refi at stabilization.
Rent comps 2 comps
| Address | Beds | Baths | Sqft | Rent | $/sqft | DOM | Units | Dist |
|---|---|---|---|---|---|---|---|---|
| 74 Woodside Ave Unit 1 Buffalo, NY | 3.0 | 1.0 | 1250 | $1,510 | $1.21 | 1d | 1 | 0.42mi |
| 89 Macamley St #2 Buffalo, NY | 3.0 | 1.0 | 1274 | $1,100 | $0.86 | 10d | 1 | 0.56mi |
Listing history 16 events
-
2026-06-18days on market $219,900 Active 51 DOM
-
2026-06-17days on market $219,900 Active 50 DOM
-
2026-06-16days on market $219,900 Active 49 DOM
-
2026-06-15days on market $219,900 Active 48 DOM
-
2026-06-13days on market $219,900 Active 46 DOM
-
2026-06-13days on market $219,900 Active 45 DOM
-
2026-06-10days on market $219,900 Active 43 DOM
-
2026-06-09days on market $219,900 Active 42 DOM
-
2026-06-08days on market $219,900 Active 41 DOM
-
2026-06-07days on market $219,900 Active 40 DOM
-
2026-06-03days on market $219,900 Active 36 DOM
-
2026-06-02days on market $219,900 Active 35 DOM
-
2026-06-01days on market $219,900 Active 34 DOM
-
2026-05-31days on market $219,900 Active 33 DOM
-
2026-04-28$219,900 Active 836-char remark
-
2000-09-25soldstatus $32,000
ⓘ Source: listings_history table (triggers on properties + properties_extension) + one-shot
backfill from property_details.listing_events for pre-trigger history.
Tax reassessment forecast NY · Partial reset (capped growth)
- Current annual tax
- $598 · $50/mo
- Projected year-2 tax
- $2,157 · $180/mo
- Expected delta
- +$1,559/yr (+$130/mo · 260.9%)
ⓘ Screening estimate from a state-policy table — verify with the county assessor before closing.
Climate risk First Street
- Flood 2/10 Low FEMA zone X (unshaded) · 7% chance over 30 yrs
- Wildfire 1/10 Low
- Heat 3/10 Moderate 7 d/yr ≥92°F today · 15 d/yr by 30 yrs out
- Wind 1/10 Low
- Air quality 4/10 Moderate 3 unhealthy d/yr today · 8 by 30 yrs out
Nearby sold comps map
Loading sold comps map…
Walkable amenities ~0.75 mi
Loading nearby amenities…
Taxation est. · year 1
- Rental income
- $28,296
- − Mortgage interest
- −$12,318
- − Property taxes
- −$598
- − Insurance
- −$1,100
- − Repairs & maintenance
- −$2,264
- − Management
- −$2,264
- − Depreciation
- −$6,397
- Taxable income
- $3,357
- Est. tax owed @ 24.0%
- −$806
- After-tax cash flow
- $6,013/yr
For passive investors: Depreciation is non-cash, so a rental often shows a tax loss while cash-flowing — sheltering income. Rental losses are passive: they offset passive income freely, and up to $25,000/yr can offset ordinary (W-2) income if you actively participate and your MAGI is under $100k (phasing out to $0 by $150k); unused losses carry forward. On sale, claimed depreciation is recaptured at up to 25%, and gains may owe capital-gains tax (a 1031 exchange can defer both). Figures are a year-1 estimate at your 24.0% rate — not tax advice; consult a CPA.
Schools (NCES district)
- District
- Buffalo City School District
- NCES district ID
- 3605850
- Math proficiency
- 41% ▲ 11.00%
- Reading proficiency
- 40% ▲ 7.00%
- Median HH income
- $31,665
- Composite
- 33.17/100
- National rank
- #5544
- State rank
- #535 of 590 in NY
Livability — Buffalo
- Score
- 77/100
- State rank
- #195
- US rank
- #3011
Category grades
Schools grade is shown separately in the Schools card above.
Census & demographics
- Census place
- Buffalo, NY
- County
- Erie County · 714,559 people
- City population
- 440,021
- Metro
- Buffalo-Cheektowaga, NY
- Population (ZIP)
- 24,428
- Household income
- $70,963
- Rent vs Own
- Severe rent burden
- 602.0
Population outlook (Erie County) Hauer SSP2
- Today (2025)
- 933,037 people
- By 2030
- 935,181 · +0.2%
- By 2040
- 928,531 · -0.5%
- By 2050
- 905,725 · -2.9%
- By 2075
- 834,037 · -10.6%
- By 2100
- 708,033 · -24.1%
Race, ethnicity, and origin ACS 2023
- Neighborhood character
- Predominantly White (76%)
- Race & ethnicity
- White 76% Hispanic / Latino 13% Two or more races 6% Black 5% Asian 2%
- Hispanic origin (detail)
- Puerto Rican 10% Cuban 1%
- Common ancestry
- Romanian 16% Lithuanian 1% Subsaharan African 1%
- Foreign-born
- 4% · Canada, Jamaica, China
- Languages at home
- 90% English-only · Spanish 4% Chinese 1%
Political lean MEDSL · Erie
- 2024 margin
- Lean D (+9.7) · D 54.8% · R 45.2%
- 2008→2024 swing
- -7.9pp toward R · 2008: 17.5pp · 2024: 9.7pp
- All cycles
- 2024: D+9.7 2020: D+14.7 2016: D+4.8 2012: D+15.6 2008: D+17.5
Not yet ingested
- Civics
- —
Market trends
- HPI YoY
- ▼ -146.29%
- Current HPI
- 402.5053
- Rent YoY
- ▲ 7.62%
- Metro
- Buffalo-Cheektowaga, NY
- State GDP YoY
- ▲ 2.60%
- F500 in state
- 92
Industry mix (Fortune 500 HQ in NY)
| Industry | F500 HQs | Revenue |
|---|---|---|
| Financial Services | 10 | $950B |
|
||
| Consumer Goods | 9 | $162B |
|
||
| Insurance | 4 | $225B |
|
||
| Telecommunications | 2 | $144B |
|
||
| Pharmaceuticals | 2 | $112B |
|
||
| Media / Entertainment | 2 | $69B |
|
||
Price history
+587.2% since first listed2 events — show timeline
- 2026-04-28 Listed $219,900 WNYREIS
- 2000-09-25 Sold (Public Records) $32,000 Public Records
Property tax history
+6.8%/yrLatest (2025): $598 · +2.5% YoY. Source: county tax records.
Cash-flow waterfall
monthlySold comps — $/sqft
last 12 mo · ≤1 miLoading sold comps…