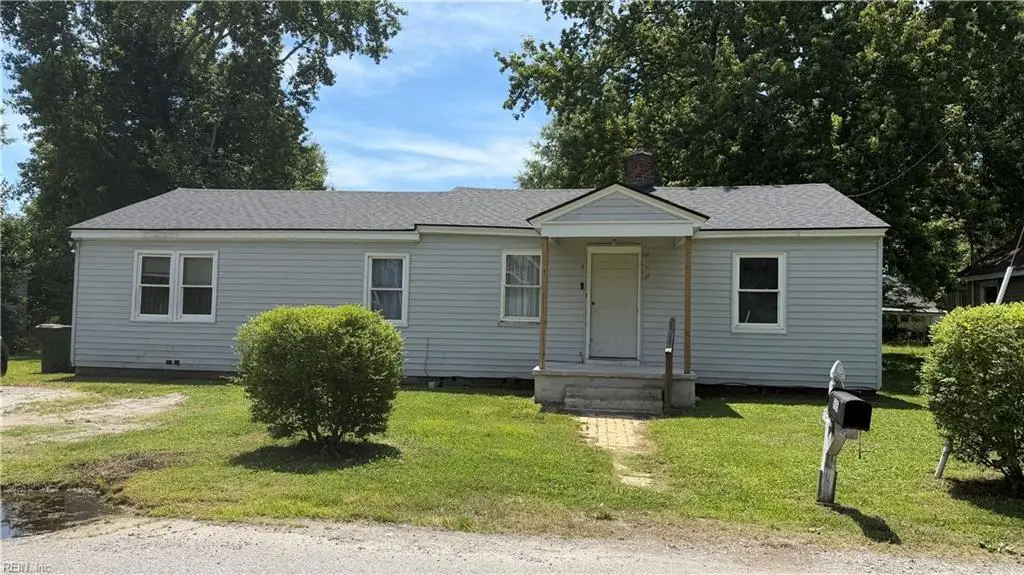
1005 Railroad Ave · Franklin, VA
Flood risk No data
- FEMA flood zone
- —
- Chance of flooding over 30 yrs
- —
- Est. flood insurance / yr
- —
Fire risk No data
- Est. fire insurance / yr
- —
Heat risk No data
- Hot days now (above threshold)
- —
- Hot days in 30 yrs
- —
Wind risk No data
- Chance of severe wind over 30 yrs
- —
Air-quality risk No data
- Unhealthy air days now
- —
- Unhealthy air days in 30 yrs
- —
Risk factors via First Street. Map © Google.
Why this score? — see what drove the B- grade
The composite is a weighted blend of 9 inputs, each scored 0–100. Each bar is that input's sub-score; the figure is the points it added to the 100-point composite (weight × sub-score).
- Cash flow +30.0/30.0
- 1% rule +10.0/10.0
- DSCR +10.0/10.0
- ARV discount +7.5/15.0
- Schools +3.0/10.0
- Livability +3.0/5.0
- Rent growth +2.5/5.0
- Condition / age +2.5/5.0
- Appreciation +0.0/10.0
$94,500
🖨 Deal sheet 📄 Offer letter ✓ Due diligence
Listing remarks
Calling all investors! This property is currently being utilized as a rental and presents an excellent investment opportunity. The interior is in need of some TLC, making it ideal for those looking to renovate and add value. Whether you're seeking a long-term rental to generate passive income or a flip project with resale potential, this property offers plenty of possibilities. Priced with investors in mind, this is a great opportunity to expand your portfolio and maximize your return on investment.
Key facts
- 8,712 sq ft lot
- Built 1958
- Listed 12 days
Property features AI
Finance
- HOA & community: No HOA fees indicated
Exterior
- Parking: Driveway parking; Street parking
- Utilities: City water; City sewer; Electric water heater
- Home design: Detached ranch; Single-story; Crawl foundation; Simple ownership
- Construction: Asphalt shingle roof
- Exterior features: Vinyl siding; City view; Covered porch
Interior
- Kitchen: Electric range
- Bedrooms: Master bedroom; Additional bedroom; Bedroom and full bathroom on the first floor
- Flooring: Ceramic flooring; Laminate flooring; Vinyl flooring
- Bathrooms: 1 full bathroom
- Heating & cooling: Baseboard heating; Window/wall cooling
- Interior features: Ceiling fan; Window treatments
- Laundry & utility: Washer hookup; Dryer hookup; Utility room
Neighborhood map
What this means for you Summary
Snapshot
- This is a 4-bed/1.0-bath single-family listed at $94k.
Deal economics
- At list price, monthly cash flow is $644 ($8k/yr) — positive.
- The deal already cash-flows at list — no discount required.
- Meets the 1% rule at list price ($2k rent vs $94k).
- Cap rate 14.5% vs local median 3.9% in Franklin — top-decile yield for the area; either an underpriced asset or a hidden risk that comps aren't pricing in. Stress-test before assuming the spread holds.
Location & tenants
- Location reads 59/100 on livability (#461 in VA) — a working-class tenant base; expect higher turnover. Strengths: cost of living A+, housing A+, health & safety B+; Watch: crime F, amenities F, commute F.
- Franklin City Public School District (town): math 23% / reading 51% proficiency, ranked #127 of 131 in VA (top 97%) — families likely to look elsewhere, expect single-tenant / working-renter base with shorter leases; 75% free/reduced lunch — lower-income household profile, screen leases tightly.
- Zoned schools: S.P. Morton Elementary (math 16% / reading 38%, grade F, #1,029 of 1,108 statewide, top 94%, 481 students, 101% FRL); Franklin High (math 37% / reading 82%, grade C+, #247 of 319 statewide, top 80%, 378 students, 100% FRL) — zoned schools average 101% FRL vs 75% district-wide (26 pts higher); higher-poverty schools than district average — tighter screening recommended.
- Market conditions: 137 active listings in the ZIP; 3 comparable units currently listed for rent nearby; rentals lingering (median 44d on market — plan ~5-8 weeks vacancy on turnover, expect pricing pressure); 67% of comp listings sitting > 30 days — soft ceiling on asking rent.
Forward outlook
- Local home prices are declining (-3.0%/yr); year-one equity from $653 of loan paydown is wiped out by about $3k of value loss. Plan a longer hold.
- Franklin County population projected at -22% by 2050 — secular population decline; favor cash flow + early exit over multi-decade hold.
- At projected returns (-3.0% appreciation + 3.0% rent growth), your $26k cash investment doubles in ~5 years — after that, you're playing with house money.
Negotiation context
- Only 13 days on market — expect competitive offers; lowballing is unlikely to land.
- Current owner paid $65k; 45% above their basis — modest negotiation headroom, anchor on the comps not their cost.
Risks & watch-outs
- Watch-outs: built in 1958 — expect roof / HVAC / electrical / plumbing capex.
Questions for the listing agent
- Built in 1958 — when were the roof, HVAC, electrical panel, plumbing, and water heater last replaced?
- Is there a deadline driving the sale (1031 exchange, divorce, estate, relocation)? That informs how much negotiation room exists.
- Schools are B-rated — typically a magnet for longer-tenancy family renters. What's the average tenant stay here, and is there a school-zone premium baked into asking?
- Crime grade is F in this area — have there been break-ins, vandalism, or insurance claims at this property in the last 3 years? What carrier currently insures it and at what premium?
- What's the average days-on-market for RENTAL listings here right now (not sales)? A rising rental-DOM trend means longer vacancies and softer asking-rent achievability than the comps imply.
- What's the recent tenant-quality profile in this submarket — average credit score on applications, eviction rate, late-payment / NSF rate, and stable-employment percentage? A property-management company in the area should have these aggregated.
- How much new for-sale + rental construction is in the pipeline within 1–3 miles? Heavy new supply typically softens prices + rents 12–24 months out; constrained supply supports both.
Investment metrics
- 1% rule
- 1.68% ✓
- Cap rate
- 14.47%
- Cash-on-cash
- 29.21%
- DSCR
- 2.30
- GRM
- 5.0
CMA / ARV
- ARV (on-the-fly)
- $198,044
- Comps found
- 12
Show comp detail 12 sales within ~0.75 mi
| Address | Dist | Beds/Ba | Sqft | Sold | Price | $/sf | Match |
|---|---|---|---|---|---|---|---|
| 650 Hayden Dr | 0.39mi | 3/1.0 (-1) | 1,321 (+3%) | 2mo | $140,000 | $106 | 70 |
| 311 Washington St | 0.21mi | 3/2.0 (-1) | 1,200 (-7%) | 1mo | $240,000 | $200 | 69 |
| 200 Delk St | 0.37mi | 3/2.0 (-1) | 1,300 (+1%) | 4mo | $114,900 | $88 | 69 |
| 309 Edwards St | 0.32mi | 3/1.5 (-1) | 1,360 (+6%) | 6mo | $80,000 | $59 | 64 |
| 407 Hall St | 0.26mi | 3/2.0 (-1) | 1,178 (-8%) | 4mo | $75,000 | $64 | 62 |
| 835 Cool Spring St | 0.14mi | 3/1.0 (-1) | 1,100 (-14%) | 8mo | $185,000 | $168 | 58 |
| 416 Cobb St | 0.38mi | 4/2.0 | 1,433 (+11%) | 3mo | $100,000 | $70 | 57 |
| 712 Norfleet St | 0.60mi | 4/2.0 | 1,344 (+4%) | 9mo | $258,000 | $192 | 53 |
| 124 Holland Cir | 0.52mi | 4/2.0 | 1,400 (+9%) | 10mo | $227,000 | $162 | 49 |
| 408 Hogart St | 0.59mi | 4/2.5 | 1,440 (+12%) | 10mo | $229,999 | $160 | 39 |
| 201 Harrison St | 0.59mi | 3/1.0 (-1) | 1,107 (-14%) | 9mo | $170,000 | $154 | 36 |
| 302 Artis St | 0.60mi | 3/2.0 (-1) | 1,462 (+14%) | 11mo | $219,000 | $150 | 31 |
Match score weights: distance 35% · size 25% · config 20% · recency 20%. Top-matched comps best support the ARV.
Projected returns pro-forma
-3.0% appreciation · 3.0% rent growth · sell at horizon
- IRR
- 23.6%
- Equity multiple
- 1.97×
- Total profit
- $25,712
- Equity at exit
- $14,090
- IRR
- 31.5%
- Equity multiple
- 3.84×
- Total profit
- $75,204
- Equity at exit
- $8,171
Cash invested: $26,460 (down + closing). Projections, not guarantees.
Landlord ↔ Tenant lean methodology
- Overall (STATE)
- 55 Moderately Landlord-Leaning
- State Virginia
- 55 Moderately Landlord-Leaning · D+2
- County
- — inherits STATE
- City
- — inherits STATE
ZIP-level market 23851
- Home prices YoY
- -10.2%
- Active inventory
- 137
- Price-to-rent
- 5.0×
Monthly cashflow live
- Estimated rent
- $1,585 medium interval (Pro) →
- Mortgage (P&I)
- −$496
- Tax from tax record
- −$73 /mo · $872/yr
- Insurance
- −$39
- HOA
- −$0
- Vacancy / Maint / Mgmt
- −$333
- Net cashflow
- $644
Break-even live
UW: 25.0% down · 7.5% · 30yr · 1.5% tax · 5.0% vac · 8.0% maint · 8.0% mgmt
Financing live
Cash to close
- Down payment
- $23,625
- Closing costs
- $2,835
- Reserves months
- —
- Total cash needed
- —
Loan-product check · same deal, 3 products live
Conventional
25% down · 7.5% · 30yr
- Down + closing
- —
- Monthly P&I
- —
- Monthly cashflow
- —
- DSCR
- —
- Eligible?
- —
Personal DTI + credit; lowest rate.
DSCR
20% down · 8.5% · 30yr
- Down + closing
- —
- Monthly P&I
- —
- Monthly cashflow
- —
- DSCR
- —
- Eligible?
- —
No personal income docs; deal must DSCR.
Hard money
10% down · 12.0% · 12mo
- Down + closing
- —
- Monthly P&I
- —
- Monthly cashflow
- —
- DSCR
- —
- Eligible?
- —
Short-term bridge; refi at stabilization.
Rent comps 3 comps
| Address | Beds | Baths | Sqft | Rent | $/sqft | DOM | Units | Dist |
|---|---|---|---|---|---|---|---|---|
| 116 Holland Cir Franklin, VA | 3.0 | 1.0 | 1056 | $1,800 | $1.70 | 43d | 1 | 0.53mi |
| 2300 South St Unit 1 Franklin, VA | 3.0 | 1.0 | 1350 | $1,600 | $1.19 | 43d | 1 | 0.90mi |
| 313 Council Rd Franklin, VA | 3.0 | 1.0 | 1000 | $975 | $0.97 | 19d | 1 | 1.36mi |
Listing history 11 events
-
2026-06-18days on market $94,500 Active 13 DOM
-
2026-06-17days on market $94,500 Active 12 DOM
-
2026-06-16days on market $94,500 Active 11 DOM
-
2026-06-15days on market $94,500 Active 10 DOM
-
2026-06-15days on market $94,500 Active 9 DOM
-
2026-06-13days on market $94,500 Active 8 DOM
-
2026-06-12days on market $94,500 Active 7 DOM
-
2026-06-09days on market $94,500 Active 4 DOM
-
2026-06-08days on market $94,500 Active 3 DOM
-
2026-06-08remarks 504-char remark
-
2026-06-08$94,500 Active 2 DOM
ⓘ Source: listings_history table (triggers on properties + properties_extension) + one-shot
backfill from property_details.listing_events for pre-trigger history.
Tax reassessment forecast VA · Resets to sale price
- Current annual tax
- $872 · $73/mo
- Projected year-2 tax
- $872 · $73/mo
- Expected delta
- $0/yr ($0/mo · 0.0%)
ⓘ Screening estimate from a state-policy table — verify with the county assessor before closing.
Nearby sold comps map
Loading sold comps map…
Walkable amenities ~0.75 mi
Loading nearby amenities…
Taxation est. · year 1
- Rental income
- $19,015
- − Mortgage interest
- −$5,293
- − Property taxes
- −$872
- − Insurance
- −$472
- − Repairs & maintenance
- −$1,521
- − Management
- −$1,521
- − Depreciation
- −$2,749
- Taxable income
- $6,585
- Est. tax owed @ 24.0%
- −$1,580
- After-tax cash flow
- $6,150/yr
For passive investors: Depreciation is non-cash, so a rental often shows a tax loss while cash-flowing — sheltering income. Rental losses are passive: they offset passive income freely, and up to $25,000/yr can offset ordinary (W-2) income if you actively participate and your MAGI is under $100k (phasing out to $0 by $150k); unused losses carry forward. On sale, claimed depreciation is recaptured at up to 25%, and gains may owe capital-gains tax (a 1031 exchange can defer both). Figures are a year-1 estimate at your 24.0% rate — not tax advice; consult a CPA.
Schools (NCES district)
- District
- Franklin City Public School District
- NCES district ID
- 5101410
- Math proficiency
- 23% ▼ -48.00%
- Reading proficiency
- 51% ▼ -18.00%
- Median HH income
- $35,138
- Composite
- 30.47/100
- National rank
- #6227
- State rank
- #127 of 131 in VA
Livability — Franklin
- Score
- 59/100
- State rank
- #461
- US rank
- #19645
Category grades
Schools grade is shown separately in the Schools card above.
Census & demographics
- Census place
- Franklin, VA
- Population (ZIP)
- 13,481
Population outlook (Franklin County) Hauer SSP2
- Today (2025)
- 7,817 people
- By 2030
- 7,480 · -4.3%
- By 2040
- 6,803 · -13.0%
- By 2050
- 6,124 · -21.7%
- By 2075
- 4,484 · -42.6%
- By 2100
- 2,967 · -62.0%
Race, ethnicity, and origin ACS 2023
- Neighborhood character
- Diverse neighborhood (Simpson 0.60)
- Race & ethnicity
- Black 45% White 44% Two or more races 8% Hispanic / Latino 2% Asian 2%
- Common ancestry
- Serbian 2% Slovak 1% Lithuanian 1%
- Foreign-born
- 2% · South Korea, Canada
- Languages at home
- 97% English-only · Spanish 2% Other Indo-European 1%
Political lean MEDSL · Franklin
- 2024 margin
- Strong D (+22.8) · D 60.9% · R 38.1% · Other 1.1%
- 2008→2024 swing
- -5.3pp toward R · 2008: 28.1pp · 2024: 22.8pp
- All cycles
- 2024: D+22.8 2020: D+25.6 2016: D+27.1 2012: D+30.7 2008: D+28.1
Not yet ingested
- Civics
- —
Market trends
- HPI YoY
- ▼ -33.51%
- Current HPI
- 293.564
- Rent YoY
- —
- Metro
- —
- State GDP YoY
- ▲ 2.40%
- F500 in state
- 50
Industry mix (Fortune 500 HQ in VA)
| Industry | F500 HQs | Revenue |
|---|---|---|
| Aerospace / Defense | 4 | $236B |
|
||
| Technology / Defense | 3 | $32B |
|
||
| Financial Services | 2 | $176B |
|
||
| Utilities | 2 | $27B |
|
||
| Insurance | 2 | $25B |
|
||
| Technology | 2 | $15B |
|
||
Price history
+45.4% since first listed2 events — show timeline
- 2026-06-05 Listed $94,500 REINMLS
- 2005-11-15 Sold (Public Records) $65,000 Public Records
Property tax history
+3.9%/yrLatest (2025): $872 · +0.0% YoY. Source: county tax records.
Cash-flow waterfall
monthlySold comps — $/sqft
last 12 mo · ≤1 miLoading sold comps…