3081 W County Road 100 S · Greencastle, IN
Flood risk 1/10 · Minimal
- FEMA flood zone
- X (unshaded)
- Chance of flooding over 30 yrs
- 0.0%
- Est. flood insurance / yr
- $507 – $1,088
Fire risk 3/10 · Minor
- Est. fire insurance / yr
- $717 – $1,331
Heat risk 4/10 · Minor
- Hot days now (above 103°F)
- 7 days/yr
- Hot days in 30 yrs
- 18 days/yr
Wind risk 2/10 · Minimal
- Chance of severe wind over 30 yrs
- 1.0%
Air-quality risk 2/10 · Minimal
- Unhealthy air days now
- 1 days/yr
- Unhealthy air days in 30 yrs
- 2 days/yr
Risk factors via First Street. Map © Google.
Why this score? — see what drove the D grade
The composite is a weighted blend of 9 inputs, each scored 0–100. Each bar is that input's sub-score; the figure is the points it added to the 100-point composite (weight × sub-score).
- Cash flow +16.9/30.0
- DSCR +5.3/10.0
- ARV discount +4.6/15.0
- Livability +3.7/5.0
- 1% rule +3.4/10.0
- Schools +3.4/10.0
- Rent growth +2.5/5.0
- Condition / age +2.5/5.0
- Appreciation +0.0/10.0
$159,900
🖨 Deal sheet 📄 Offer letter ✓ Due diligence
Listing remarks MLS
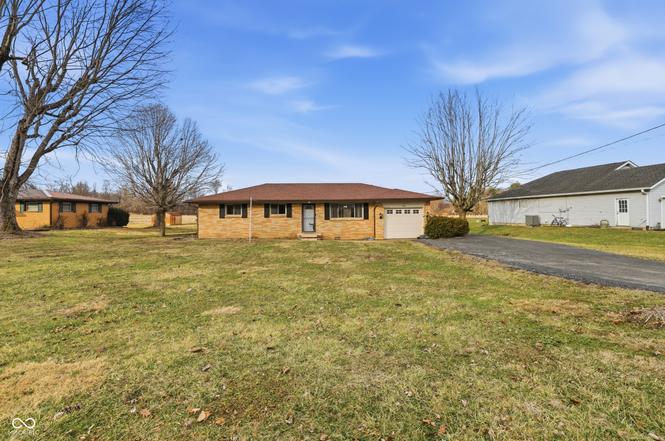
Gorgeous country ranch home, 3 bedroom, 1 bath in historic Greencastle. Covered rear patio to enjoy quiet evenings at home, or entertaining guests. Spacious living room with separate dining room in kitchen. 1 car attached garage, 2 car detached garage. All brick exterior. This beautiful home is move in ready and won't last long. New roof and gutters!
Key facts
- 0.4 acre lot
- Garage
- Built 1964
Property features AI
Exterior
- Parking: Attached garage (1 car)
- Utilities: Public water; Septic system; 200+ amp electric service
- Home design: Single-family residence; One-level home; Residential property
- Construction: Brick construction; Block foundation
- Exterior features: Covered patio/porch
Interior
- Kitchen: Electric cooktop; Electric oven; Dishwasher; Refrigerator; Eat-in kitchen
- Bedrooms: 3 bedrooms (all on the main level)
- Flooring: Hardwood floors
- Bathrooms: 1 full bathroom (main level)
- Heating & cooling: Radiant ceiling heating; Window air conditioning units; No central air
- Interior features: Attic with pull-down stairs; Hardwood floors; Eat-in kitchen
- Laundry & utility: Washer; Dryer; Laundry closet; Electric water heater
Neighborhood map
What this means for you Summary
Snapshot
- This is a 2-bed/1.0-bath single-family listed at $160k.
Deal economics
- At list price, monthly cash flow is $107 ($1k/yr) — positive.
- The deal already cash-flows at list — no discount required.
- To meet the 1% rule (rent ≥ 1% of price), the offer needs to be $135k (15.7% below list).
- Recommended offer: $135k (15.7% below list) — sets the bar for 1% rule.
- Cap rate 7.1% vs local median 4.3% in Greencastle — top-decile yield for the area; either an underpriced asset or a hidden risk that comps aren't pricing in. Stress-test before assuming the spread holds.
Location & tenants
- Location reads 73/100 on livability (#108 in IN) — a middle-class / working-renter tenant base. Strengths: cost of living A+, housing A+; Watch: employment C-, amenities F, commute F.
- Greencastle Community School Corporation (town): math 38% / reading 42% proficiency, ranked #145 of 301 in IN (top 48%) — families likely to look elsewhere, expect single-tenant / working-renter base with shorter leases.
- Zoned schools: Greencastle High School (math 42% / reading 67%, grade C-, #79 of 369 statewide, top 26%, 498 students, 49% FRL).
- Zoned-school proficiency averages 54% at this address vs 40% district-wide (+14 pts) — the actual schools serving this property are materially stronger than the Greencastle Community School Corporation average implies; a family-tenant draw the district grade alone would hide.
- Market conditions: 97 active listings in the ZIP; 166 units permitted in Putnam County in 2024 (0 in 5+ unit buildings).
Forward outlook
- Local home prices are declining (-3.0%/yr); year-one equity from $1k of loan paydown is wiped out by about $5k of value loss. Plan a longer hold.
- Putnam County population projected to shrink 8% by 2050 — rents likely to lag national; underwrite the cash flow, not the appreciation.
Negotiation context
- It's been on market 35 days — a 3% lower offer ($155k) is reasonable based on typical stale-listing flexibility.
- 7 sale attempts since 18y ago with the ask held roughly flat each time — persistent listings suggest the price (not the market) is what's stuck; bring a comps-based counter.
- Current owner paid $114k; 40% above their basis — modest negotiation headroom, anchor on the comps not their cost.
Questions for the listing agent
- It's been on market 35 days. Have you received any prior offers? Is the seller open to a 16% concession, seller financing, or rate buy-down credit?
- Built in 1964 — when were the roof, HVAC, electrical panel, plumbing, and water heater last replaced?
- Is there a deadline driving the sale (1031 exchange, divorce, estate, relocation)? That informs how much negotiation room exists.
- The area grade is low — what's the realistic commute time and amenity access for the typical tenant pool here? Any planned neighborhood developments (good or bad) we should know about?
- What's the average days-on-market for RENTAL listings here right now (not sales)? A rising rental-DOM trend means longer vacancies and softer asking-rent achievability than the comps imply.
- What's the recent tenant-quality profile in this submarket — average credit score on applications, eviction rate, late-payment / NSF rate, and stable-employment percentage? A property-management company in the area should have these aggregated.
- How much new for-sale + rental construction is in the pipeline within 1–3 miles? Heavy new supply typically softens prices + rents 12–24 months out; constrained supply supports both.
Investment metrics
- 1% rule
- 0.84% ✗
- Cap rate
- 7.09%
- Cash-on-cash
- 2.86%
- DSCR
- 1.13
- GRM
- 9.9
CMA / ARV
- ARV (on-the-fly)
- $150,120
- Comps found
- 1
Show comp detail 1 sale within ~0.75 mi
| Address | Dist | Beds/Ba | Sqft | Sold | Price | $/sf | Match |
|---|---|---|---|---|---|---|---|
| 3081 W County Road 100 S | 0.00mi | 3/1.0 (+1) | 1,080 (0%) | 0mo | $150,000 | $139 | 95 |
Match score weights: distance 35% · size 25% · config 20% · recency 20%. Top-matched comps best support the ARV.
Projected returns pro-forma
-3.0% appreciation · 3.0% rent growth · sell at horizon
- IRR
- -11.8%
- Equity multiple
- 0.57×
- Total profit
- $-19,196
- Equity at exit
- $23,842
- IRR
- -2.7%
- Equity multiple
- 0.82×
- Total profit
- $-8,262
- Equity at exit
- $13,825
Cash invested: $44,772 (down + closing). Projections, not guarantees.
Landlord ↔ Tenant lean methodology
- Overall (STATE)
- 90 Strongly Landlord-Friendly
- State Indiana
- 90 Strongly Landlord-Friendly · R+11
- County
- — inherits STATE
- City
- — inherits STATE
ZIP-level market 46135
- Home prices YoY
- -20.8%
- Active inventory
- 97
- Price-to-rent
- 9.9×
Monthly cashflow live
- Estimated rent
- $1,348 medium interval (Pro) →
- Mortgage (P&I)
- −$839
- Tax from tax record
- −$53 /mo · $636/yr
- Insurance
- −$67
- HOA
- −$0
- Vacancy / Maint / Mgmt
- −$283
- Net cashflow
- $107
Break-even live
UW: 25.0% down · 7.5% · 30yr · 1.5% tax · 5.0% vac · 8.0% maint · 8.0% mgmt
Financing live
Cash to close
- Down payment
- $39,975
- Closing costs
- $4,797
- Reserves months
- —
- Total cash needed
- —
Loan-product check · same deal, 3 products live
Conventional
25% down · 7.5% · 30yr
- Down + closing
- —
- Monthly P&I
- —
- Monthly cashflow
- —
- DSCR
- —
- Eligible?
- —
Personal DTI + credit; lowest rate.
DSCR
20% down · 8.5% · 30yr
- Down + closing
- —
- Monthly P&I
- —
- Monthly cashflow
- —
- DSCR
- —
- Eligible?
- —
No personal income docs; deal must DSCR.
Hard money
10% down · 12.0% · 12mo
- Down + closing
- —
- Monthly P&I
- —
- Monthly cashflow
- —
- DSCR
- —
- Eligible?
- —
Short-term bridge; refi at stabilization.
Listing history 14 events
-
2026-04-11status Pending
-
2026-03-26status Active
-
2026-03-21status Pending
-
2026-03-16price $159,900
-
2026-03-03status Active
-
2026-02-22$168,000 Active
-
2017-12-07soldstatus $114,000 352-char remark
Show marketing remark (352 chars)
Gorgeous country ranch home, 3 bedroom, 1 bath in historic Greencastle. Covered rear patio to enjoy quiet evenings at home, or entertaining guests. Spacious living room with separate dining room in kitchen. 1 car attached garage, 2 car detached garage. All brick exterior. This beautiful home is move in ready and won't last long. New roof and gutters!
-
2017-09-06$120,000 352-char remark
Show marketing remark (352 chars)
Gorgeous country ranch home, 3 bedroom, 1 bath in historic Greencastle. Covered rear patio to enjoy quiet evenings at home, or entertaining guests. Spacious living room with separate dining room in kitchen. 1 car attached garage, 2 car detached garage. All brick exterior. This beautiful home is move in ready and won't last long. New roof and gutters!
-
2016-08-16historical
-
2016-04-26$102,900
-
2014-08-01historical
-
2014-03-03$117,500
-
2009-01-09historical
-
2008-07-23$117,500
ⓘ Source: listings_history table (triggers on properties + properties_extension) + one-shot
backfill from property_details.listing_events for pre-trigger history.
Tax reassessment forecast IN · Partial reset (capped growth)
- Current annual tax
- $636 · $53/mo
- Projected year-2 tax
- $998 · $83/mo
- Expected delta
- +$361/yr (+$30/mo · 56.8%)
ⓘ Screening estimate from a state-policy table — verify with the county assessor before closing.
Climate risk First Street
- Flood 1/10 Low FEMA zone X (unshaded) · 0% chance over 30 yrs
- Wildfire 3/10 Moderate
- Heat 4/10 Moderate 7 d/yr ≥103°F today · 18 d/yr by 30 yrs out
- Wind 2/10 Low 100% chance of damaging wind over 30 yrs
- Air quality 2/10 Low 1 unhealthy d/yr today · 2 by 30 yrs out
Nearby sold comps map
Loading sold comps map…
Walkable amenities ~0.75 mi
Loading nearby amenities…
Taxation est. · year 1
- Rental income
- $16,173
- − Mortgage interest
- −$8,957
- − Property taxes
- −$636
- − Insurance
- −$800
- − Repairs & maintenance
- −$1,294
- − Management
- −$1,294
- − Depreciation
- −$4,652
- Taxable loss
- −$1,459
- Est. tax savings @ 24.0%
- +$350
- After-tax cash flow
- $1,629/yr
For passive investors: Depreciation is non-cash, so a rental often shows a tax loss while cash-flowing — sheltering income. Rental losses are passive: they offset passive income freely, and up to $25,000/yr can offset ordinary (W-2) income if you actively participate and your MAGI is under $100k (phasing out to $0 by $150k); unused losses carry forward. On sale, claimed depreciation is recaptured at up to 25%, and gains may owe capital-gains tax (a 1031 exchange can defer both). Figures are a year-1 estimate at your 24.0% rate — not tax advice; consult a CPA.
Schools (NCES district)
- District
- Greencastle Community School Corporation
- NCES district ID
- 1803990
- Math proficiency
- 38% ▼ -5.00%
- Reading proficiency
- 42% ▼ -6.00%
- Median HH income
- $46,694
- Composite
- 34.17/100
- National rank
- #5276
- State rank
- #145 of 301 in IN
Livability — Greencastle
- Score
- 73/100
- State rank
- #108
- US rank
- #5665
Category grades
Schools grade is shown separately in the Schools card above.
Census & demographics
- Population (ZIP)
- 19,639
Population outlook (Putnam County) Hauer SSP2
- Today (2025)
- 37,226 people
- By 2030
- 36,723 · -1.4%
- By 2040
- 35,407 · -4.9%
- By 2050
- 34,177 · -8.2%
- By 2075
- 32,038 · -13.9%
- By 2100
- 28,380 · -23.8%
Race, ethnicity, and origin ACS 2023
- Neighborhood character
- Predominantly White (86%)
- Race & ethnicity
- White 86% Black 6% Two or more races 4% Hispanic / Latino 3% Asian 2%
- Common ancestry
- Italian 2% Slovak 2% Lithuanian 1%
- Foreign-born
- 4% · China, Canada
- Languages at home
- 96% English-only · Spanish 1% French/Haitian/Cajun 1% Other Indo-European 1%
Political lean MEDSL · Putnam
- 2024 margin
- Solid R (+52.0) · D 23.1% · R 75.1% · Other 1.8%
- 2008→2024 swing
- -40.0pp toward R · 2008: -12.0pp · 2024: -52.0pp
- All cycles
- 2024: R+52.0 2020: R+50.2 2016: R+49.6 2012: R+32.6 2008: R+12.0
Not yet ingested
- Civics
- —
Market trends
- HPI YoY
- ▼ -58.66%
- Current HPI
- 222.8815
- Rent YoY
- —
- Metro
- —
- State GDP YoY
- ▲ 2.90%
- F500 in state
- 18
Industry mix (Fortune 500 HQ in IN)
| Industry | F500 HQs | Revenue |
|---|---|---|
| Industrial Machinery | 2 | $37B |
|
||
| Healthcare | 1 | $177B |
|
||
| Pharmaceuticals | 1 | $45B |
|
||
| Metals / Steel | 1 | $18B |
|
||
| Agriculture | 1 | $17B |
|
||
| Packaging | 1 | $12B |
|
||
Price history
+36.1% since first listed14 events — show timeline
- 2026-04-11 Pending — MIBOR as Distributed by MLS Grid
- 2026-03-26 Relisted — MIBOR as Distributed by MLS Grid
- 2026-03-21 Pending — MIBOR as Distributed by MLS Grid
- 2026-03-16 Price Changed $159,900 MIBOR as Distributed by MLS Grid
- 2026-03-03 Relisted — MIBOR as Distributed by MLS Grid
- 2026-02-22 Listed $168,000 MIBOR as Distributed by MLS Grid
- 2017-12-07 Sold (MLS) $114,000 MIBOR as Distributed by MLS Grid
- 2017-09-06 Listed $120,000 MIBOR as Distributed by MLS Grid
- 2016-08-16 Listing Removed — MIBOR as Distributed by MLS Grid
- 2016-04-26 Listed $102,900 MIBOR as Distributed by MLS Grid
- 2014-08-01 Listing Removed — MIBOR as Distributed by MLS Grid
- 2014-03-03 Listed $117,500 MIBOR as Distributed by MLS Grid
- 2009-01-09 Listing Removed — MIBOR as Distributed by MLS Grid
- 2008-07-23 Listed $117,500 MIBOR as Distributed by MLS Grid
Property tax history
+4.9%/yrLatest (2024): $636 · +7.8% YoY. Source: county tax records.
Cash-flow waterfall
monthlySold comps — $/sqft
last 12 mo · ≤1 miLoading sold comps…