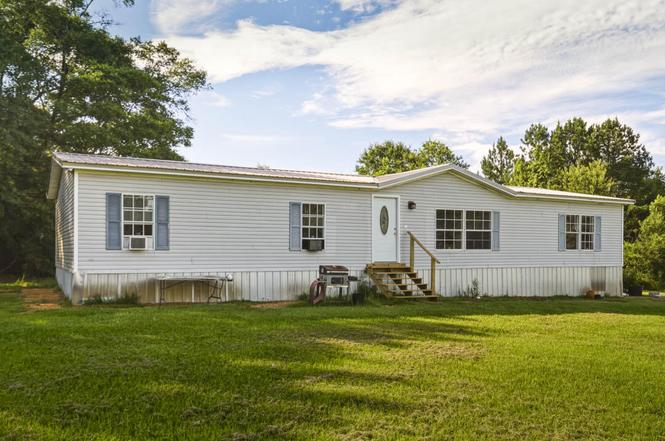
103 Water Valley Rd · Foxworth, MS
Flood risk 1/10 · Minimal
- FEMA flood zone
- X (unshaded)
- Chance of flooding over 30 yrs
- 0.0%
- Est. flood insurance / yr
- $507 – $1,088
Fire risk 7/10 · Major
- Est. fire insurance / yr
- $1,241 – $2,305
Heat risk 8/10 · Major
- Hot days now (above 109°F)
- 7 days/yr
- Hot days in 30 yrs
- 20 days/yr
Wind risk 8/10 · Major
- Chance of severe wind over 30 yrs
- 99.0%
Air-quality risk 1/10 · Minimal
- Unhealthy air days now
- 0 days/yr
- Unhealthy air days in 30 yrs
- 0 days/yr
Risk factors via First Street. Map © Google.
Why this score? — see what drove the B- grade
The composite is a weighted blend of 9 inputs, each scored 0–100. Each bar is that input's sub-score; the figure is the points it added to the 100-point composite (weight × sub-score).
- Cash flow +30.0/30.0
- 1% rule +10.0/10.0
- DSCR +10.0/10.0
- ARV discount +7.5/15.0
- Livability +3.0/5.0
- Schools +2.7/10.0
- Rent growth +2.5/5.0
- Condition / age +1.0/5.0
- Appreciation +0.0/10.0
$89,900
🖨 Deal sheet 📄 Offer letter ✓ Due diligence
Listing remarks MLS
Charming country fixer-upper on 4.6 acres -- priced to sell! Bring your vision and finish this spacious 4-bedroom, 2-bath mobile home with great bones and huge potential. The flowing split-plan layout offers privacy and practicality: a roomy primary suite on one side and three bedrooms on the other. Warm up by the cozy fireplace, or gather in the large eat-in kitchen -- plenty of space for a chef's touch and family meals. A formal dining area provides additional entertaining options. Needs TLC: flooring, cosmetic updates and finishing touches will make this place shine. Major recent investment already done -- roof replaced in 2025 -- so you can focus on interiors and landscaping. Property includes ample acreage for gardening, animals, recreation, or future outbuildings. Great opportunity for investors or DIY homeowners looking for value and acreage. Schedule a showing and imagine the possibilities!
Key facts
- Large eat-in kitchen
- Primary suite
- 4.6 acres
Tags
Property features AI
Exterior
- Utilities: Well water; Septic tank; Electricity connected; Water and sewer connected
- Home design: Manufactured home (mobile home), single level
- Construction: Vinyl exterior; Raised foundation; Built as a manufactured house
- Exterior features: Metal roof; Garden; Lot about 4.6 acres
Interior
- Kitchen: Dishwasher; Microwave
- Bathrooms: 2 bathrooms
- Heating & cooling: Central electric heating; Central air conditioning (electric)
- Interior features: Soaking tub; Double vanity; Fireplace in dining room; Garden (exterior-accessible feature)
- Laundry & utility: Laundry closet; Dryer
Neighborhood map
What this means for you Summary
Snapshot
- This is a 4-bed/2.0-bath manufactured listed at $90k. Condition is rated poor.
Deal economics
- At list price, monthly cash flow is $603 ($7k/yr) — positive.
- The deal already cash-flows at list — no discount required.
- Meets the 1% rule at list price ($2k rent vs $90k).
Location & tenants
- Location reads 59/100 on livability (#246 in MS) — a working-class tenant base; expect higher turnover. Strengths: cost of living A+, housing A+; Watch: crime C-, health & safety D, amenities F.
- Marion County School District (rural): math 37% / reading 29% proficiency, ranked #62 of 130 in MS (top 48%) — families likely to look elsewhere, expect single-tenant / working-renter base with shorter leases; 79% free/reduced lunch — lower-income household profile, screen leases tightly.
- Market conditions: 27 active listings in the ZIP; 2 units permitted in Marion County in 2024 (0 in 5+ unit buildings).
Forward outlook
- Local home prices are declining (-3.0%/yr); year-one equity from $622 of loan paydown is wiped out by about $3k of value loss. Plan a longer hold.
- Marion County population projected at -33% by 2050 — secular population decline; favor cash flow + early exit over multi-decade hold.
- At projected returns (-3.0% appreciation + 3.0% rent growth), your $25k cash investment doubles in ~5 years — after that, you're playing with house money.
Negotiation context
- Only 2 days on market — expect competitive offers; lowballing is unlikely to land.
- 2 sale attempts with the ask held roughly flat each time — persistent listings suggest the price (not the market) is what's stuck; bring a comps-based counter.
Risks & watch-outs
- Climate carrying-cost: severe wind risk, 99% chance of damaging wind over 30y; major wildfire risk; extreme-heat days projected 7→20/yr by 2055 (HVAC capex compounding) — expect insurance premiums to compound above CPI over the hold.
Questions for the listing agent
- Have any recent inspections been done? Can we get a copy of the seller's disclosures and any deferred-maintenance estimates?
- Is there a deadline driving the sale (1031 exchange, divorce, estate, relocation)? That informs how much negotiation room exists.
- What's the average days-on-market for RENTAL listings here right now (not sales)? A rising rental-DOM trend means longer vacancies and softer asking-rent achievability than the comps imply.
- What's the recent tenant-quality profile in this submarket — average credit score on applications, eviction rate, late-payment / NSF rate, and stable-employment percentage? A property-management company in the area should have these aggregated.
- How much new for-sale + rental construction is in the pipeline within 1–3 miles? Heavy new supply typically softens prices + rents 12–24 months out; constrained supply supports both.
Investment metrics
- 1% rule
- 1.72% ✓
- Cap rate
- 14.34%
- Cash-on-cash
- 28.75%
- DSCR
- 2.28
- GRM
- 4.8
CMA / ARV
No comps found within radius.
Projected returns pro-forma
-3.0% appreciation · 3.0% rent growth · sell at horizon
- IRR
- 23.1%
- Equity multiple
- 1.95×
- Total profit
- $23,872
- Equity at exit
- $13,404
- IRR
- 31.0%
- Equity multiple
- 3.79×
- Total profit
- $70,349
- Equity at exit
- $7,773
Cash invested: $25,172 (down + closing). Projections, not guarantees.
Landlord ↔ Tenant lean methodology
- Overall (STATE)
- 90 Strongly Landlord-Friendly
- State Mississippi
- 90 Strongly Landlord-Friendly · R+11
- County
- — inherits STATE
- City
- — inherits STATE
ZIP-level market 39483
- Home prices YoY
- -17.5%
- Active inventory
- 27
- Price-to-rent
- 4.8×
Monthly cashflow live
- Estimated rent
- $1,550 medium interval (Pro) →
- Mortgage (P&I)
- −$471
- Tax est. 1.5%
- −$112 /mo · $1,348/yr
- Insurance
- −$37
- HOA
- −$0
- Vacancy / Maint / Mgmt
- −$325
- Net cashflow
- $603
Break-even live
UW: 25.0% down · 7.5% · 30yr · 1.5% tax · 5.0% vac · 8.0% maint · 8.0% mgmt
Financing live
Cash to close
- Down payment
- $22,475
- Closing costs
- $2,697
- Reserves months
- —
- Total cash needed
- —
Loan-product check · same deal, 3 products live
Conventional
25% down · 7.5% · 30yr
- Down + closing
- —
- Monthly P&I
- —
- Monthly cashflow
- —
- DSCR
- —
- Eligible?
- —
Personal DTI + credit; lowest rate.
DSCR
20% down · 8.5% · 30yr
- Down + closing
- —
- Monthly P&I
- —
- Monthly cashflow
- —
- DSCR
- —
- Eligible?
- —
No personal income docs; deal must DSCR.
Hard money
10% down · 12.0% · 12mo
- Down + closing
- —
- Monthly P&I
- —
- Monthly cashflow
- —
- DSCR
- —
- Eligible?
- —
Short-term bridge; refi at stabilization.
Listing history 3 events
-
2026-06-18days on market $89,900 Active 2 DOM
-
2026-06-17remarks 699-char remark
-
2026-06-17$89,900 Active 1 DOM
ⓘ Source: listings_history table (triggers on properties + properties_extension) + one-shot
backfill from property_details.listing_events for pre-trigger history.
Climate risk First Street
- Flood 1/10 Low FEMA zone X (unshaded) · 0% chance over 30 yrs
- Wildfire 7/10 Severe
- Heat 8/10 Severe 7 d/yr ≥109°F today · 20 d/yr by 30 yrs out
- Wind 8/10 Severe 99% chance of damaging wind over 30 yrs
- Air quality 1/10 Low 0 unhealthy d/yr today · 0 by 30 yrs out
Nearby sold comps map
Loading sold comps map…
Walkable amenities ~0.75 mi
Loading nearby amenities…
Taxation est. · year 1
- Rental income
- $18,599
- − Mortgage interest
- −$5,036
- − Property taxes
- −$1,348
- − Insurance
- −$450
- − Repairs & maintenance
- −$1,488
- − Management
- −$1,488
- − Depreciation
- −$2,615
- Taxable income
- $6,174
- Est. tax owed @ 24.0%
- −$1,482
- After-tax cash flow
- $5,756/yr
For passive investors: Depreciation is non-cash, so a rental often shows a tax loss while cash-flowing — sheltering income. Rental losses are passive: they offset passive income freely, and up to $25,000/yr can offset ordinary (W-2) income if you actively participate and your MAGI is under $100k (phasing out to $0 by $150k); unused losses carry forward. On sale, claimed depreciation is recaptured at up to 25%, and gains may owe capital-gains tax (a 1031 exchange can defer both). Figures are a year-1 estimate at your 24.0% rate — not tax advice; consult a CPA.
Condition & rehab AI · 12 photos
This mobile home requires extensive repairs and updates to improve its condition and value. The exposed subfloor and missing cabinets are major issues that need addressing to make the home move-in ready.
Repairs flagged
- Major Exposed subfloor — Structural damage
- Major Missing cabinets — Aesthetic and functional
- Major Outdated appliances — Aesthetic and functional
Value-add opportunities
- Both Replace subfloor and flooring — Improves structural integrity and aesthetics
- Both Upgrade kitchen cabinets and appliances — Enhances functionality and appeal
- Both Paint exterior siding — Enhances curb appeal and value
Renovation cost estimate screening
| Repair item | Severity | Est. cost |
|---|---|---|
| Exposed subfloor · Structural damage | Major | $15,000–50,000 |
| Missing cabinets · Aesthetic and functional | Major | $15,000–50,000 |
| Outdated appliances · Aesthetic and functional | Major | $15,000–50,000 |
| Total estimated repair cost · 3 items | $45,000–150,000 |
Value-add ROI direction
- Both Replace subfloor and flooring — Improves structural integrity and aesthetics ↑
- Both Upgrade kitchen cabinets and appliances — Enhances functionality and appeal ↑
- Both Paint exterior siding — Enhances curb appeal and value ↑
ⓘ Cost ranges are severity-bucket heuristics (US national rule-of-thumb). Get contractor quotes + a written scope before underwriting a rehab budget.
Schools (NCES district)
- District
- Marion County School District
- NCES district ID
- 2802820
- Math proficiency
- 37% ▼ -9.00%
- Reading proficiency
- 29% ▼ -9.00%
- Median HH income
- $30,866
- Composite
- 26.9/100
- National rank
- #7089
- State rank
- #62 of 130 in MS
Livability — Foxworth
- Score
- 59/100
- State rank
- #246
- US rank
- #20172
Category grades
Schools grade is shown separately in the Schools card above.
Census & demographics
- Population (ZIP)
- 5,003
Population outlook (Marion County) Hauer SSP2
- Today (2025)
- 22,813 people
- By 2030
- 21,301 · -6.6%
- By 2040
- 18,176 · -20.3%
- By 2050
- 15,215 · -33.3%
- By 2075
- 9,388 · -58.8%
- By 2100
- 5,335 · -76.6%
Race, ethnicity, and origin ACS 2023
- Neighborhood character
- Predominantly White (70%)
- Race & ethnicity
- White 70% Black 22% Hispanic / Latino 3% Two or more races 3%
- Common ancestry
- Lithuanian 2% Serbian 1%
- Foreign-born
- 2% · Canada
- Languages at home
- 95% English-only · Spanish 4% German/W. Germanic 1%
Political lean MEDSL · Marion
- 2024 margin
- Solid R (+41.6) · D 28.7% · R 70.4%
- 2008→2024 swing
- -10.2pp toward R · 2008: -31.4pp · 2024: -41.6pp
- All cycles
- 2024: R+41.6 2020: R+36.8 2016: R+36.0 2012: R+29.8 2008: R+31.4
Not yet ingested
- Civics
- —
Market trends
- HPI YoY
- ▼ -31.09%
- Current HPI
- 146.6775
- Rent YoY
- —
- Metro
- —
- State GDP YoY
- —
- F500 in state
- 0
Price history
+0.0% since first listed2 events — show timeline
- 2026-06-16 Listed $89,900 HAAR
- 2026-06-16 Listed $89,900 MLSU
Cash-flow waterfall
monthlySold comps — $/sqft
last 12 mo · ≤1 miLoading sold comps…