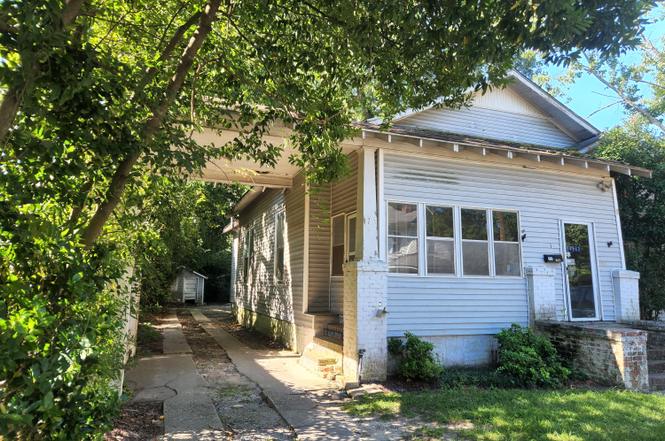
404 W Hampton Ave · Sumter, SC
Flood risk 4/10 · Minor
- FEMA flood zone
- X (unshaded)
- Chance of flooding over 30 yrs
- 0.22%
- Est. flood insurance / yr
- $507 – $1,088
Fire risk 1/10 · Minimal
- Est. fire insurance / yr
- $783 – $1,453
Heat risk 7/10 · Major
- Hot days now (above 108°F)
- 7 days/yr
- Hot days in 30 yrs
- 16 days/yr
Wind risk 8/10 · Major
- Chance of severe wind over 30 yrs
- 80.0%
Air-quality risk 2/10 · Minimal
- Unhealthy air days now
- 2 days/yr
- Unhealthy air days in 30 yrs
- 2 days/yr
Risk factors via First Street. Map © Google.
Why this score? — see what drove the D- grade
The composite is a weighted blend of 9 inputs, each scored 0–100. Each bar is that input's sub-score; the figure is the points it added to the 100-point composite (weight × sub-score).
- ARV discount +15.0/15.0
- Cash flow +8.4/30.0
- Rent growth +3.1/5.0
- Livability +3.0/5.0
- Condition / age +2.5/5.0
- DSCR +2.3/10.0
- 1% rule +2.2/10.0
- Schools +1.9/10.0
- Appreciation +0.0/10.0
$180,000
🖨 Deal sheet (PDF) 📄 Offer letter ✓ Due diligence
Listing remarks
Calling all investors! Here's your chance to own an income producing Triplex right in the heart of Sumter! Subject to Tenants Rights - Must have 24 hour appointment to view. No Cameras inside occupied units. Do not disturb tenants. Sold As-Is
Key facts
- 7,405 sq ft lot
- Built 1910
- Listed 283 days
Property features AI
Exterior
- Utilities: Public water; Public sewer; Cable available; Paved, publicly maintained road access
- Home design: Triplex residential income property; Duplex structure type
- Construction: Vinyl siding; Wood siding; Asphalt roof; Crawl space foundation; Built on a 0.17-acre lot (approx. 55 x 140)
- Exterior features: No notable exterior features listed; No fencing
Interior
- Kitchen: Range; Refrigerator
- Flooring: Carpet
- Bathrooms: 1 full bathroom
- Heating & cooling: Heat pump heating; Heat pump cooling
- Interior features: Other
Neighborhood map
What this means for you Summary
Snapshot
- This is a 2-bed/3.0-bath single-family listed at $180k.
Deal economics
- At list price, monthly cash flow is $-162 ($-2k/yr) — negative.
- To cash-flow at today's rent, offer at most $151k (15.9% below list).
- To meet the 1% rule (rent ≥ 1% of price), the offer needs to be $130k (27.7% below list).
- Recommended offer: $130k (27.7% below list) — sets the bar for 1% rule.
- Cap rate 5.2% vs local median 3.4% in Sumter — top-decile yield for the area; either an underpriced asset or a hidden risk that comps aren't pricing in. Stress-test before assuming the spread holds.
Location & tenants
- Location reads 59/100 on livability (#235 in SC) — a working-class tenant base; expect higher turnover. Strengths: cost of living A+, health & safety A+, housing A-; Watch: crime F, amenities F, commute F.
- Sumter 01 (urban): math 18% / reading 28% proficiency, ranked #64 of 80 in SC (top 80%) — low school quality limits family demand, transient renter base, plan for 1-2y turnover; 64% free/reduced lunch — lower-income household profile, screen leases tightly.
- Zoned schools: Willow Drive Elementary (math 8% / reading 12%, grade F, #587 of 597 statewide, top 99%, 551 students, 100% FRL); Alice Drive Middle (math 23% / reading 34%, grade F, #144 of 229 statewide, top 63%, 841 students, 100% FRL); Sumter High School (math 22% / reading 67%, grade F, #166 of 196 statewide, top 87%, 2,289 students, 100% FRL) — zoned schools average 100% FRL vs 64% district-wide (36 pts higher); higher-poverty schools than district average — tighter screening recommended.
- Market conditions: Rents rising (+2.5%/yr); 384 active listings in the ZIP; 386 units permitted in Sumter County in 2024 (0 in 5+ unit buildings).
- This rent runs 31% of the median local income ($51k/yr) — at the standard rent-burdened threshold; future hikes will face affordability resistance.
Forward outlook
- Local home prices are declining (-3.0%/yr); year-one equity from $1k of loan paydown is wiped out by about $5k of value loss. Plan a longer hold.
- Sumter County population projected at -14% by 2050 — secular population decline; favor cash flow + early exit over multi-decade hold.
Negotiation context
- It's been on market 283 days — a 12% lower offer ($158k) is reasonable based on typical stale-listing flexibility.
- 2 sale attempts with the ask held roughly flat each time — persistent listings suggest the price (not the market) is what's stuck; bring a comps-based counter.
Risks & watch-outs
- Watch-outs: built in 1910 — expect roof / HVAC / electrical / plumbing capex.
- Climate carrying-cost: severe wind risk, 80% chance of damaging wind over 30y; extreme-heat days projected 7→16/yr by 2055 (HVAC capex compounding) — expect insurance premiums to compound above CPI over the hold.
Questions for the listing agent
- What do current leases actually rent for vs. the listed asking? Can we see a recent rent roll and the last 12 months of T-12 income?
- It's been on market 283 days. Have you received any prior offers? Is the seller open to a 28% concession, seller financing, or rate buy-down credit?
- Built in 1910 — when were the roof, HVAC, electrical panel, plumbing, and water heater last replaced?
- Why hasn't it sold? Are there any deal-killer items the seller is aware of (foundation, flood, title, zoning, code violations)?
- Is there a deadline driving the sale (1031 exchange, divorce, estate, relocation)? That informs how much negotiation room exists.
- Schools are D-rated, which usually means shorter tenancies and higher turnover. Who's the typical renter profile here, and what's been the actual vacancy rate?
- Crime grade is F in this area — have there been break-ins, vandalism, or insurance claims at this property in the last 3 years? What carrier currently insures it and at what premium?
- The area grade is low — what's the realistic commute time and amenity access for the typical tenant pool here? Any planned neighborhood developments (good or bad) we should know about?
- What's the average days-on-market for RENTAL listings here right now (not sales)? A rising rental-DOM trend means longer vacancies and softer asking-rent achievability than the comps imply.
- What's the recent tenant-quality profile in this submarket — average credit score on applications, eviction rate, late-payment / NSF rate, and stable-employment percentage? A property-management company in the area should have these aggregated.
- How much new for-sale + rental construction is in the pipeline within 1–3 miles? Heavy new supply typically softens prices + rents 12–24 months out; constrained supply supports both.
Investment metrics
- 1% rule
- 0.72% ✗
- Cap rate
- 5.21%
- Cash-on-cash
- -3.85%
- DSCR
- 0.83
- GRM
- 11.5
CMA / ARV
- ARV (on-the-fly)
- $217,282
- Comps found
- 12
Show comp detail 12 sales within ~0.75 mi
| Address | Dist | Beds/Ba | Sqft | Sold | Price | $/sf | Match |
|---|---|---|---|---|---|---|---|
| 20 Calhoun Pl | 0.23mi | 3/2.5 (+1) | 1,800 (+1%) | 18mo | $314,000 | $174 | 65 |
| 35 Wright St | 0.29mi | 3/2.0 (+1) | 1,572 (-12%) | 5mo | $135,000 | $86 | 54 |
| 116 Mood Ave | 0.55mi | 3/2.0 (+1) | 1,910 (+7%) | 2mo | $230,000 | $120 | 52 |
| 118 Mcqueen St | 0.38mi | 3/1.0 (+1) | 1,616 (-9%) | 3mo | $117,000 | $72 | 51 |
| 24 Folsom St | 0.46mi | 3/2.0 (+1) | 1,719 (-4%) | 20mo | $209,000 | $122 | 47 |
| 108 Council St #106 | 0.42mi | 3/2.0 (+1) | 1,609 (-10%) | 10mo | $90,000 | $56 | 47 |
| 34 Chestnut St | 0.49mi | 3/2.0 (+1) | 1,701 (-4%) | 17mo | $181,000 | $106 | 46 |
| 422 Haynsworth St | 0.73mi | 3/2.0 (+1) | 1,658 (-7%) | 3mo | $225,000 | $136 | 43 |
| 10 Warren Ct | 0.60mi | 3/2.0 (+1) | 1,600 (-10%) | 6mo | $229,900 | $144 | 41 |
| 8 Warren Ct | 0.60mi | 3/2.0 (+1) | 1,564 (-12%) | 5mo | $235,000 | $150 | 39 |
| 905 Bartlette St | 0.46mi | 3/2.0 (+1) | 1,549 (-13%) | 15mo | $170,000 | $110 | 36 |
| 34 Mason Croft Dr | 0.67mi | 3/2.0 (+1) | 1,659 (-7%) | 21mo | $253,000 | $153 | 31 |
Match score weights: distance 35% · size 25% · config 20% · recency 20%. Top-matched comps best support the ARV.
Projected returns pro-forma
-3.0% appreciation · 2.55% rent growth · sell at horizon
- IRR
- -23.3%
- Equity multiple
- 0.20×
- Total profit
- $-40,079
- Equity at exit
- $26,839
- IRR
- -19.1%
- Equity multiple
- -0.00×
- Total profit
- $-50,618
- Equity at exit
- $15,563
Cash invested: $50,400 (down + closing). Projections, not guarantees.
Landlord ↔ Tenant lean methodology
- Overall (STATE)
- 90 Strongly Landlord-Friendly
- State South Carolina
- 90 Strongly Landlord-Friendly · R+6
- County
- — inherits STATE
- City
- — inherits STATE
ZIP-level market 29150
- Rents YoY
- 2.5%
- Active inventory
- 384
- Price-to-rent
- 11.5×
Monthly cashflow live
- Estimated rent
- $1,301 medium interval (Pro) →
- Mortgage (P&I)
- −$944
- Tax from tax record
- −$171 /mo · $2,053/yr
- Insurance
- −$75
- HOA
- −$0
- Vacancy / Maint / Mgmt
- −$273
- Net cashflow
- $-162
Break-even live
Sensitivity live
| Price | -10% $-60 | -5% $-111 | +0% $-162 | +5% $-213 | +10% $-264 |
|---|---|---|---|---|---|
| Rent | -10% $-265 | -5% $-213 | +0% $-162 | +5% $-110 | +10% $-59 |
| Rate | -1.0pp $-71 | -0.5pp $-116 | base $-162 | +0.5pp $-209 | +1.0pp $-256 |
UW: 25.0% down · 7.5% · 30yr · 1.5% tax · 5.0% vac · 8.0% maint · 8.0% mgmt
Financing live
Cash to close
- Down payment
- $45,000
- Closing costs
- $5,400
- Reserves months
- —
- Total cash needed
- —
Loan-product check · same deal, 3 products live
Conventional
25% down · 7.5% · 30yr
- Down + closing
- —
- Monthly P&I
- —
- Monthly cashflow
- —
- DSCR
- —
- Eligible?
- —
Personal DTI + credit; lowest rate.
DSCR
20% down · 8.5% · 30yr
- Down + closing
- —
- Monthly P&I
- —
- Monthly cashflow
- —
- DSCR
- —
- Eligible?
- —
No personal income docs; deal must DSCR.
Hard money
10% down · 12.0% · 12mo
- Down + closing
- —
- Monthly P&I
- —
- Monthly cashflow
- —
- DSCR
- —
- Eligible?
- —
Short-term bridge; refi at stabilization.
Listing history 19 events
-
2026-06-22days on market $180,000 Active 283 DOM
-
2026-06-19days on market $180,000 Active 281 DOM
-
2026-06-18days on market $180,000 Active 280 DOM
-
2026-06-17days on market $180,000 Active 279 DOM
-
2026-06-16days on market $180,000 Active 278 DOM
-
2026-06-15days on market $180,000 Active 277 DOM
-
2026-06-14days on market $180,000 Active 275 DOM
-
2026-06-13days on market $180,000 Active 274 DOM
-
2026-06-10days on market $180,000 Active 272 DOM
-
2026-06-09days on market $180,000 Active 271 DOM
-
2026-06-08days on market $180,000 Active 270 DOM
-
2026-06-07days on market $180,000 Active 269 DOM
-
2026-06-02days on market $180,000 Active 264 DOM
-
2026-06-01days on market $180,000 Active 263 DOM
-
2026-05-31days on market $180,000 Active 262 DOM
-
2026-05-30days on market $180,000 Active 261 DOM
-
2025-09-09historical $675
-
2025-08-28$180,000 Active
-
2025-08-21$675
ⓘ Source: listings_history table (triggers on properties + properties_extension) + one-shot
backfill from property_details.listing_events for pre-trigger history.
Tax reassessment forecast SC · Resets to sale price
- Current annual tax
- $2,053 · $171/mo
- Projected year-2 tax
- $2,053 · $171/mo
- Expected delta
- $0/yr ($0/mo · 0.0%)
ⓘ Screening estimate from a state-policy table — verify with the county assessor before closing.
Climate risk First Street
- Flood 4/10 Moderate FEMA zone X (unshaded) · 22% chance over 30 yrs
- Wildfire 1/10 Low
- Heat 7/10 Severe 7 d/yr ≥108°F today · 16 d/yr by 30 yrs out
- Wind 8/10 Severe 80% chance of damaging wind over 30 yrs
- Air quality 2/10 Low 2 unhealthy d/yr today · 2 by 30 yrs out
Nearby sold comps map
Loading sold comps map…
Walkable amenities ~0.75 mi
Loading nearby amenities…
Taxation est. · year 1
- Rental income
- $15,617
- − Mortgage interest
- −$10,083
- − Property taxes
- −$2,053
- − Insurance
- −$900
- − Repairs & maintenance
- −$1,249
- − Management
- −$1,249
- − Depreciation
- −$5,236
- Taxable loss
- −$5,154
- Est. tax savings @ 24.0%
- +$1,237
- After-tax cash flow
- $-706/yr
For passive investors: Depreciation is non-cash, so a rental often shows a tax loss while cash-flowing — sheltering income. Rental losses are passive: they offset passive income freely, and up to $25,000/yr can offset ordinary (W-2) income if you actively participate and your MAGI is under $100k (phasing out to $0 by $150k); unused losses carry forward. On sale, claimed depreciation is recaptured at up to 25%, and gains may owe capital-gains tax (a 1031 exchange can defer both). Figures are a year-1 estimate at your 24.0% rate — not tax advice; consult a CPA.
Schools (NCES district)
- District
- Sumter 01
- NCES district ID
- 4503902
- Math proficiency
- 18% ▼ -13.00%
- Reading proficiency
- 28% ▼ -6.00%
- Median HH income
- $40,423
- Composite
- 19.45/100
- National rank
- #8775
- State rank
- #64 of 80 in SC
Livability — Sumter
- Score
- 59/100
- State rank
- #235
- US rank
- #19754
Category grades
Schools grade is shown separately in the Schools card above.
Census & demographics
- Census place
- Sumter, SC
- County
- Sumter County · 76,912 people
- City population
- 67,992
- Metro
- Sumter, SC
- Population (ZIP)
- 38,538
- Household income
- $50,965
- Rent vs Own
- Severe rent burden
- 1136.0
Population outlook (Sumter County) Hauer SSP2
- Today (2025)
- 104,585 people
- By 2030
- 102,282 · -2.2%
- By 2040
- 96,258 · -8.0%
- By 2050
- 89,592 · -14.3%
- By 2075
- 74,715 · -28.6%
- By 2100
- 60,235 · -42.4%
Race, ethnicity, and origin ACS 2023
- Neighborhood character
- Diverse neighborhood (Simpson 0.60)
- Race & ethnicity
- Black 50% White 39% Hispanic / Latino 5% Two or more races 4% Asian 2%
- Hispanic origin (detail)
- Mexican 3% Puerto Rican 1%
- Common ancestry
- Slovak 2% Lithuanian 1% Italian 1%
- Foreign-born
- 4% · Canada, China, Vietnam
- Languages at home
- 93% English-only · Spanish 4% Other Indo-European 1% German/W. Germanic 1%
Political lean MEDSL · Sumter
- 2024 margin
- Toss-up / Even · D 51.9% · R 47.0% · Other 1.2%
- 2008→2024 swing
- -10.6pp toward R · 2008: 15.4pp · 2024: 4.9pp
- All cycles
- 2024: D+4.9 2020: D+13.0 2016: D+12.0 2012: D+17.5 2008: D+15.4
Not yet ingested
- Civics
- —
Market trends
- HPI YoY
- ▼ -100.16%
- Current HPI
- 129.032
- Rent YoY
- ▲ 2.55%
- Metro
- Sumter, SC
- State GDP YoY
- ▲ 4.51%
- F500 in state
- 2
Industry mix (Fortune 500 HQ in SC)
| Industry | F500 HQs | Revenue |
|---|---|---|
| Packaging | 1 | $7B |
|
||
Price history
3 events — show timeline
- 2025-09-09 Rental Removed $675 SBOR
- 2025-08-28 Listed $180,000 SBOR
- 2025-08-21 Listed for Rent $675 SBOR
Property tax history
+0.7%/yrLatest (2025): $2,053 · +1.4% YoY. Source: county tax records.
Cash-flow waterfall
monthlySold comps — $/sqft
last 12 mo · ≤1 miLoading sold comps…