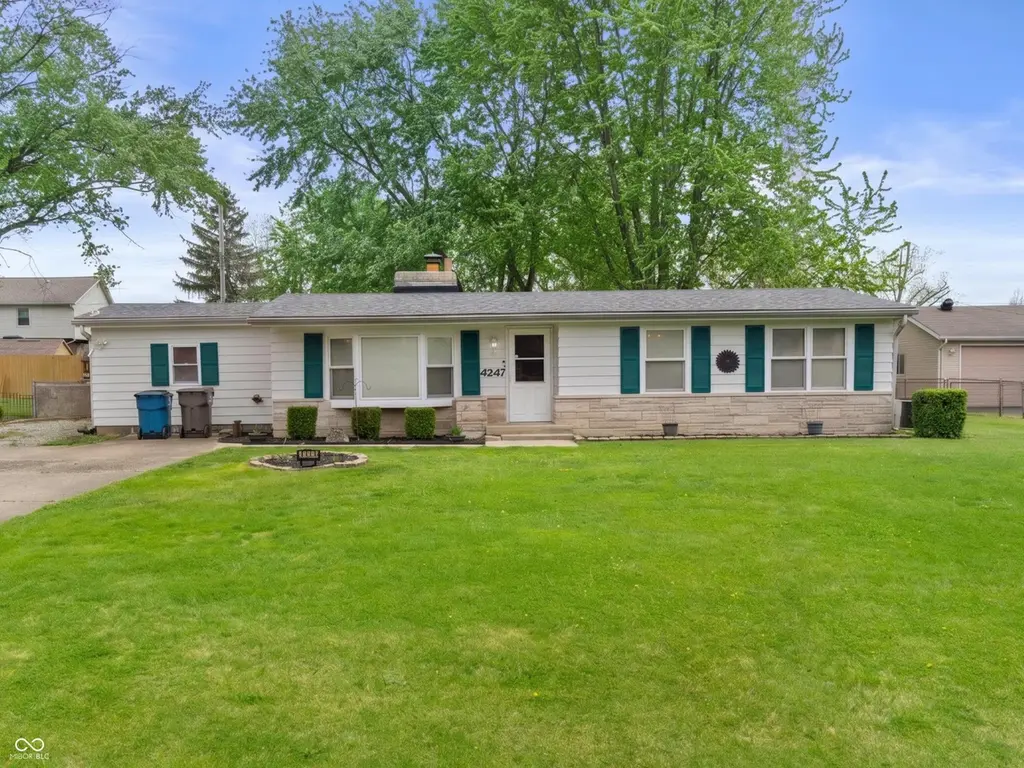
4247 S Eaton Ave · Indianapolis city (balance), IN
Flood risk 1/10 · Minimal
- FEMA flood zone
- X (unshaded)
- Chance of flooding over 30 yrs
- 0.0%
- Est. flood insurance / yr
- $507 – $1,088
Fire risk 1/10 · Minimal
- Est. fire insurance / yr
- $717 – $1,331
Heat risk 3/10 · Minor
- Hot days now (above 102°F)
- 7 days/yr
- Hot days in 30 yrs
- 19 days/yr
Wind risk 2/10 · Minimal
- Chance of severe wind over 30 yrs
- 1.0%
Air-quality risk 2/10 · Minimal
- Unhealthy air days now
- 1 days/yr
- Unhealthy air days in 30 yrs
- 2 days/yr
Risk factors via First Street. Map © Google.
Why this score? — see what drove the C grade
The composite is a weighted blend of 9 inputs, each scored 0–100. Each bar is that input's sub-score; the figure is the points it added to the 100-point composite (weight × sub-score).
- Cash flow +19.2/30.0
- ARV discount +15.0/15.0
- DSCR +6.1/10.0
- 1% rule +4.5/10.0
- Rent growth +4.0/5.0
- Schools +4.0/10.0
- Livability +2.5/5.0
- Condition / age +2.5/5.0
- Appreciation +0.0/10.0
$209,000
🖨 Deal sheet 📄 Offer letter ✓ Due diligence
Listing remarks MLS
Cute ranch on large lot with fenced rear yard & covered patio. 16x24 barn (garage size with floored attic). New roof, vaulted ceilings throughout, nice woodwork & pella windows. Large bay window in living room. Family room converted from garage, nicely done with extra bonus room & gas fireplace. Home Warranty.
Key facts
- Screened-in porch
- Newer roof
- Gas fireplace
Tags
Property features AI
Exterior
- Parking: No dedicated parking or garage
- Utilities: Municipal sewer connected; Well private water; Electricity connected; Cable available; Sewer connected
- Home design: Single-family residence; One level
- Construction: Aluminum siding with stone accents; Slab foundation
- Exterior features: Covered patio; Storage; Full yard fencing; Mature trees; Rural-subdivision lot setting (approximately 0.34 acre)
Interior
- Kitchen: Dishwasher; Microwave; Electric oven; Refrigerator; Eat-in kitchen with pantry; Electric water heater
- Bedrooms: 3 bedrooms on the main level (sizes include 11x10 and 9x10)
- Bathrooms: 2 full bathrooms (both on the main level)
- Heating & cooling: Forced air heating (electric); Central air conditioning; 2 fireplaces (family room with gas log; living room wood burning)
- Interior features: Vaulted ceilings; Stained woodwork; Eat-in kitchen; Pantry; Attic access; Utility room; Smoke alarm
- Laundry & utility: Washer and dryer; Water softener (owned); Utility room
Neighborhood map
What this means for you Summary
Snapshot
- This is a 3-bed/2.0-bath single-family listed at $209k.
Deal economics
- At list price, monthly cash flow is $226 ($3k/yr) — positive.
- The deal already cash-flows at list — no discount required.
- To meet the 1% rule (rent ≥ 1% of price), the offer needs to be $199k (4.8% below list).
- Recommended offer: $199k (4.8% below list) — sets the bar for 1% rule.
- Cap rate 7.6% vs local median 4.4% in Indianapolis city (balance) — top-decile yield for the area; either an underpriced asset or a hidden risk that comps aren't pricing in. Stress-test before assuming the spread holds.
Location & tenants
- Location reads: area grade C — affects rentability + tenant quality, not the cash-flow math above.
- Franklin Township Community School Corporation (urban): math 42% / reading 47% proficiency, ranked #87 of 301 in IN (top 29%) — families likely to look elsewhere, expect single-tenant / working-renter base with shorter leases.
- Market conditions: Rents rising fast (+6.1%/yr); 333 active listings in the ZIP; 14 comparable units currently listed for rent nearby; rentals leasing fast (median 7d on market — plan ~1-2 weeks tenant-placement turnaround); solid renter incomes; 1,906 units permitted in Marion County in 2024 (621 in 5+ unit buildings).
Forward outlook
- Local home prices are declining (-3.0%/yr); year-one equity from $1k of loan paydown is wiped out by about $6k of value loss. Plan a longer hold.
- Marion County population projected at +18% by 2050 — long-run rental-demand tailwind backs the buy-and-hold thesis.
Negotiation context
- It's been on market 24 days — a 2% lower offer ($206k) is reasonable based on typical stale-listing flexibility.
- 3 sale attempts since 23y ago with the ask held roughly flat each time — persistent listings suggest the price (not the market) is what's stuck; bring a comps-based counter.
- Current owner paid $88k; list at $209k implies a 136% gain — meaningful room to come down on a strong offer.
Risks & watch-outs
- Watch-outs: built in 1951 — expect roof / HVAC / electrical / plumbing capex.
Questions for the listing agent
- Built in 1951 — when were the roof, HVAC, electrical panel, plumbing, and water heater last replaced?
- Is there a deadline driving the sale (1031 exchange, divorce, estate, relocation)? That informs how much negotiation room exists.
- What's the average days-on-market for RENTAL listings here right now (not sales)? A rising rental-DOM trend means longer vacancies and softer asking-rent achievability than the comps imply.
- What's the recent tenant-quality profile in this submarket — average credit score on applications, eviction rate, late-payment / NSF rate, and stable-employment percentage? A property-management company in the area should have these aggregated.
- How much new for-sale + rental construction is in the pipeline within 1–3 miles? Heavy new supply typically softens prices + rents 12–24 months out; constrained supply supports both.
Investment metrics
- 1% rule
- 0.95% ✗
- Cap rate
- 7.59%
- Cash-on-cash
- 4.63%
- DSCR
- 1.21
- GRM
- 8.8
CMA / ARV
- ARV (on-the-fly)
- $254,490
- Comps found
- 12
Show comp detail 12 sales within ~0.75 mi
| Address | Dist | Beds/Ba | Sqft | Sold | Price | $/sf | Match |
|---|---|---|---|---|---|---|---|
| 4247 S Eaton Ave | 0.00mi | 3/2.0 | 1,505 (+0%) | 0mo | $195,000 | $130 | 99 |
| 4135 Kerry Dr | 0.21mi | 3/2.0 | 1,424 (-5%) | 2mo | $259,000 | $182 | 81 |
| 8431 Lawrence Ave | 0.08mi | 4/2.0 (+1) | 1,344 (-10%) | 1mo | $267,000 | $199 | 73 |
| 8742 Ballard Ln | 0.63mi | 3/2.0 | 1,449 (-3%) | 2mo | $305,000 | $210 | 64 |
| 8304 Weathervane Cir | 0.72mi | 3/2.0 | 1,516 (+1%) | 6mo | $209,000 | $138 | 59 |
| 8514 Midsummer Dr | 0.35mi | 3/2.0 | 1,650 (+10%) | 9mo | $275,000 | $167 | 59 |
| 8310 Weathervane Cir | 0.72mi | 3/2.0 | 1,502 (+0%) | 8mo | $220,000 | $146 | 59 |
| 9027 Imperial Dr | 0.60mi | 3/1.5 | 1,378 (-8%) | 0mo | $285,000 | $207 | 56 |
| 3638 Laurel Cherry Ln | 0.72mi | 3/2.0 | 1,422 (-5%) | 2mo | $225,000 | $158 | 56 |
| 4728 S Eaton Ave | 0.43mi | 3/2.0 | 1,642 (+10%) | 10mo | $316,000 | $192 | 56 |
| 3923 Wildwood Dr | 0.60mi | 3/1.5 | 1,625 (+9%) | 2mo | $235,000 | $145 | 54 |
| 4153 Ballybay Ln | 0.69mi | 3/2.0 | 1,563 (+4%) | 9mo | $265,000 | $170 | 53 |
Match score weights: distance 35% · size 25% · config 20% · recency 20%. Top-matched comps best support the ARV.
Projected returns pro-forma
-3.0% appreciation · 6.11% rent growth · sell at horizon
- IRR
- -5.8%
- Equity multiple
- 0.78×
- Total profit
- $-13,093
- Equity at exit
- $31,163
- IRR
- 7.0%
- Equity multiple
- 1.60×
- Total profit
- $35,072
- Equity at exit
- $18,071
Cash invested: $58,520 (down + closing). Projections, not guarantees.
Landlord ↔ Tenant lean methodology
- Overall (STATE)
- 90 Strongly Landlord-Friendly
- State Indiana
- 90 Strongly Landlord-Friendly · R+11
- County
- — inherits STATE
- City
- — inherits STATE
ZIP-level market 46239
- Home prices YoY
- -29.2%
- Rents YoY
- 6.1%
- Active inventory
- 333
- Price-to-rent
- 8.8×
Monthly cashflow live
- Estimated rent
- $1,989 high interval (Pro) →
- Mortgage (P&I)
- −$1,096
- Tax from tax record
- −$162 /mo · $1,946/yr
- Insurance
- −$87
- HOA
- −$0
- Vacancy / Maint / Mgmt
- −$418
- Net cashflow
- $226
Break-even live
UW: 25.0% down · 7.5% · 30yr · 1.5% tax · 5.0% vac · 8.0% maint · 8.0% mgmt
Financing live
Cash to close
- Down payment
- $52,250
- Closing costs
- $6,270
- Reserves months
- —
- Total cash needed
- —
Loan-product check · same deal, 3 products live
Conventional
25% down · 7.5% · 30yr
- Down + closing
- —
- Monthly P&I
- —
- Monthly cashflow
- —
- DSCR
- —
- Eligible?
- —
Personal DTI + credit; lowest rate.
DSCR
20% down · 8.5% · 30yr
- Down + closing
- —
- Monthly P&I
- —
- Monthly cashflow
- —
- DSCR
- —
- Eligible?
- —
No personal income docs; deal must DSCR.
Hard money
10% down · 12.0% · 12mo
- Down + closing
- —
- Monthly P&I
- —
- Monthly cashflow
- —
- DSCR
- —
- Eligible?
- —
Short-term bridge; refi at stabilization.
Rent comps 14 comps
| Address | Beds | Baths | Sqft | Rent | $/sqft | DOM | Units | Dist |
|---|---|---|---|---|---|---|---|---|
| 8520 Sierra Ridge Dr Indianapolis, IN | 2.0–3.0 | 2.0 | 1091 | $1,775 | $1.63 | 1d | 18 | 0.52mi |
| 4127 S Post Rd Indianapolis, IN | 3.0 | 2.0 | 1460 | $1,585 | $1.09 | 23d | 1 | 0.63mi |
| 3718 Laurel Cherry Ln Indianapolis, IN | 3.0 | 2.0 | 1368 | $1,695 | $1.24 | 23d | 1 | 0.64mi |
| 7650 Lara Lee Dr Indianapolis, IN | 4.0 | 2.0 | 1696 | $2,039 | $1.20 | 23d | 1 | 0.66mi |
| 8836 Kipling Dr Indianapolis, IN | 4.0 | 2.5 | 1686 | $2,200 | $1.30 | 23d | 1 | 0.93mi |
| 8544 Sweet Birch Dr Indianapolis, IN | 3.0 | 2.0 | 1209 | $1,700 | $1.41 | 2d | 1 | 1.01mi |
| 8123 Fisher Bend Dr Indianapolis, IN | 4.0 | 2.5 | 1633 | $1,931 | $1.18 | 1d | 1 | 1.06mi |
| 5325 Montavia Ln Indianapolis, IN | 3.0 | 2.0 | 1632 | $1,849 | $1.13 | 23d | 1 | 1.18mi |
| 3203 Brandenburg Dr Indianapolis, IN | 4.0 | 2.5 | 1486 | $1,869 | $1.26 | 2d | 1 | 1.26mi |
| 9237 Kavanaugh Dr Indianapolis, IN | 3.0 | 2.0 | 1503 | $2,200 | $1.46 | 17d | 1 | 1.27mi |
| 3149 Brandenburg Dr Indianapolis, IN | 4.0 | 2.5 | 1486 | $1,885 | $1.27 | 3d | 1 | 1.27mi |
| 3146 Brandenburg Dr Indianapolis, IN | 3.0 | 2.0 | 1200 | $1,689 | $1.41 | 2d | 1 | 1.29mi |
| 5602 Wild Horse Dr Indianapolis, IN | 3.0 | 2.0 | 1616 | $1,911 | $1.18 | 7d | 1 | 1.33mi |
| 3143 Danube Way Indianapolis, IN | 3.0 | 2.5 | 1792 | $2,050 | $1.14 | 1d | 1 | 1.33mi |
Listing history 8 events
-
2026-05-11status Pending
-
2026-05-05price $209,000
-
2026-04-16$219,000 Active
-
2014-03-25historical 323-char remark
Show marketing remark (323 chars)
Cute ranch on large lot with fenced rear yard & covered patio. 16x24 barn (garage size with floored attic). New roof, vaulted ceilings throughout, nice woodwork & pella windows. Large bay window in living room. Family room converted from garage, nicely done with extra bonus room & gas fireplace. Home Warranty.
-
2014-03-21soldstatus $88,400 323-char remark
Show marketing remark (323 chars)
Cute ranch on large lot with fenced rear yard & covered patio. 16x24 barn (garage size with floored attic). New roof, vaulted ceilings throughout, nice woodwork & pella windows. Large bay window in living room. Family room converted from garage, nicely done with extra bonus room & gas fireplace. Home Warranty.
-
2013-09-04$89,900 323-char remark
Show marketing remark (323 chars)
Cute ranch on large lot with fenced rear yard & covered patio. 16x24 barn (garage size with floored attic). New roof, vaulted ceilings throughout, nice woodwork & pella windows. Large bay window in living room. Family room converted from garage, nicely done with extra bonus room & gas fireplace. Home Warranty.
-
2003-07-11soldstatus $95,000 369-char remark
Show marketing remark (369 chars)
Super sharp meticulously maintained home. Newer roof, carpets, water heater & more. Pella windows. Wood laminate flooring. Cathedral ceilings thru-out. Bay window in living room. Built-in microwave. Woodburning fireplac e. Gigantic storage barn w/floored attic. large full rear fenced yard w/covered patio. Home warranty included. What a super home. Priced to sell.
-
2003-04-28$95,000 369-char remark
Show marketing remark (369 chars)
Super sharp meticulously maintained home. Newer roof, carpets, water heater & more. Pella windows. Wood laminate flooring. Cathedral ceilings thru-out. Bay window in living room. Built-in microwave. Woodburning fireplac e. Gigantic storage barn w/floored attic. large full rear fenced yard w/covered patio. Home warranty included. What a super home. Priced to sell.
ⓘ Source: listings_history table (triggers on properties + properties_extension) + one-shot
backfill from property_details.listing_events for pre-trigger history.
Tax reassessment forecast IN · Partial reset (capped growth)
- Current annual tax
- $1,946 · $162/mo
- Projected year-2 tax
- $1,946 · $162/mo
- Expected delta
- $0/yr ($0/mo · 0.0%)
ⓘ Screening estimate from a state-policy table — verify with the county assessor before closing.
Climate risk First Street
- Flood 1/10 Low FEMA zone X (unshaded) · 0% chance over 30 yrs
- Wildfire 1/10 Low
- Heat 3/10 Moderate 7 d/yr ≥102°F today · 19 d/yr by 30 yrs out
- Wind 2/10 Low 100% chance of damaging wind over 30 yrs
- Air quality 2/10 Low 1 unhealthy d/yr today · 2 by 30 yrs out
Nearby sold comps map
Loading sold comps map…
Walkable amenities ~0.75 mi
Loading nearby amenities…
Taxation est. · year 1
- Rental income
- $23,866
- − Mortgage interest
- −$11,707
- − Property taxes
- −$1,946
- − Insurance
- −$1,045
- − Repairs & maintenance
- −$1,909
- − Management
- −$1,909
- − Depreciation
- −$6,080
- Taxable loss
- −$731
- Est. tax savings @ 24.0%
- +$175
- After-tax cash flow
- $2,886/yr
For passive investors: Depreciation is non-cash, so a rental often shows a tax loss while cash-flowing — sheltering income. Rental losses are passive: they offset passive income freely, and up to $25,000/yr can offset ordinary (W-2) income if you actively participate and your MAGI is under $100k (phasing out to $0 by $150k); unused losses carry forward. On sale, claimed depreciation is recaptured at up to 25%, and gains may owe capital-gains tax (a 1031 exchange can defer both). Figures are a year-1 estimate at your 24.0% rate — not tax advice; consult a CPA.
Schools (NCES district)
- District
- Franklin Township Community School Corporation
- NCES district ID
- 1803750
- Math proficiency
- 42% ▼ -12.00%
- Reading proficiency
- 47% ▼ -6.00%
- Median HH income
- $67,825
- Composite
- 39.91/100
- National rank
- #3852
- State rank
- #87 of 301 in IN
Livability — Indianapolis city (balance)
No livability data for this city. (Only ~50 U.S. cities are tracked.)
Census & demographics
- Census place
- Indianapolis city (balance), IN
- County
- Marion County · 998,460 people
- City population
- 881,119
- Metro
- Indianapolis-Carmel-Anderson, IN
- Population (ZIP)
- 33,931
- Household income
- $100,331
- Rent vs Own
- Severe rent burden
- 567.0
Population outlook (Marion County) Hauer SSP2
- Today (2025)
- 1,025,572 people
- By 2030
- 1,065,727 · +3.9%
- By 2040
- 1,141,577 · +11.3%
- By 2050
- 1,208,920 · +17.9%
- By 2075
- 1,367,288 · +33.3%
- By 2100
- 1,438,201 · +40.2%
Race, ethnicity, and origin ACS 2023
- Neighborhood character
- Diverse neighborhood (Simpson 0.61)
- Race & ethnicity
- White 57% Black 24% Hispanic / Latino 9% Two or more races 9% Asian 4%
- Hispanic origin (detail)
- Mexican 6%
- Common ancestry
- Lithuanian 2% Slovak 2% Romanian 1%
- Foreign-born
- 7% · Canada, Philippines, China
- Languages at home
- 89% English-only · Spanish 6% Other Indo-European 2% Chinese 1%
Political lean MEDSL · Marion
- 2024 margin
- Strong D (+27.7) · D 63.0% · R 35.3% · Other 1.7%
- 2008→2024 swing
- -0.7pp no change · 2008: 28.4pp · 2024: 27.7pp
- All cycles
- 2024: D+27.7 2020: D+29.1 2016: D+22.8 2012: D+22.2 2008: D+28.4
Not yet ingested
- Civics
- —
Market trends
- HPI YoY
- ▼ -93.15%
- Current HPI
- 226.1965
- Rent YoY
- ▲ 6.11%
- Metro
- Indianapolis-Carmel-Anderson, IN
- State GDP YoY
- ▲ 2.90%
- F500 in state
- 18
Industry mix (Fortune 500 HQ in IN)
| Industry | F500 HQs | Revenue |
|---|---|---|
| Industrial Machinery | 2 | $37B |
|
||
| Healthcare | 1 | $177B |
|
||
| Pharmaceuticals | 1 | $45B |
|
||
| Metals / Steel | 1 | $18B |
|
||
| Agriculture | 1 | $17B |
|
||
| Packaging | 1 | $12B |
|
||
Price history
+120.0% since first listed8 events — show timeline
- 2026-05-11 Pending — MIBOR as Distributed by MLS Grid
- 2026-05-05 Price Changed $209,000 MIBOR as Distributed by MLS Grid
- 2026-04-16 Listed $219,000 MIBOR as Distributed by MLS Grid
- 2014-03-25 Listing Removed — MIBOR as Distributed by MLS Grid
- 2014-03-21 Sold (MLS) $88,400 MIBOR as Distributed by MLS Grid
- 2013-09-04 Listed $89,900 MIBOR as Distributed by MLS Grid
- 2003-07-11 Sold (MLS) $95,000 MIBOR as Distributed by MLS Grid
- 2003-04-28 Listed $95,000 MIBOR as Distributed by MLS Grid
Property tax history
+1.6%/yrLatest (2025): $1,946 · -6.5% YoY. Source: county tax records.
Cash-flow waterfall
monthlySold comps — $/sqft
last 12 mo · ≤1 miLoading sold comps…