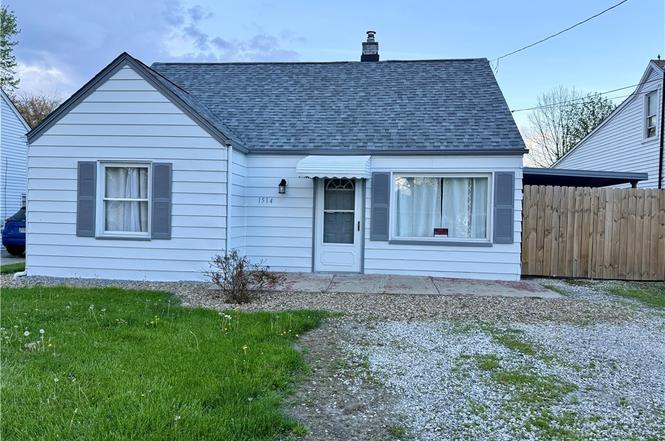
1514 Thalia Ave · Youngstown, OH
Flood risk 1/10 · Minimal
- FEMA flood zone
- X (unshaded)
- Chance of flooding over 30 yrs
- 0.0%
- Est. flood insurance / yr
- $507 – $1,088
Fire risk 1/10 · Minimal
- Est. fire insurance / yr
- $713 – $1,323
Heat risk 3/10 · Minor
- Hot days now (above 97°F)
- 7 days/yr
- Hot days in 30 yrs
- 17 days/yr
Wind risk 1/10 · Minimal
- Chance of severe wind over 30 yrs
- —
Air-quality risk 3/10 · Minor
- Unhealthy air days now
- 1 days/yr
- Unhealthy air days in 30 yrs
- 4 days/yr
Risk factors via First Street. Map © Google.
Why this score? — see what drove the C grade
The composite is a weighted blend of 9 inputs, each scored 0–100. Each bar is that input's sub-score; the figure is the points it added to the 100-point composite (weight × sub-score).
- Cash flow +24.6/30.0
- ARV discount +11.6/15.0
- DSCR +7.9/10.0
- 1% rule +5.5/10.0
- Livability +4.0/5.0
- Rent growth +2.5/5.0
- Condition / age +2.5/5.0
- Schools +0.9/10.0
- Appreciation +0.0/10.0
$125,000
🖨 Deal sheet 📄 Offer letter ✓ Due diligence
Listing remarks MLS
Three bedroom cape cod with two bedrooms on the main floor and one upstairs that could be split in two if needed. Large partially fenced backyard, carport, shed, and new roof complete tear off in 2022.
Key facts
- Tiled walk-in shower
- Remodeled bathroom
- New carpet
Tags
Property features AI
Finance
- Other: Home warranty included
- Financial info: Annual taxes listed (see broker for details)
Exterior
- Parking: No garage; unpaved parking
- Utilities: Public water service; Public sewer
- Home design: Single-story home; Entry level on main floor
- Construction: Aluminum siding; Asphalt/fiberglass roof; Slab foundation; Built according to public records
- Exterior features: Public water; Public sewer; Lot approximately 0.172 acres
Interior
- Bedrooms: 2 main-level bedrooms
- Bathrooms: 1 full bathroom on the main level
- Heating & cooling: Forced-air gas heating
- Interior features: 5 total rooms
Neighborhood map
What this means for you Summary
Snapshot
- This is a 3-bed/1.0-bath single-family listed at $125k.
Deal economics
- At list price, monthly cash flow is $257 ($3k/yr) — positive.
- The deal already cash-flows at list — no discount required.
- Meets the 1% rule at list price ($1k rent vs $125k).
- Recommended offer: $110k (12.0% below list) — sets the bar for market timing.
- Cap rate 8.8% vs local median 7.0% in Youngstown — meaningfully above typical; check what's discounted (condition, days-on-market, listing class) to confirm the premium yield is real.
Location & tenants
- Location reads 81/100 on livability (#99 in OH, #1,506 nationally) — a professional / high-income tenant draw. Strengths: amenities A+, commute A+, cost of living A+; Watch: crime F, employment F.
- Youngstown City (urban): math 8% / reading 17% proficiency, ranked #649 of 656 in OH (top 99%) — low school quality limits family demand, transient renter base, plan for 1-2y turnover; 88% free/reduced lunch — lower-income household profile, screen leases tightly.
- Market conditions: 155 active listings in the ZIP; 11 comparable units currently listed for rent nearby; rentals lingering (median 44d on market — plan ~5-8 weeks vacancy on turnover, expect pricing pressure); 55% of comp listings sitting > 30 days — soft ceiling on asking rent; solid renter incomes; 147 units permitted in Mahoning County in 2024 (0 in 5+ unit buildings).
Forward outlook
- Local home prices are declining (-3.0%/yr); year-one equity from $864 of loan paydown is wiped out by about $4k of value loss. Plan a longer hold.
- Mahoning County population projected at -14% by 2050 — secular population decline; favor cash flow + early exit over multi-decade hold.
Negotiation context
- It's been on market 197 days — a 12% lower offer ($110k) is reasonable based on typical stale-listing flexibility.
- 4 sale attempts since 18y ago with the ask held roughly flat each time — persistent listings suggest the price (not the market) is what's stuck; bring a comps-based counter.
- Current owner paid $42k; list at $125k implies a 200% gain — meaningful room to come down on a strong offer.
Risks & watch-outs
- Watch-outs: built in 1958 — expect roof / HVAC / electrical / plumbing capex.
Questions for the listing agent
- It's been on market 197 days. Have you received any prior offers? Is the seller open to a 12% concession, seller financing, or rate buy-down credit?
- Built in 1958 — when were the roof, HVAC, electrical panel, plumbing, and water heater last replaced?
- Why hasn't it sold? Are there any deal-killer items the seller is aware of (foundation, flood, title, zoning, code violations)?
- Is there a deadline driving the sale (1031 exchange, divorce, estate, relocation)? That informs how much negotiation room exists.
- Crime grade is F in this area — have there been break-ins, vandalism, or insurance claims at this property in the last 3 years? What carrier currently insures it and at what premium?
- What's the average days-on-market for RENTAL listings here right now (not sales)? A rising rental-DOM trend means longer vacancies and softer asking-rent achievability than the comps imply.
- What's the recent tenant-quality profile in this submarket — average credit score on applications, eviction rate, late-payment / NSF rate, and stable-employment percentage? A property-management company in the area should have these aggregated.
- How much new for-sale + rental construction is in the pipeline within 1–3 miles? Heavy new supply typically softens prices + rents 12–24 months out; constrained supply supports both.
Investment metrics
- 1% rule
- 1.05% ✓
- Cap rate
- 8.76%
- Cash-on-cash
- 8.83%
- DSCR
- 1.39
- GRM
- 8.0
CMA / ARV
- ARV (on-the-fly)
- $137,616
- Comps found
- 12
Show comp detail 12 sales within ~0.75 mi
| Address | Dist | Beds/Ba | Sqft | Sold | Price | $/sf | Match |
|---|---|---|---|---|---|---|---|
| 1720 Sequoya Dr | 0.22mi | 3/2.0 | 1,044 (-7%) | 4mo | $168,000 | $161 | 70 |
| 1562 Medford Ave | 0.47mi | 3/1.0 | 1,170 (+4%) | 3mo | $129,156 | $110 | 69 |
| 1928 Palo Verde Dr | 0.45mi | 3/1.0 | 1,074 (-5%) | 3mo | $130,000 | $121 | 69 |
| 1654 Thalia Ave | 0.25mi | 3/1.0 | 984 (-13%) | 3mo | $56,250 | $57 | 65 |
| 1830 Halbert Dr | 0.49mi | 3/1.5 | 1,168 (+4%) | 6mo | $182,500 | $156 | 64 |
| 1646 Everett Ave | 0.64mi | 4/1.0 (+1) | 1,152 (+2%) | 3mo | $100,000 | $87 | 59 |
| 5522 Sheridan Rd | 0.70mi | 3/1.0 | 1,084 (-4%) | 3mo | $225,000 | $208 | 58 |
| 2002 Bancroft Ave | 0.59mi | 3/2.0 | 1,080 (-4%) | 4mo | $131,500 | $122 | 58 |
| 1633 Everett Ave | 0.60mi | 3/1.0 | 1,202 (+7%) | 5mo | $125,000 | $104 | 57 |
| 1925 Weston Ave | 0.65mi | 3/1.0 | 1,227 (+9%) | 1mo | $89,000 | $73 | 54 |
| 1919 Wingate Rd | 0.69mi | 3/2.0 | 1,190 (+6%) | 5mo | $170,000 | $143 | 51 |
| 1737 Halbert Dr | 0.50mi | 3/1.0 | 960 (-15%) | 3mo | $167,000 | $174 | 50 |
Match score weights: distance 35% · size 25% · config 20% · recency 20%. Top-matched comps best support the ARV.
Projected returns pro-forma
-3.0% appreciation · 3.0% rent growth · sell at horizon
- IRR
- -3.0%
- Equity multiple
- 0.89×
- Total profit
- $-3,891
- Equity at exit
- $18,638
- IRR
- 6.7%
- Equity multiple
- 1.50×
- Total profit
- $17,588
- Equity at exit
- $10,808
Cash invested: $35,000 (down + closing). Projections, not guarantees.
Landlord ↔ Tenant lean methodology
- Overall (STATE)
- 73 Landlord-Friendly
- State Ohio
- 73 Landlord-Friendly · R+6
- County
- — inherits STATE
- City
- — inherits STATE
ZIP-level market 44514
- Home prices YoY
- -23.8%
- Active inventory
- 155
- Price-to-rent
- 8.0×
Monthly cashflow live
- Estimated rent
- $1,308 high interval (Pro) →
- Mortgage (P&I)
- −$656
- Tax from tax record
- −$68 /mo · $817/yr
- Insurance
- −$52
- HOA
- −$0
- Vacancy / Maint / Mgmt
- −$275
- Net cashflow
- $257
Break-even live
UW: 25.0% down · 7.5% · 30yr · 1.5% tax · 5.0% vac · 8.0% maint · 8.0% mgmt
Financing live
Cash to close
- Down payment
- $31,250
- Closing costs
- $3,750
- Reserves months
- —
- Total cash needed
- —
Loan-product check · same deal, 3 products live
Conventional
25% down · 7.5% · 30yr
- Down + closing
- —
- Monthly P&I
- —
- Monthly cashflow
- —
- DSCR
- —
- Eligible?
- —
Personal DTI + credit; lowest rate.
DSCR
20% down · 8.5% · 30yr
- Down + closing
- —
- Monthly P&I
- —
- Monthly cashflow
- —
- DSCR
- —
- Eligible?
- —
No personal income docs; deal must DSCR.
Hard money
10% down · 12.0% · 12mo
- Down + closing
- —
- Monthly P&I
- —
- Monthly cashflow
- —
- DSCR
- —
- Eligible?
- —
Short-term bridge; refi at stabilization.
Rent comps 11 comps
| Address | Beds | Baths | Sqft | Rent | $/sqft | DOM | Units | Dist |
|---|---|---|---|---|---|---|---|---|
| 929 Cook Ave Unit 1 Youngstown, OH | 2.0 | 1.0 | 700 | $850 | $1.21 | 43d | 1 | 0.82mi |
| 610 Elm St Struthers, OH | 3.0 | 1.0 | 1050 | $1,500 | $1.43 | 13d | 1 | 0.84mi |
| 1803 Pointview Ave Youngstown, OH | 2.0 | 1.0 | 950 | $1,000 | $1.05 | 43d | 1 | 0.85mi |
| 1914 S Heights Ave Youngstown, OH | 3.0 | 1.0 | 1115 | $1,950 | $1.75 | 43d | 1 | 0.86mi |
| 851 Cook Ave Unit 4 Youngstown, OH | 2.0 | 1.0 | 1050 | $800 | $0.76 | 43d | 1 | 0.89mi |
| 3446 Ambert Ave Youngstown, OH | 4.0 | 1.0 | 1100 | $1,250 | $1.14 | 13d | 1 | 1.02mi |
| 457 Mathews Rd Boardman, OH | 3.0 | 1.0 | 1200 | $1,300 | $1.08 | 43d | 1 | 1.16mi |
| 6300 South Ave Youngstown, OH | 1.0–2.0 | 1.0–2.0 | 743 | $950 | $1.28 | 13d | 1 | 1.17mi |
| 2523 E Midlothian Blvd Apt 5 Struthers, OH | 2.0 | 1.0 | 750 | $800 | $1.07 | 13d | 1 | 1.18mi |
| 413 Mathews Rd Boardman, OH | 2.0 | 1.0 | 1000 | $1,200 | $1.20 | 43d | 1 | 1.23mi |
| 158 Beechwood Dr Youngstown, OH | 3.0 | 1.5 | 1438 | $1,100 | $0.76 | 13d | 1 | 1.41mi |
Listing history 25 events
-
2026-06-19days on market $125,000 Active 197 DOM
-
2026-06-18days on market $125,000 Active 196 DOM
-
2026-06-17days on market $125,000 Active 195 DOM
-
2026-06-16days on market $125,000 Active 194 DOM
-
2026-06-15days on market $125,000 Active 193 DOM
-
2026-06-14days on market $125,000 Active 191 DOM
-
2026-06-13days on market $125,000 Active 190 DOM
-
2026-06-10days on market $125,000 Active 188 DOM
-
2026-06-09days on market $125,000 Active 187 DOM
-
2026-06-08days on market $125,000 Active 186 DOM
-
2026-06-07days on market $125,000 Active 185 DOM
-
2026-06-03days on market $125,000 Active 181 DOM
-
2026-06-02days on market $125,000 Active 180 DOM
-
2026-06-01days on market $125,000 Active 179 DOM
-
2026-05-31days on market $125,000 Active 178 DOM
-
2026-05-30days on market $125,000 Active 177 DOM
-
2026-03-06price $125,000
-
2025-12-03$130,000 Active
-
2023-11-30soldstatus $41,700 Closed 201-char remark
Show marketing remark (201 chars)
Three bedroom cape cod with two bedrooms on the main floor and one upstairs that could be split in two if needed. Large partially fenced backyard, carport, shed, and new roof complete tear off in 2022.
-
2023-11-19status Pending 201-char remark
Show marketing remark (201 chars)
Three bedroom cape cod with two bedrooms on the main floor and one upstairs that could be split in two if needed. Large partially fenced backyard, carport, shed, and new roof complete tear off in 2022.
-
2023-11-16$49,999 Active 201-char remark
Show marketing remark (201 chars)
Three bedroom cape cod with two bedrooms on the main floor and one upstairs that could be split in two if needed. Large partially fenced backyard, carport, shed, and new roof complete tear off in 2022.
-
2011-06-24soldstatus $11,050 131-char remark
Show marketing remark (131 chars)
Alum/ frame cape with rear enclosed porch and utility room. Covered carport, rear fenced yard and shed. Finished 2nd floor bedroom.
-
2011-05-25$10,500 131-char remark
Show marketing remark (131 chars)
Alum/ frame cape with rear enclosed porch and utility room. Covered carport, rear fenced yard and shed. Finished 2nd floor bedroom.
-
2008-08-13historical
-
2008-08-12$68,900
ⓘ Source: listings_history table (triggers on properties + properties_extension) + one-shot
backfill from property_details.listing_events for pre-trigger history.
Tax reassessment forecast OH · Partial reset (capped growth)
- Current annual tax
- $817 · $68/mo
- Projected year-2 tax
- $1,383 · $115/mo
- Expected delta
- +$567/yr (+$47/mo · 69.4%)
ⓘ Screening estimate from a state-policy table — verify with the county assessor before closing.
Climate risk First Street
- Flood 1/10 Low FEMA zone X (unshaded) · 0% chance over 30 yrs
- Wildfire 1/10 Low
- Heat 3/10 Moderate 7 d/yr ≥97°F today · 17 d/yr by 30 yrs out
- Wind 1/10 Low
- Air quality 3/10 Moderate 1 unhealthy d/yr today · 4 by 30 yrs out
Nearby sold comps map
Loading sold comps map…
Walkable amenities ~0.75 mi
Loading nearby amenities…
Taxation est. · year 1
- Rental income
- $15,693
- − Mortgage interest
- −$7,002
- − Property taxes
- −$817
- − Insurance
- −$625
- − Repairs & maintenance
- −$1,255
- − Management
- −$1,255
- − Depreciation
- −$3,636
- Taxable income
- $1,102
- Est. tax owed @ 24.0%
- −$265
- After-tax cash flow
- $2,825/yr
For passive investors: Depreciation is non-cash, so a rental often shows a tax loss while cash-flowing — sheltering income. Rental losses are passive: they offset passive income freely, and up to $25,000/yr can offset ordinary (W-2) income if you actively participate and your MAGI is under $100k (phasing out to $0 by $150k); unused losses carry forward. On sale, claimed depreciation is recaptured at up to 25%, and gains may owe capital-gains tax (a 1031 exchange can defer both). Figures are a year-1 estimate at your 24.0% rate — not tax advice; consult a CPA.
Schools (NCES district)
- District
- Youngstown City
- NCES district ID
- 3904516
- Math proficiency
- 8% ▼ -15.00%
- Reading proficiency
- 17% ▼ -10.00%
- Median HH income
- $25,257
- Composite
- 9.29/100
- National rank
- #9858
- State rank
- #649 of 656 in OH
Livability — Youngstown
- Score
- 81/100
- State rank
- #99
- US rank
- #1506
Category grades
Schools grade is shown separately in the Schools card above.
Census & demographics
- Census place
- Youngstown, OH
- County
- Mahoning County · 84,956 people
- City population
- 28,503
- Metro
- Youngstown-Warren-Boardman, OH-PA
- Population (ZIP)
- 23,917
- Household income
- $79,808
- Rent vs Own
- Severe rent burden
- 411.0
Population outlook (Mahoning County) Hauer SSP2
- Today (2025)
- 223,932 people
- By 2030
- 218,387 · -2.5%
- By 2040
- 205,367 · -8.3%
- By 2050
- 193,606 · -13.5%
- By 2075
- 173,694 · -22.4%
- By 2100
- 151,147 · -32.5%
Race, ethnicity, and origin ACS 2023
- Neighborhood character
- Predominantly White (91%)
- Race & ethnicity
- White 91% Two or more races 4% Hispanic / Latino 3% Black 2%
- Common ancestry
- Romanian 6% Slovak 2% Lithuanian 2%
- Foreign-born
- 2% · Canada
- Languages at home
- 95% English-only · Other Indo-European 2% Spanish 2%
Political lean MEDSL · Mahoning
- 2024 margin
- Lean R (+9.4) · D 44.9% · R 54.4%
- 2008→2024 swing
- -36.1pp toward R · 2008: 26.6pp · 2024: -9.4pp
- All cycles
- 2024: R+9.4 2020: R+1.9 2016: D+3.0 2012: D+27.7 2008: D+26.6
Not yet ingested
- Civics
- —
Market trends
- HPI YoY
- ▼ -65.78%
- Current HPI
- 210.5511
- Rent YoY
- —
- Metro
- Youngstown-Warren-Boardman, OH-PA
- State GDP YoY
- ▲ 1.98%
- F500 in state
- 48
Industry mix (Fortune 500 HQ in OH)
| Industry | F500 HQs | Revenue |
|---|---|---|
| Insurance | 3 | $145B |
|
||
| Industrial Machinery | 3 | $49B |
|
||
| Financial Services | 3 | $24B |
|
||
| Consumer Goods | 2 | $93B |
|
||
| Aerospace / Defense | 2 | $47B |
|
||
| Utilities | 2 | $33B |
|
||
Price history
+81.4% since first listed9 events — show timeline
- 2026-03-06 Price Changed $125,000 MLSNOW
- 2025-12-03 Listed $130,000 MLSNOW
- 2023-11-30 Sold (MLS) $41,700 MLSNOW
- 2023-11-19 Pending — MLSNOW
- 2023-11-16 Listed $49,999 MLSNOW
- 2011-06-24 Sold (MLS) $11,050 MLSNOW
- 2011-05-25 Listed $10,500 MLSNOW
- 2008-08-13 Listing Removed — MLSNOW
- 2008-08-12 Listed $68,900 MLSNOW
Property tax history
+1.4%/yrLatest (2025): $817 · +10.8% YoY. Source: county tax records.
Cash-flow waterfall
monthlySold comps — $/sqft
last 12 mo · ≤1 miLoading sold comps…