181 Boston Post Rd E #66 · Marlborough, MA
Flood risk No data
- FEMA flood zone
- —
- Chance of flooding over 30 yrs
- —
- Est. flood insurance / yr
- —
Fire risk No data
- Est. fire insurance / yr
- —
Heat risk 5/10 · Moderate
- Hot days now (above threshold)
- 7 days/yr
- Hot days in 30 yrs
- 15 days/yr
Wind risk No data
- Chance of severe wind over 30 yrs
- —
Air-quality risk 2/10 · Minimal
- Unhealthy air days now
- 1 days/yr
- Unhealthy air days in 30 yrs
- 2 days/yr
Risk factors via First Street. Map © Google.
Why this score? — see what drove the C+ grade
The composite is a weighted blend of 9 inputs, each scored 0–100. Each bar is that input's sub-score; the figure is the points it added to the 100-point composite (weight × sub-score).
- Cash flow +20.2/30.0
- ARV discount +15.0/15.0
- 1% rule +10.0/10.0
- DSCR +6.4/10.0
- Livability +3.8/5.0
- Condition / age +3.8/5.0
- Rent growth +2.8/5.0
- Schools +2.7/10.0
- Appreciation +0.0/10.0
$99,000
🖨 Deal sheet 📄 Offer letter ✓ Due diligence
Listing remarks MLS
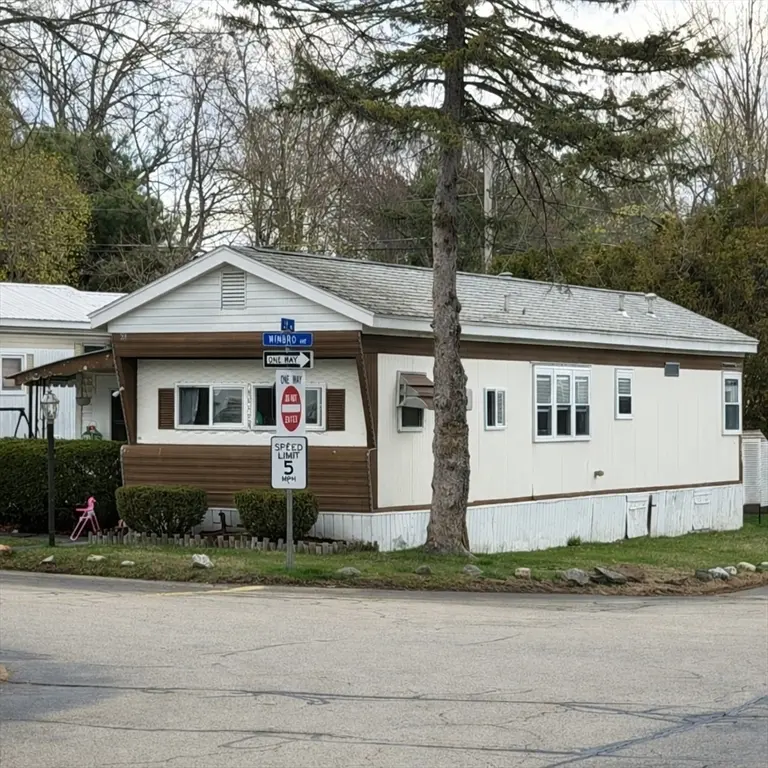
Well-maintained 2-bedroom, 1-bath unit offering a solid opportunity for investors or owner-occupants. Currently rented at $2,100/month, providing immediate income. The unit offers a practical layout with everything in working order and good overall functionality.Tenants pay all utilities, helping to keep operating costs more predictable. Conveniently located with easy access to local amenities, shopping, and major routes.Monthly HOA fee is $1,065, covering common expenses and exterior maintenance. A straightforward property with stable income potential and room for future value.
Key facts
- 2 parking spots
- Built 1964
- Listed 62 days
Neighborhood map
What this means for you Summary
Snapshot
- This is a 2-bed/1.0-bath manufactured listed at $99k. Condition is rated good.
Deal economics
- At list price, monthly cash flow is $125 ($2k/yr) — positive.
- The deal already cash-flows at list — no discount required.
- Meets the 1% rule at list price ($2k rent vs $99k).
- Recommended offer: $93k (6.0% below list) — sets the bar for market timing.
- Cap rate 7.8% vs local median 3.4% in Marlborough — top-decile yield for the area; either an underpriced asset or a hidden risk that comps aren't pricing in. Stress-test before assuming the spread holds.
Location & tenants
- Location reads 76/100 on livability (#59 in MA, #3,372 nationally) — a middle-class / working-renter tenant base. Strengths: employment A+, housing A+, health & safety A+; Watch: crime C-, amenities F, cost of living F.
- Marlborough (suburban): math 23% / reading 34% proficiency, ranked #250 of 302 in MA (top 83%) — low school quality limits family demand, transient renter base, plan for 1-2y turnover.
- Market conditions: Rents rising (+1.2%/yr); 62 active listings in the ZIP; 5 comparable units currently listed for rent nearby; rentals leasing fast (median 2d on market — plan ~1-2 weeks tenant-placement turnaround); solid renter incomes; 3,670 units permitted in Middlesex County in 2024 (2,611 in 5+ unit buildings).
- This rent runs 31% of the median local income ($92k/yr) — at the standard rent-burdened threshold; future hikes will face affordability resistance.
Forward outlook
- Local home prices are declining (-3.0%/yr); year-one equity from $684 of loan paydown is wiped out by about $3k of value loss. Plan a longer hold.
- Middlesex County population projected at +20% by 2050 — long-run rental-demand tailwind backs the buy-and-hold thesis.
Negotiation context
- It's been on market 62 days — a 6% lower offer ($93k) is reasonable based on typical stale-listing flexibility.
Risks & watch-outs
- Watch-outs: HOA is 45% of rent.
- Climate carrying-cost: extreme-heat days projected 7→15/yr by 2055 (HVAC capex compounding) — expect insurance premiums to compound above CPI over the hold.
Questions for the listing agent
- It's been on market 62 days. Have you received any prior offers? Is the seller open to a 6% concession, seller financing, or rate buy-down credit?
- Built in 1964 — when were the roof, HVAC, electrical panel, plumbing, and water heater last replaced?
- What does the HOA fee cover, when was the last increase, and are there any pending special assessments or reserve-fund shortfalls?
- Why hasn't it sold? Are there any deal-killer items the seller is aware of (foundation, flood, title, zoning, code violations)?
- Is there a deadline driving the sale (1031 exchange, divorce, estate, relocation)? That informs how much negotiation room exists.
- Schools are B-rated — typically a magnet for longer-tenancy family renters. What's the average tenant stay here, and is there a school-zone premium baked into asking?
- What's the average days-on-market for RENTAL listings here right now (not sales)? A rising rental-DOM trend means longer vacancies and softer asking-rent achievability than the comps imply.
- What's the recent tenant-quality profile in this submarket — average credit score on applications, eviction rate, late-payment / NSF rate, and stable-employment percentage? A property-management company in the area should have these aggregated.
- How much new for-sale + rental construction is in the pipeline within 1–3 miles? Heavy new supply typically softens prices + rents 12–24 months out; constrained supply supports both.
Investment metrics
- 1% rule
- 2.40% ✓
- Cap rate
- 7.81%
- Cash-on-cash
- 5.41%
- DSCR
- 1.24
- GRM
- 3.5
CMA / ARV
- ARV (median comp)
- $122,417
- List price
- $99,000
- Delta
- -19.13%
- Verdict
- UNDERPRICED
- Comps
- 3 within 1.0 mi
Show comp detail 1 sale within ~0.75 mi
| Address | Dist | Beds/Ba | Sqft | Sold | Price | $/sf | Match |
|---|---|---|---|---|---|---|---|
| 13 Vals Ln | 0.23mi | 2/1.0 | 784 (+9%) | 6mo | $121,000 | $154 | 70 |
Match score weights: distance 35% · size 25% · config 20% · recency 20%. Top-matched comps best support the ARV.
Projected returns pro-forma
-3.0% appreciation · 1.16% rent growth · sell at horizon
- IRR
- -12.1%
- Equity multiple
- 0.58×
- Total profit
- $-11,704
- Equity at exit
- $14,761
- IRR
- -10.2%
- Equity multiple
- 0.49×
- Total profit
- $-14,192
- Equity at exit
- $8,560
Cash invested: $27,720 (down + closing). Projections, not guarantees.
Landlord ↔ Tenant lean methodology
- Overall (STATE)
- 20 Strongly Tenant-Friendly
- State Massachusetts
- 20 Strongly Tenant-Friendly · D+15
- County
- — inherits STATE
- City
- — inherits STATE
ZIP-level market 01752
- Rents YoY
- 1.2%
- Active inventory
- 62
- Price-to-rent
- 3.5×
Monthly cashflow live
- Estimated rent
- $2,372 high interval (Pro) →
- Mortgage (P&I)
- −$519
- Tax est. 1.5%
- −$124 /mo · $1,485/yr
- Insurance
- −$41
- HOA
- −$1,065
- Vacancy / Maint / Mgmt
- −$498
- Net cashflow
- $125
Break-even live
UW: 25.0% down · 7.5% · 30yr · 1.5% tax · 5.0% vac · 8.0% maint · 8.0% mgmt
Financing live
Cash to close
- Down payment
- $24,750
- Closing costs
- $2,970
- Reserves months
- —
- Total cash needed
- —
Loan-product check · same deal, 3 products live
Conventional
25% down · 7.5% · 30yr
- Down + closing
- —
- Monthly P&I
- —
- Monthly cashflow
- —
- DSCR
- —
- Eligible?
- —
Personal DTI + credit; lowest rate.
DSCR
20% down · 8.5% · 30yr
- Down + closing
- —
- Monthly P&I
- —
- Monthly cashflow
- —
- DSCR
- —
- Eligible?
- —
No personal income docs; deal must DSCR.
Hard money
10% down · 12.0% · 12mo
- Down + closing
- —
- Monthly P&I
- —
- Monthly cashflow
- —
- DSCR
- —
- Eligible?
- —
Short-term bridge; refi at stabilization.
Rent comps 5 comps
| Address | Beds | Baths | Sqft | Rent | $/sqft | DOM | Units | Dist |
|---|---|---|---|---|---|---|---|---|
| 447 Boston Post Rd E Marlborough, MA | 1.0 | 1.0 | 750 | $1,955 | $2.61 | 1d | 1 | 0.55mi |
| 740 Farm Rd Marlborough, MA | 2.0 | 1.0 | 619 | $2,209 | $3.57 | 1d | 12 | 0.65mi |
| 39 Briarwood Ln Marlborough, MA | 1.0 | 1.0 | 625 | $2,119 | $3.39 | 1d | 5 | 0.78mi |
| 19 Royal Crest Dr Marlborough, MA | 1.0–2.0 | 1.0 | 850 | $2,380 | $2.80 | 1d | 61 | 0.86mi |
| 57 Main St Marlborough, MA | 1.0–3.0 | 1.0–2.0 | 937 | $3,550 | $3.79 | 1d | 90 | 1.07mi |
HOA detail
- Monthly dues
- $1,065 · $12,780/yr
- Likely covers
- exterior maint.
Listing history 14 events
-
2026-06-18days on market $99,000 Active 62 DOM
-
2026-06-17days on market $99,000 Active 61 DOM
-
2026-06-16days on market $99,000 Active 60 DOM
-
2026-06-15days on market $99,000 Active 59 DOM
-
2026-06-13days on market $99,000 Active 57 DOM
-
2026-06-09days on market $99,000 Active 53 DOM
-
2026-06-08days on market $99,000 Active 52 DOM
-
2026-06-07days on market $99,000 Active 51 DOM
-
2026-06-04days on market $99,000 Active 48 DOM
-
2026-06-03days on market $99,000 Active 47 DOM
-
2026-06-02days on market $99,000 Active 46 DOM
-
2026-06-01days on market $99,000 Active 45 DOM
-
2026-05-31days on market $99,000 Active 44 DOM
-
2026-04-17$99,000 New 585-char remark
Show marketing remark (585 chars)
Well-maintained 2-bedroom, 1-bath unit offering a solid opportunity for investors or owner-occupants. Currently rented at $2,100/month, providing immediate income. The unit offers a practical layout with everything in working order and good overall functionality.Tenants pay all utilities, helping to keep operating costs more predictable. Conveniently located with easy access to local amenities, shopping, and major routes.Monthly HOA fee is $1,065, covering common expenses and exterior maintenance. A straightforward property with stable income potential and room for future value.
ⓘ Source: listings_history table (triggers on properties + properties_extension) + one-shot
backfill from property_details.listing_events for pre-trigger history.
Climate risk First Street
- Heat 5/10 Major
- Air quality 2/10 Low 1 unhealthy d/yr today · 2 by 30 yrs out
Nearby sold comps map
Loading sold comps map…
Walkable amenities ~0.75 mi
Loading nearby amenities…
Taxation est. · year 1
- Rental income
- $28,468
- − Mortgage interest
- −$5,546
- − Property taxes
- −$1,485
- − Insurance
- −$495
- − Repairs & maintenance
- −$2,277
- − Management
- −$2,277
- − HOA
- −$12,780
- − Depreciation
- −$2,880
- Taxable income
- $728
- Est. tax owed @ 24.0%
- −$175
- After-tax cash flow
- $1,325/yr
For passive investors: Depreciation is non-cash, so a rental often shows a tax loss while cash-flowing — sheltering income. Rental losses are passive: they offset passive income freely, and up to $25,000/yr can offset ordinary (W-2) income if you actively participate and your MAGI is under $100k (phasing out to $0 by $150k); unused losses carry forward. On sale, claimed depreciation is recaptured at up to 25%, and gains may owe capital-gains tax (a 1031 exchange can defer both). Figures are a year-1 estimate at your 24.0% rate — not tax advice; consult a CPA.
Condition & rehab AI · 1 photo
This well-maintained manufactured home offers a practical layout and is currently rented at $2,100/month. A fresh coat of paint and cleaning gutters can significantly enhance its curb appeal and value.
Value-add opportunities
- Both Paint exterior walls — Enhances curb appeal and can increase both resale and rental value.
- Both Clean gutters — Improves drainage and can prevent water damage, enhancing both resale and rental value.
Renovation cost estimate screening
Value-add ROI direction
- Both Paint exterior walls — Enhances curb appeal and can increase both resale and rental value. ↑
- Both Clean gutters — Improves drainage and can prevent water damage, enhancing both resale and rental value. ↑
ⓘ Cost ranges are severity-bucket heuristics (US national rule-of-thumb). Get contractor quotes + a written scope before underwriting a rehab budget.
Schools (NCES district)
- District
- Marlborough
- NCES district ID
- 2507320
- Math proficiency
- 23% ▼ -14.00%
- Reading proficiency
- 34% ▼ -9.00%
- Median HH income
- $71,601
- Composite
- 26.98/100
- National rank
- #7072
- State rank
- #250 of 302 in MA
Livability — Marlborough
- Score
- 76/100
- State rank
- #59
- US rank
- #3372
Category grades
Schools grade is shown separately in the Schools card above.
Census & demographics
- Census place
- Marlborough, MA
- County
- Middlesex County · 1,437,704 people
- City population
- 41,647
- Metro
- Boston-Cambridge-Newton, MA-NH
- Population (ZIP)
- 41,647
- Household income
- $91,968
- Rent vs Own
- Severe rent burden
- 2171.0
Population outlook (Middlesex County) Hauer SSP2
- Today (2025)
- 1,740,269 people
- By 2030
- 1,817,187 · +4.4%
- By 2040
- 1,963,195 · +12.8%
- By 2050
- 2,087,461 · +20.0%
- By 2075
- 2,344,036 · +34.7%
- By 2100
- 2,383,776 · +37.0%
Race, ethnicity, and origin ACS 2023
- Neighborhood character
- Diverse neighborhood (Simpson 0.62)
- Race & ethnicity
- White 59% Hispanic / Latino 17% Two or more races 16% Asian 5% Black 4%
- Hispanic origin (detail)
- Mexican 2% Puerto Rican 3%
- Common ancestry
- Estonian 11% Lithuanian 4% Russian 3%
- Foreign-born
- 29% · Canada, China, Jamaica
- Languages at home
- 60% English-only · Other Indo-European 20% Spanish 15% French/Haitian/Cajun 1%
Political lean MEDSL · Middlesex
- 2024 margin
- Solid D (+39.5) · D 68.5% · R 29.0% · Other 2.5%
- 2008→2024 swing
- +9.3pp toward D · 2008: 30.1pp · 2024: 39.5pp
- All cycles
- 2024: D+39.5 2020: D+45.2 2016: D+38.1 2012: D+26.9 2008: D+30.1
Not yet ingested
- Civics
- —
Market trends
- HPI YoY
- ▼ -415.20%
- Current HPI
- 269.0905
- Rent YoY
- ▲ 1.16%
- Metro
- Boston-Cambridge-Newton, MA-NH
- State GDP YoY
- ▲ 2.28%
- F500 in state
- 38
Industry mix (Fortune 500 HQ in MA)
| Industry | F500 HQs | Revenue |
|---|---|---|
| Technology | 3 | $17B |
|
||
| Insurance | 2 | $84B |
|
||
| Retail | 2 | $76B |
|
||
| Life Sciences | 1 | $43B |
|
||
| Energy Technology | 1 | $31B |
|
||
| Aerospace / Defense | 1 | $18B |
|
||
Price history
1 event — show timeline
- 2026-04-17 Listed $99,000 MLS PIN
Cash-flow waterfall
monthlySold comps — $/sqft
last 12 mo · ≤1 miLoading sold comps…