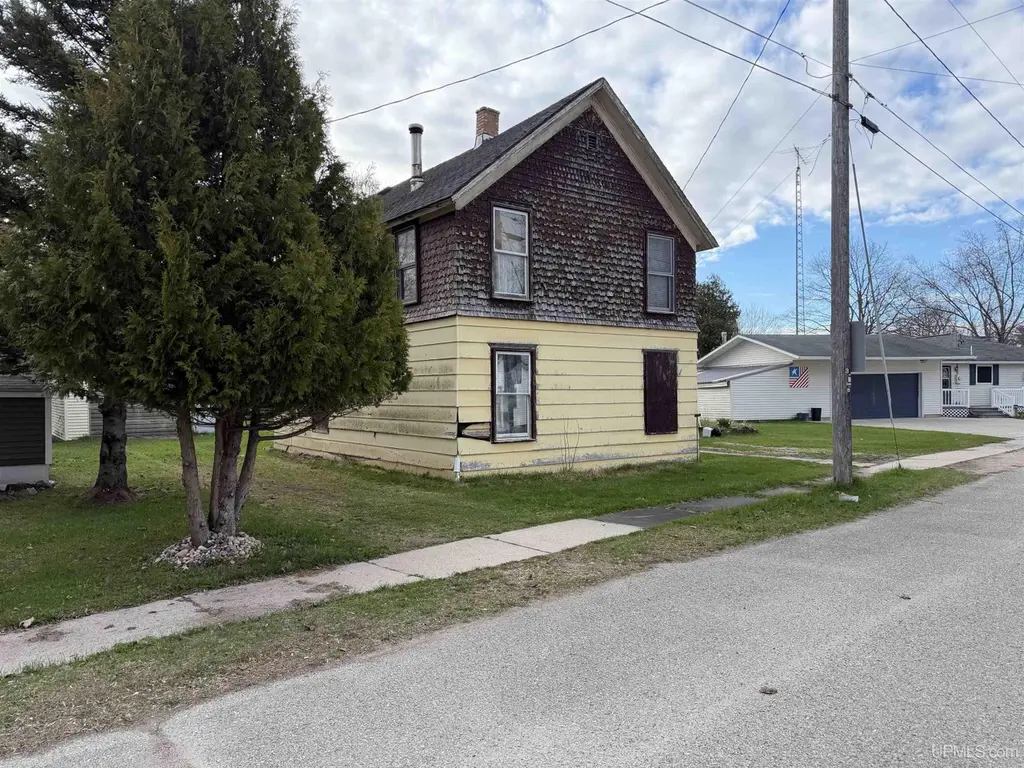
6362 1st Rd · Garden, MI
Flood risk 5/10 · Moderate
- FEMA flood zone
- X (unshaded)
- Chance of flooding over 30 yrs
- 0.66%
- Est. flood insurance / yr
- $473 – $860
Fire risk 1/10 · Minimal
- Est. fire insurance / yr
- $784 – $1,456
Heat risk 1/10 · Minimal
- Hot days now (above 86°F)
- 7 days/yr
- Hot days in 30 yrs
- 13 days/yr
Wind risk 1/10 · Minimal
- Chance of severe wind over 30 yrs
- —
Air-quality risk 2/10 · Minimal
- Unhealthy air days now
- 2 days/yr
- Unhealthy air days in 30 yrs
- 2 days/yr
Risk factors via First Street. Map © Google.
Why this score? — see what drove the A grade
The composite is a weighted blend of 9 inputs, each scored 0–100. Each bar is that input's sub-score; the figure is the points it added to the 100-point composite (weight × sub-score).
- Cash flow +30.0/30.0
- ARV discount +15.0/15.0
- 1% rule +10.0/10.0
- DSCR +10.0/10.0
- Appreciation +9.7/10.0
- Schools +3.2/10.0
- Rent growth +2.5/5.0
- Livability +2.5/5.0
- Condition / age +2.2/5.0
$65,000
🖨 Deal sheet 📄 Offer letter ✓ Due diligence
Listing remarks
This fixer-upper is located on the highly sought-after Garden Peninsula and offers great potential for the right buyer. The home features a spacious, open floor plan that provides plenty of room for updates and customization. A 16x24 detached garage adds valuable storage or workspace, and the property is nicely tucked within the Village of Garden—offering quick access to the main road, local park, and endless hunting, fishing, and outdoor recreation opportunities. With some vision and effort, this property could be transformed into a beautiful home in a desirable location.
Key facts
- Open floor plan
- Local park
- Detached garage
Tags
Property features AI
Finance
- Other: Located in Big Bay De Noc School District; Directions available to property
- Financial info: Annual tax noted
Exterior
- Parking: Attached garage with 1 parking space
- Utilities: Public water; Septic tank
- Home design: Single-family residential
- Construction: Vinyl siding
- Exterior features: Frontage approximately 60 feet; Lot dimensions roughly 60 x 165; Subdivision: Garden
Interior
- Bedrooms: Total rooms: 9
- Bathrooms: 1 full bathroom
- Heating & cooling: Wood heating; No central heating indicated
- Interior features: Fireplace (1); Basement
Neighborhood map
What this means for you Summary
Snapshot
- This is a 3-bed/1.0-bath single-family listed at $65k. Condition is rated fair.
Deal economics
- At list price, monthly cash flow is $597 ($7k/yr) — positive.
- The deal already cash-flows at list — no discount required.
- Meets the 1% rule at list price ($1k rent vs $65k).
- Recommended offer: $63k (3.0% below list) — sets the bar for market timing.
Location & tenants
- Location reads 49/100 on livability (#685 in MI) — a working-class tenant base; expect higher turnover. Strengths: cost of living A+, housing A-; Watch: schools F, crime F, amenities F.
- Big Bay De Noc School District (rural): math 35% / reading 35% proficiency, ranked #470 of 760 in MI (top 62%) — families likely to look elsewhere, expect single-tenant / working-renter base with shorter leases.
- Market conditions: 14 active listings in the ZIP; 38 units permitted in Delta County in 2024 (0 in 5+ unit buildings).
Forward outlook
- In year one you build about $7k of equity ($449 loan paydown + $6k appreciation (9.5% local appreciation)).
- Delta County population projected at -22% by 2050 — secular population decline; favor cash flow + early exit over multi-decade hold.
- At projected returns (9.5% appreciation + 3.0% rent growth), your $18k cash investment doubles in ~2 years — after that, you're playing with house money.
- By year 5, paydown + projected appreciation supports a ~$30k cash-out refi (75% LTV) — recoverable capital for the next deal without selling this one.
Negotiation context
- It's been on market 41 days — a 3% lower offer ($63k) is reasonable based on typical stale-listing flexibility.
Risks & watch-outs
- Watch-outs: built in 1940 — expect roof / HVAC / electrical / plumbing capex.
- Climate carrying-cost: moderate flood risk — expect insurance premiums to compound above CPI over the hold.
Questions for the listing agent
- It's been on market 41 days. Have you received any prior offers? Is the seller open to a 3% concession, seller financing, or rate buy-down credit?
- Have any recent inspections been done? Can we get a copy of the seller's disclosures and any deferred-maintenance estimates?
- Built in 1940 — when were the roof, HVAC, electrical panel, plumbing, and water heater last replaced?
- Is there a deadline driving the sale (1031 exchange, divorce, estate, relocation)? That informs how much negotiation room exists.
- Schools are F-rated, which usually means shorter tenancies and higher turnover. Who's the typical renter profile here, and what's been the actual vacancy rate?
- Crime grade is F in this area — have there been break-ins, vandalism, or insurance claims at this property in the last 3 years? What carrier currently insures it and at what premium?
- What's the average days-on-market for RENTAL listings here right now (not sales)? A rising rental-DOM trend means longer vacancies and softer asking-rent achievability than the comps imply.
- What's the recent tenant-quality profile in this submarket — average credit score on applications, eviction rate, late-payment / NSF rate, and stable-employment percentage? A property-management company in the area should have these aggregated.
- How much new for-sale + rental construction is in the pipeline within 1–3 miles? Heavy new supply typically softens prices + rents 12–24 months out; constrained supply supports both.
Investment metrics
- 1% rule
- 2.04% ✓
- Cap rate
- 17.32%
- Cash-on-cash
- 39.37%
- DSCR
- 2.75
- GRM
- 4.1
CMA / ARV
- ARV (median comp)
- $90,470
- List price
- $65,000
- Delta
- -28.15%
- Verdict
- UNDERPRICED
- Comps
- 8 within 1.0 mi
Show comp detail 2 sales within ~0.75 mi
| Address | Dist | Beds/Ba | Sqft | Sold | Price | $/sf | Match |
|---|---|---|---|---|---|---|---|
| 6394 State St | 0.10mi | 3/1.0 | 1,602 (+0%) | 12mo | $93,825 | $59 | 85 |
| 6273 State St | 0.24mi | 2/1.0 (-1) | 1,401 (-12%) | 23mo | $80,900 | $58 | 44 |
Match score weights: distance 35% · size 25% · config 20% · recency 20%. Top-matched comps best support the ARV.
Projected returns pro-forma
9.46% appreciation · 3.0% rent growth · sell at horizon
- IRR
- 54.0%
- Equity multiple
- 4.90×
- Total profit
- $71,040
- Equity at exit
- $55,991
- IRR
- 47.9%
- Equity multiple
- 10.82×
- Total profit
- $178,762
- Equity at exit
- $118,116
Cash invested: $18,200 (down + closing). Projections, not guarantees.
Landlord ↔ Tenant lean methodology
- Overall (STATE)
- 62 Landlord-Friendly
- State Michigan
- 62 Landlord-Friendly · EVEN
- County
- — inherits STATE
- City
- — inherits STATE
ZIP-level market 49835
- Home prices YoY
- 6.0%
- Active inventory
- 14
- Price-to-rent
- 4.1×
Monthly cashflow live
- Estimated rent
- $1,324 medium interval (Pro) →
- Mortgage (P&I)
- −$341
- Tax est. 1.5%
- −$81 /mo · $975/yr
- Insurance
- −$27
- HOA
- −$0
- Vacancy / Maint / Mgmt
- −$278
- Net cashflow
- $597
Break-even live
UW: 25.0% down · 7.5% · 30yr · 1.5% tax · 5.0% vac · 8.0% maint · 8.0% mgmt
Financing live
Cash to close
- Down payment
- $16,250
- Closing costs
- $1,950
- Reserves months
- —
- Total cash needed
- —
Loan-product check · same deal, 3 products live
Conventional
25% down · 7.5% · 30yr
- Down + closing
- —
- Monthly P&I
- —
- Monthly cashflow
- —
- DSCR
- —
- Eligible?
- —
Personal DTI + credit; lowest rate.
DSCR
20% down · 8.5% · 30yr
- Down + closing
- —
- Monthly P&I
- —
- Monthly cashflow
- —
- DSCR
- —
- Eligible?
- —
No personal income docs; deal must DSCR.
Hard money
10% down · 12.0% · 12mo
- Down + closing
- —
- Monthly P&I
- —
- Monthly cashflow
- —
- DSCR
- —
- Eligible?
- —
Short-term bridge; refi at stabilization.
Listing history 16 events
-
2026-06-18days on market $65,000 Active 41 DOM
-
2026-06-17days on market $65,000 Active 40 DOM
-
2026-06-16days on market $65,000 Active 39 DOM
-
2026-06-15days on market $65,000 Active 38 DOM
-
2026-06-13days on market $65,000 Active 36 DOM
-
2026-06-12days on market $65,000 Active 35 DOM
-
2026-06-09days on market $65,000 Active 32 DOM
-
2026-06-08days on market $65,000 Active 31 DOM
-
2026-06-07days on market $65,000 Active 30 DOM
-
2026-06-05days on market $65,000 Active 28 DOM
-
2026-06-04days on market $65,000 Active 26 DOM
-
2026-06-02days on market $65,000 Active 25 DOM
-
2026-06-01days on market $65,000 Active 24 DOM
-
2026-05-31days on market $65,000 Active 23 DOM
-
2026-05-31days on market $65,000 Active 22 DOM
-
2026-05-08$65,000 Active 585-char remark
ⓘ Source: listings_history table (triggers on properties + properties_extension) + one-shot
backfill from property_details.listing_events for pre-trigger history.
Climate risk First Street
- Flood 5/10 Major FEMA zone X (unshaded) · 66% chance over 30 yrs
- Wildfire 1/10 Low
- Heat 1/10 Low 7 d/yr ≥86°F today · 13 d/yr by 30 yrs out
- Wind 1/10 Low
- Air quality 2/10 Low 2 unhealthy d/yr today · 2 by 30 yrs out
Nearby sold comps map
Loading sold comps map…
Walkable amenities ~0.75 mi
Loading nearby amenities…
Taxation est. · year 1
- Rental income
- $15,894
- − Mortgage interest
- −$3,641
- − Property taxes
- −$975
- − Insurance
- −$325
- − Repairs & maintenance
- −$1,271
- − Management
- −$1,271
- − Depreciation
- −$1,891
- Taxable income
- $6,519
- Est. tax owed @ 24.0%
- −$1,564
- After-tax cash flow
- $5,601/yr
For passive investors: Depreciation is non-cash, so a rental often shows a tax loss while cash-flowing — sheltering income. Rental losses are passive: they offset passive income freely, and up to $25,000/yr can offset ordinary (W-2) income if you actively participate and your MAGI is under $100k (phasing out to $0 by $150k); unused losses carry forward. On sale, claimed depreciation is recaptured at up to 25%, and gains may owe capital-gains tax (a 1031 exchange can defer both). Figures are a year-1 estimate at your 24.0% rate — not tax advice; consult a CPA.
Condition & rehab AI · 13 photos
This fixer-upper requires extensive repairs and updates to bring it up to a fair condition. The property has potential for significant value increase with proper renovations.
Repairs flagged
- Major roof — Shingles are visibly worn and aged
- Major exterior siding — Siding is peeling and weathered
- Major interior walls — Paint is chipping and faded
- Major bathroom fixtures — Outdated and worn
- Major landscaping — Sparse and unkempt
- Major fencing — In poor condition
- Major foundation — Appears uneven and cracked
Value-add opportunities
- Resale Paint exterior — Fresh paint enhances curb appeal
- Resale Replace carpeted flooring — New flooring improves aesthetics and functionality
- Resale Upgrade bathroom fixtures — Modern fixtures enhance functionality and appeal
- Both Landscaping and fencing — Improved landscaping and fencing boost curb appeal and property value
- Both Roof and siding repairs — Fresh roof and siding improve safety and property value
Renovation cost estimate screening
| Repair item | Severity | Est. cost |
|---|---|---|
| roof · Shingles are visibly worn and aged | Major | $15,000–50,000 |
| exterior siding · Siding is peeling and weathered | Major | $15,000–50,000 |
| interior walls · Paint is chipping and faded | Major | $15,000–50,000 |
| bathroom fixtures · Outdated and worn | Major | $15,000–50,000 |
| landscaping · Sparse and unkempt | Major | $15,000–50,000 |
| fencing · In poor condition | Major | $15,000–50,000 |
| foundation · Appears uneven and cracked | Major | $15,000–50,000 |
| Total estimated repair cost · 7 items | $105,000–350,000 |
Value-add ROI direction
- Resale Paint exterior — Fresh paint enhances curb appeal ↑
- Resale Replace carpeted flooring — New flooring improves aesthetics and functionality ↑
- Resale Upgrade bathroom fixtures — Modern fixtures enhance functionality and appeal ↑
- Both Landscaping and fencing — Improved landscaping and fencing boost curb appeal and property value ↑
- Both Roof and siding repairs — Fresh roof and siding improve safety and property value ↑
ⓘ Cost ranges are severity-bucket heuristics (US national rule-of-thumb). Get contractor quotes + a written scope before underwriting a rehab budget.
Schools (NCES district)
- District
- Big Bay De Noc School District
- NCES district ID
- 2605690
- Math proficiency
- 35% ▬ 0.00%
- Reading proficiency
- 35% ▲ 5.00%
- Median HH income
- $39,475
- Composite
- 31.97/100
- National rank
- #11028
- State rank
- #470 of 760 in MI
Livability — Garden
- Score
- 49/100
- State rank
- #685
- US rank
- #25876
Category grades
Schools grade is shown separately in the Schools card above.
Census & demographics
- Census place
- Garden, MI
- Population (ZIP)
- 735
Population outlook (Delta County) Hauer SSP2
- Today (2025)
- 34,431 people
- By 2030
- 33,003 · -4.1%
- By 2040
- 29,748 · -13.6%
- By 2050
- 26,753 · -22.3%
- By 2075
- 20,962 · -39.1%
- By 2100
- 15,616 · -54.6%
Race, ethnicity, and origin ACS 2023
- Neighborhood character
- Predominantly White (83%)
- Race & ethnicity
- White 83% Two or more races 11% Native American 3% Hispanic / Latino 3% Asian 1%
- Common ancestry
- Lithuanian 9% Romanian 6% Italian 4%
- Foreign-born
- 2% · Canada
- Languages at home
- 97% English-only · Spanish 2% German/W. Germanic 1% Russian/Polish/Slavic 1%
Political lean MEDSL · Delta
- 2024 margin
- Solid R (+30.4) · D 34.1% · R 64.5% · Other 1.4%
- 2008→2024 swing
- -36.7pp toward R · 2008: 6.3pp · 2024: -30.4pp
- All cycles
- 2024: R+30.4 2020: R+26.5 2016: R+25.4 2012: R+6.7 2008: D+6.3
Not yet ingested
- Civics
- —
Market trends
- HPI YoY
- ▲ 9.46%
- Current HPI
- 166.7127
- Rent YoY
- —
- Metro
- —
- State GDP YoY
- ▲ 1.37%
- F500 in state
- 28
Industry mix (Fortune 500 HQ in MI)
| Industry | F500 HQs | Revenue |
|---|---|---|
| Automotive Parts | 3 | $48B |
|
||
| Automotive | 2 | $372B |
|
||
| Chemicals | 1 | $45B |
|
||
| Automotive Retail | 1 | $29B |
|
||
| Healthcare / Medical Devices | 1 | $23B |
|
||
| Automotive Technology | 1 | $20B |
|
||
Price history
1 event — show timeline
- 2026-05-08 Listed $65,000 UPAR
Cash-flow waterfall
monthlySold comps — $/sqft
last 12 mo · ≤1 miLoading sold comps…