235 S Enola Dr · Enola, PA
Flood risk 1/10 · Minimal
- FEMA flood zone
- X (unshaded)
- Chance of flooding over 30 yrs
- 0.0%
- Est. flood insurance / yr
- $507 – $1,088
Fire risk 1/10 · Minimal
- Est. fire insurance / yr
- $511 – $949
Heat risk 5/10 · Moderate
- Hot days now (above 101°F)
- 7 days/yr
- Hot days in 30 yrs
- 15 days/yr
Wind risk 2/10 · Minimal
- Chance of severe wind over 30 yrs
- 4.0%
Air-quality risk 2/10 · Minimal
- Unhealthy air days now
- 1 days/yr
- Unhealthy air days in 30 yrs
- 3 days/yr
Risk factors via First Street. Map © Google.
Why this score? — see what drove the B+ grade
The composite is a weighted blend of 9 inputs, each scored 0–100. Each bar is that input's sub-score; the figure is the points it added to the 100-point composite (weight × sub-score).
- Cash flow +30.0/30.0
- ARV discount +15.0/15.0
- DSCR +10.0/10.0
- 1% rule +8.9/10.0
- Rent growth +4.1/5.0
- Livability +4.0/5.0
- Schools +3.8/10.0
- Condition / age +2.5/5.0
- Appreciation +0.0/10.0
$140,000
🖨 Deal sheet 📄 Offer letter ✓ Due diligence
Listing remarks MLS
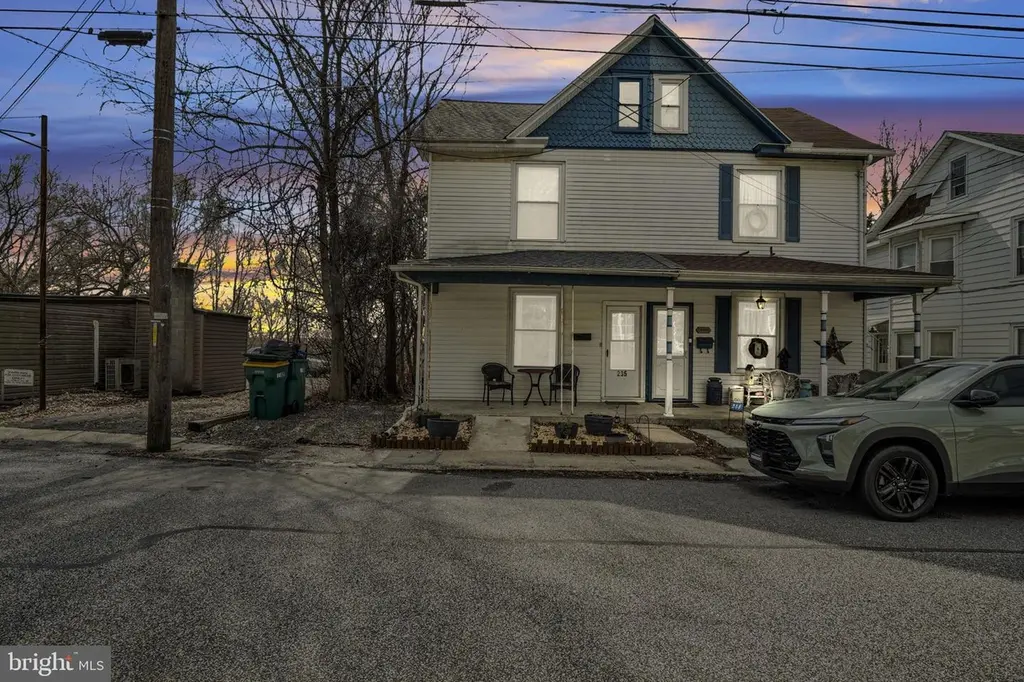
Attractive Alum semi with a covered front porch, covered rear deck, off street parking in front and rear of home. First floor has been completely remodeled, replacement windows, formal dining room and eat-in-kitchen, partially finished basement, walk up attic, and gas furnace. Seller to provide a 1 year First American Warranty.
Key facts
- 2 parking spots
- Built 1900
- Listed 3 days
Neighborhood map
What this means for you Summary
Snapshot
- This is a 3-bed/1.0-bath single-family listed at $140k.
Deal economics
- At list price, monthly cash flow is $579 ($7k/yr) — positive.
- The deal already cash-flows at list — no discount required.
- Meets the 1% rule at list price ($2k rent vs $140k).
- Cap rate 11.3% vs local median 3.4% in Enola — top-decile yield for the area; either an underpriced asset or a hidden risk that comps aren't pricing in. Stress-test before assuming the spread holds.
Location & tenants
- Location reads 79/100 on livability (#243 in PA, #2,077 nationally) — a middle-class / working-renter tenant base. Strengths: cost of living A+, housing A+, health & safety A+; Watch: employment C-, commute D+, amenities F.
- East Pennsboro Area SD (suburban): math 30% / reading 57% proficiency, ranked #275 of 539 in PA (top 51%) — families likely to look elsewhere, expect single-tenant / working-renter base with shorter leases.
- Zoned schools: East Pennsboro Area Shs (math 82% / reading 72%, grade A-, #22 of 437 statewide, top 5%, 761 students, 36% FRL).
- Zoned-school proficiency averages 77% at this address vs 44% district-wide (+34 pts) — the actual schools serving this property are materially stronger than the East Pennsboro Area SD average implies; a family-tenant draw the district grade alone would hide.
- Market conditions: Rents rising fast (+6.5%/yr); 126 active listings in the ZIP; 4 comparable units currently listed for rent nearby; rentals leasing fast (median 14d on market — plan ~1-2 weeks tenant-placement turnaround); solid renter incomes; 1,052 units permitted in Cumberland County in 2024 (310 in 5+ unit buildings).
Forward outlook
- Local home prices are declining (-3.0%/yr); year-one equity from $968 of loan paydown is wiped out by about $4k of value loss. Plan a longer hold.
- Cumberland County population projected at +17% by 2050 — long-run rental-demand tailwind backs the buy-and-hold thesis.
- At projected returns (-3.0% appreciation + 6.5% rent growth), your $39k cash investment doubles in ~6 years — after that, you're playing with house money.
Negotiation context
- Only 3 days on market — expect competitive offers; lowballing is unlikely to land.
- 5 sale attempts since 19y ago with the ask held roughly flat each time — persistent listings suggest the price (not the market) is what's stuck; bring a comps-based counter.
- Current owner paid $85k; list at $140k implies a 65% gain — meaningful room to come down on a strong offer.
Risks & watch-outs
- Watch-outs: built in 1900 — expect roof / HVAC / electrical / plumbing capex.
- Climate carrying-cost: extreme-heat days projected 7→15/yr by 2055 (HVAC capex compounding) — expect insurance premiums to compound above CPI over the hold.
Questions for the listing agent
- Built in 1900 — when were the roof, HVAC, electrical panel, plumbing, and water heater last replaced?
- Is there a deadline driving the sale (1031 exchange, divorce, estate, relocation)? That informs how much negotiation room exists.
- Schools are B-rated — typically a magnet for longer-tenancy family renters. What's the average tenant stay here, and is there a school-zone premium baked into asking?
- What's the average days-on-market for RENTAL listings here right now (not sales)? A rising rental-DOM trend means longer vacancies and softer asking-rent achievability than the comps imply.
- What's the recent tenant-quality profile in this submarket — average credit score on applications, eviction rate, late-payment / NSF rate, and stable-employment percentage? A property-management company in the area should have these aggregated.
- How much new for-sale + rental construction is in the pipeline within 1–3 miles? Heavy new supply typically softens prices + rents 12–24 months out; constrained supply supports both.
Investment metrics
- 1% rule
- 1.39% ✓
- Cap rate
- 11.26%
- Cash-on-cash
- 17.74%
- DSCR
- 1.79
- GRM
- 6.0
CMA / ARV
- ARV (on-the-fly)
- $246,132
- Comps found
- 12
Show comp detail 12 sales within ~0.75 mi
| Address | Dist | Beds/Ba | Sqft | Sold | Price | $/sf | Match |
|---|---|---|---|---|---|---|---|
| 302 S Enola Dr | 0.05mi | 3/1.0 | 1,589 (+3%) | 10mo | $252,500 | $159 | 85 |
| 11 High St | 0.29mi | 3/1.5 | 1,582 (+2%) | 8mo | $300,000 | $190 | 75 |
| 215 S Enola Dr | 0.08mi | 3/1.5 | 1,708 (+10%) | 5mo | $215,000 | $126 | 73 |
| 794 Lancaster Ave | 0.33mi | 3/1.5 | 1,644 (+6%) | 11mo | $240,000 | $146 | 63 |
| 497 State St | 0.46mi | 3/1.5 | 1,646 (+6%) | 5mo | $255,000 | $155 | 62 |
| 8 W Pine St | 0.17mi | 3/2.0 | 1,400 (-10%) | 14mo | $250,000 | $179 | 61 |
| 530 S Enola Rd | 0.48mi | 3/1.5 | 1,659 (+7%) | 11mo | $226,000 | $136 | 55 |
| 28 N Enola Dr | 0.62mi | 3/1.5 | 1,459 (-6%) | 10mo | $245,000 | $168 | 51 |
| 425 State St | 0.62mi | 3/2.0 | 1,644 (+6%) | 8mo | $154,000 | $94 | 50 |
| 339 W Perry St | 0.69mi | 4/2.0 (+1) | 1,440 (-7%) | 8mo | $270,000 | $188 | 40 |
| 418 State St | 0.64mi | 3/1.5 | 1,336 (-14%) | 6mo | $225,000 | $168 | 40 |
| 1447 3rd St | 0.69mi | 3/2.0 | 1,709 (+10%) | 10mo | $210,000 | $123 | 38 |
Match score weights: distance 35% · size 25% · config 20% · recency 20%. Top-matched comps best support the ARV.
Projected returns pro-forma
-3.0% appreciation · 6.46% rent growth · sell at horizon
- IRR
- 13.1%
- Equity multiple
- 1.54×
- Total profit
- $21,256
- Equity at exit
- $20,874
- IRR
- 24.5%
- Equity multiple
- 3.48×
- Total profit
- $97,044
- Equity at exit
- $12,105
Cash invested: $39,200 (down + closing). Projections, not guarantees.
Landlord ↔ Tenant lean methodology
- Overall (STATE)
- 62 Landlord-Friendly
- State Pennsylvania
- 62 Landlord-Friendly · EVEN
- County
- — inherits STATE
- City
- — inherits STATE
ZIP-level market 17025
- Home prices YoY
- -25.3%
- Rents YoY
- 6.5%
- Active inventory
- 126
- Price-to-rent
- 6.0×
Monthly cashflow live
- Estimated rent
- $1,948 medium interval (Pro) →
- Mortgage (P&I)
- −$734
- Tax from tax record
- −$167 /mo · $2,005/yr
- Insurance
- −$58
- HOA
- −$0
- Vacancy / Maint / Mgmt
- −$409
- Net cashflow
- $579
Break-even live
UW: 25.0% down · 7.5% · 30yr · 1.5% tax · 5.0% vac · 8.0% maint · 8.0% mgmt
Financing live
Cash to close
- Down payment
- $35,000
- Closing costs
- $4,200
- Reserves months
- —
- Total cash needed
- —
Loan-product check · same deal, 3 products live
Conventional
25% down · 7.5% · 30yr
- Down + closing
- —
- Monthly P&I
- —
- Monthly cashflow
- —
- DSCR
- —
- Eligible?
- —
Personal DTI + credit; lowest rate.
DSCR
20% down · 8.5% · 30yr
- Down + closing
- —
- Monthly P&I
- —
- Monthly cashflow
- —
- DSCR
- —
- Eligible?
- —
No personal income docs; deal must DSCR.
Hard money
10% down · 12.0% · 12mo
- Down + closing
- —
- Monthly P&I
- —
- Monthly cashflow
- —
- DSCR
- —
- Eligible?
- —
Short-term bridge; refi at stabilization.
Rent comps 4 comps
| Address | Beds | Baths | Sqft | Rent | $/sqft | DOM | Units | Dist |
|---|---|---|---|---|---|---|---|---|
| 3 Silk Mill Dr East Pennsboro Township, PA | 2.0 | 1.0–2.0 | 1319 | $1,822 | $1.38 | 13d | 8 | 0.67mi |
| 64 Queen Ave Enola, PA | 2.0 | 1.5 | 1200 | $1,495 | $1.25 | 13d | 1 | 1.12mi |
| 400 W Crestwood Dr Camp Hill, PA | 1.0–3.0 | 1.0–2.0 | 1042 | $2,071 | $1.99 | 13d | 14 | 1.27mi |
| 99 Lee Ann Ct Enola, PA | 3.0 | 2.5 | 1540 | $1,995 | $1.30 | 13d | 1 | 1.37mi |
Listing history 15 events
-
2026-04-03status Pending
-
2026-04-01$140,000 Active
-
2026-03-22historical $140,000
-
2020-05-12historical
-
2016-05-06soldstatus $85,000
-
2016-05-04soldstatus $85,000 329-char remark
Show marketing remark (329 chars)
Attractive Alum semi with a covered front porch, covered rear deck, off street parking in front and rear of home. First floor has been completely remodeled, replacement windows, formal dining room and eat-in-kitchen, partially finished basement, walk up attic, and gas furnace. Seller to provide a 1 year First American Warranty.
-
2016-03-04historical 329-char remark
Show marketing remark (329 chars)
Attractive Alum semi with a covered front porch, covered rear deck, off street parking in front and rear of home. First floor has been completely remodeled, replacement windows, formal dining room and eat-in-kitchen, partially finished basement, walk up attic, and gas furnace. Seller to provide a 1 year First American Warranty.
-
2016-03-01$86,900 329-char remark
Show marketing remark (329 chars)
Attractive Alum semi with a covered front porch, covered rear deck, off street parking in front and rear of home. First floor has been completely remodeled, replacement windows, formal dining room and eat-in-kitchen, partially finished basement, walk up attic, and gas furnace. Seller to provide a 1 year First American Warranty.
-
2015-01-01historical
-
2014-07-28$86,900
-
2014-07-28$86,900
-
2007-05-08soldstatus $89,900
-
2007-04-27soldstatus $89,900
-
2007-02-11$89,900
-
1993-08-02soldstatus $58,900
ⓘ Source: listings_history table (triggers on properties + properties_extension) + one-shot
backfill from property_details.listing_events for pre-trigger history.
Tax reassessment forecast PA · Partial reset (capped growth)
- Current annual tax
- $2,005 · $167/mo
- Projected year-2 tax
- $2,108 · $176/mo
- Expected delta
- +$104/yr (+$9/mo · 5.2%)
ⓘ Screening estimate from a state-policy table — verify with the county assessor before closing.
Climate risk First Street
- Flood 1/10 Low FEMA zone X (unshaded) · 0% chance over 30 yrs
- Wildfire 1/10 Low
- Heat 5/10 Major 7 d/yr ≥101°F today · 15 d/yr by 30 yrs out
- Wind 2/10 Low 4% chance of damaging wind over 30 yrs
- Air quality 2/10 Low 1 unhealthy d/yr today · 3 by 30 yrs out
Nearby sold comps map
Loading sold comps map…
Walkable amenities ~0.75 mi
Loading nearby amenities…
Taxation est. · year 1
- Rental income
- $23,376
- − Mortgage interest
- −$7,842
- − Property taxes
- −$2,005
- − Insurance
- −$700
- − Repairs & maintenance
- −$1,870
- − Management
- −$1,870
- − Depreciation
- −$4,073
- Taxable income
- $5,017
- Est. tax owed @ 24.0%
- −$1,204
- After-tax cash flow
- $5,749/yr
For passive investors: Depreciation is non-cash, so a rental often shows a tax loss while cash-flowing — sheltering income. Rental losses are passive: they offset passive income freely, and up to $25,000/yr can offset ordinary (W-2) income if you actively participate and your MAGI is under $100k (phasing out to $0 by $150k); unused losses carry forward. On sale, claimed depreciation is recaptured at up to 25%, and gains may owe capital-gains tax (a 1031 exchange can defer both). Figures are a year-1 estimate at your 24.0% rate — not tax advice; consult a CPA.
Schools (NCES district)
- District
- East Pennsboro Area SD
- NCES district ID
- 4208580
- Math proficiency
- 30% ▼ -16.00%
- Reading proficiency
- 57% ▼ -8.00%
- Median HH income
- $60,120
- Composite
- 38.26/100
- National rank
- #4239
- State rank
- #275 of 539 in PA
Livability — Enola
- Score
- 79/100
- State rank
- #243
- US rank
- #2077
Category grades
Schools grade is shown separately in the Schools card above.
Census & demographics
- Census place
- Enola, PA
- County
- Cumberland County · 257,673 people
- City population
- 17,648
- Metro
- Harrisburg-Carlisle, PA
- Population (ZIP)
- 17,648
- Household income
- $91,285
- Rent vs Own
- Severe rent burden
- 317.0
Population outlook (Cumberland County) Hauer SSP2
- Today (2025)
- 267,950 people
- By 2030
- 278,105 · +3.8%
- By 2040
- 296,552 · +10.7%
- By 2050
- 312,937 · +16.8%
- By 2075
- 349,233 · +30.3%
- By 2100
- 361,875 · +35.1%
Race, ethnicity, and origin ACS 2023
- Neighborhood character
- Predominantly White (79%)
- Race & ethnicity
- White 79% Hispanic / Latino 6% Asian 6% Two or more races 6% Black 3%
- Hispanic origin (detail)
- Puerto Rican 2% Dominican 2%
- Common ancestry
- Romanian 3% Italian 2% Slovak 2%
- Foreign-born
- 8% · Canada, South Korea, Vietnam
- Languages at home
- 88% English-only · Other Indo-European 5% Spanish 4% Tagalog/Filipino 1%
Political lean MEDSL · Cumberland
- 2024 margin
- Lean R (+9.4) · D 44.6% · R 54.1% · Other 1.3%
- 2008→2024 swing
- +4.2pp toward D · 2008: -13.6pp · 2024: -9.4pp
- All cycles
- 2024: R+9.4 2020: R+10.6 2016: R+18.6 2012: R+18.5 2008: R+13.6
Not yet ingested
- Civics
- —
Market trends
- HPI YoY
- ▼ -85.21%
- Current HPI
- 251.939
- Rent YoY
- ▲ 6.46%
- Metro
- Harrisburg-Carlisle, PA
- State GDP YoY
- ▲ 1.68%
- F500 in state
- 34
Industry mix (Fortune 500 HQ in PA)
| Industry | F500 HQs | Revenue |
|---|---|---|
| Healthcare | 2 | $309B |
|
||
| Insurance | 2 | $27B |
|
||
| Telecommunications / Media | 1 | $124B |
|
||
| Industrial Distribution | 1 | $22B |
|
||
| Financial Services | 1 | $20B |
|
||
| Chemicals / Materials | 1 | $18B |
|
||
Price history
+137.7% since first listed15 events — show timeline
- 2026-04-03 Pending — BRIGHT MLS
- 2026-04-01 Listed $140,000 BRIGHT MLS
- 2026-03-22 Coming Soon $140,000 BRIGHT MLS
- 2020-05-12 Listing Removed — BRIGHT MLS
- 2016-05-06 Sold (Public Records) $85,000 Public Records
- 2016-05-04 Sold (MLS) $85,000 BRIGHT MLS
- 2016-03-04 Listing Removed — BRIGHT MLS
- 2016-03-01 Listed $86,900 BRIGHT MLS
- 2015-01-01 Listing Removed — BRIGHT MLS
- 2014-07-28 Listed $86,900 BRIGHT MLS
- 2014-07-28 Listed $86,900 BRIGHT MLS
- 2007-05-08 Sold (Public Records) $89,900 Public Records
- 2007-04-27 Sold (MLS) $89,900 BRIGHT MLS
- 2007-02-11 Listed $89,900 BRIGHT MLS
- 1993-08-02 Sold (Public Records) $58,900 Public Records
Property tax history
+3.4%/yrLatest (2026): $2,005 · +1.8% YoY. Source: county tax records.
Cash-flow waterfall
monthlySold comps — $/sqft
last 12 mo · ≤1 miLoading sold comps…