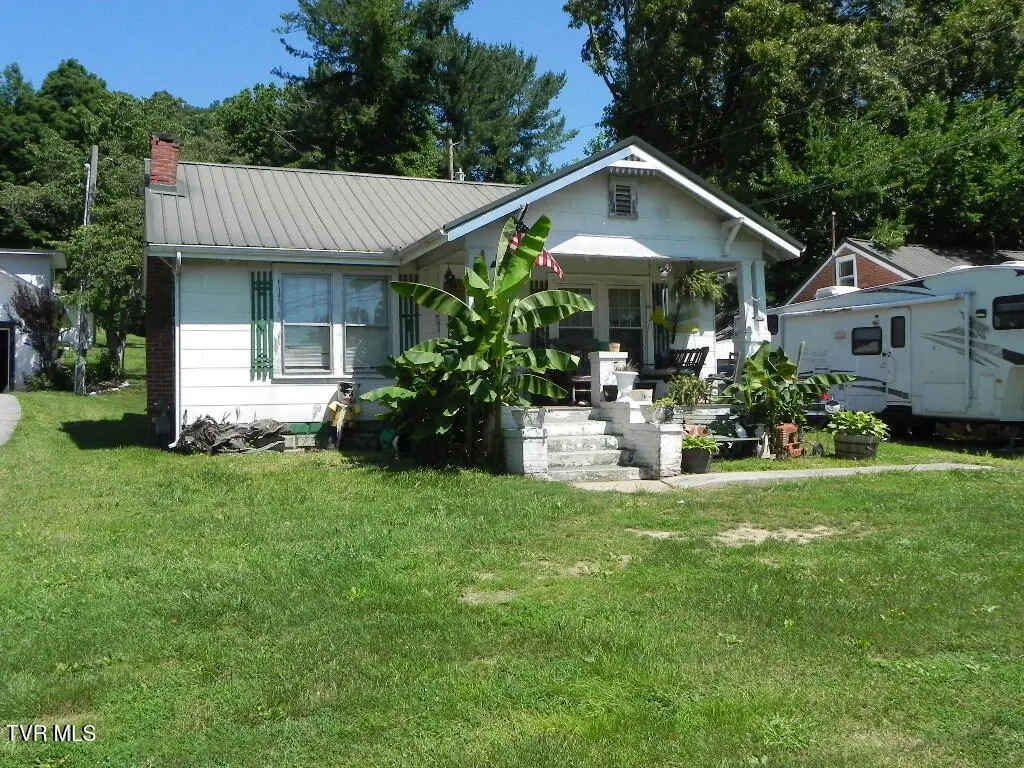
1313 Main St · Rogersville, TN
Flood risk 1/10 · Minimal
- FEMA flood zone
- X (unshaded)
- Chance of flooding over 30 yrs
- 0.0%
- Est. flood insurance / yr
- $473 – $860
Fire risk 3/10 · Minor
- Est. fire insurance / yr
- $949 – $1,763
Heat risk 5/10 · Moderate
- Hot days now (above 102°F)
- 7 days/yr
- Hot days in 30 yrs
- 21 days/yr
Wind risk 2/10 · Minimal
- Chance of severe wind over 30 yrs
- —
Air-quality risk 3/10 · Minor
- Unhealthy air days now
- 2 days/yr
- Unhealthy air days in 30 yrs
- 3 days/yr
Risk factors via First Street. Map © Google.
Why this score? — see what drove the D+ grade
The composite is a weighted blend of 9 inputs, each scored 0–100. Each bar is that input's sub-score; the figure is the points it added to the 100-point composite (weight × sub-score).
- ARV discount +15.0/15.0
- Cash flow +10.7/30.0
- Appreciation +6.8/10.0
- Livability +3.2/5.0
- DSCR +3.1/10.0
- Rent growth +2.5/5.0
- Condition / age +2.5/5.0
- Schools +2.2/10.0
- 1% rule +2.1/10.0
$140,000
🖨 Deal sheet (PDF) 📄 Offer letter ✓ Due diligence
Listing remarks MLS
INVESTORS: for your next project to remodel and flip. Its a open canvass as to how you want to make it look and feel. Check out this cute 2 bedroom 1 bath home. Nice eating area in the kitchen area with all the windows. Bonus room on the back side. Property has all city amenities. Close to shopping, restaurants. Call your agent to set up a showing.
Key facts
- 0.34 acre lot
- Built 1945
- Listed 11 days
Property features AI
Finance
- Other: Property type: Residential, Single Family Residence; Zoning: Restricted; Directions: Go west on Main St Rogersville. Property on the right. White house
Exterior
- Utilities: Public water; Public sewer
- Home design: Single-family house; One-level home; Not in a subdivision
- Construction: Built with asbestos and plaster materials; Shingle roof
- Exterior features: Level lot; Lot dimensions approximately 50 x 300
Interior
- Bathrooms: One full bathroom
- Heating & cooling: Natural gas heating; No central cooling
- Interior features: Six total rooms
Neighborhood map
What this means for you Summary
Snapshot
- This is a 2-bed/1.0-bath single-family listed at $140k.
Deal economics
- At list price, monthly cash flow is $-66 ($-793/yr) — negative.
- To cash-flow at today's rent, offer at most $128k (8.3% below list).
- To meet the 1% rule (rent ≥ 1% of price), the offer needs to be $99k (29.1% below list).
- Recommended offer: $99k (29.1% below list) — sets the bar for 1% rule.
- Cap rate 5.7% vs local median 2.8% in Rogersville — top-decile yield for the area; either an underpriced asset or a hidden risk that comps aren't pricing in. Stress-test before assuming the spread holds.
Location & tenants
- Location reads 64/100 on livability (#168 in TN) — a middle-class / working-renter tenant base. Strengths: cost of living A+, housing A+, crime B+; Watch: amenities F, commute F, employment F.
- Rogersville (town): math 24% / reading 31% proficiency, ranked #81 of 139 in TN (top 58%) — low school quality limits family demand, transient renter base, plan for 1-2y turnover.
- Zoned schools: Rogersville Elementary (math 24% / reading 31%, grade F, #490 of 952 statewide, top 52%, 624 students, 0% FRL) — zoned schools average 0% FRL vs 38% district-wide (38 pts lower); this property's tenant base skews higher-income than the district average.
- Market conditions: 214 active listings in the ZIP; 6 comparable units currently listed for rent nearby; rentals at typical pace (median 23d on market — plan ~3-4 weeks tenant-placement turnaround); 151 units permitted in Hawkins County in 2024 (0 in 5+ unit buildings).
Forward outlook
- In year one you build about $6k of equity ($968 loan paydown + $5k appreciation (3.6% local appreciation)).
- Hawkins County population projected at -17% by 2050 — secular population decline; favor cash flow + early exit over multi-decade hold.
- At projected returns (3.6% appreciation + 3.0% rent growth), your $39k cash investment doubles in ~6 years — after that, you're playing with house money.
- By year 6, paydown + projected appreciation supports a ~$32k cash-out refi (75% LTV) — recoverable capital for the next deal without selling this one.
Negotiation context
- Only 12 days on market — expect competitive offers; lowballing is unlikely to land.
- 2 sale attempts with the ask held roughly flat each time — persistent listings suggest the price (not the market) is what's stuck; bring a comps-based counter.
Risks & watch-outs
- Watch-outs: built in 1945 — expect roof / HVAC / electrical / plumbing capex.
- Climate carrying-cost: extreme-heat days projected 7→21/yr by 2055 (HVAC capex compounding) — expect insurance premiums to compound above CPI over the hold.
Questions for the listing agent
- What do current leases actually rent for vs. the listed asking? Can we see a recent rent roll and the last 12 months of T-12 income?
- Built in 1945 — when were the roof, HVAC, electrical panel, plumbing, and water heater last replaced?
- Is there a deadline driving the sale (1031 exchange, divorce, estate, relocation)? That informs how much negotiation room exists.
- Schools are F-rated, which usually means shorter tenancies and higher turnover. Who's the typical renter profile here, and what's been the actual vacancy rate?
- The area grade is low — what's the realistic commute time and amenity access for the typical tenant pool here? Any planned neighborhood developments (good or bad) we should know about?
- What's the average days-on-market for RENTAL listings here right now (not sales)? A rising rental-DOM trend means longer vacancies and softer asking-rent achievability than the comps imply.
- What's the recent tenant-quality profile in this submarket — average credit score on applications, eviction rate, late-payment / NSF rate, and stable-employment percentage? A property-management company in the area should have these aggregated.
- How much new for-sale + rental construction is in the pipeline within 1–3 miles? Heavy new supply typically softens prices + rents 12–24 months out; constrained supply supports both.
Investment metrics
- 1% rule
- 0.71% ✗
- Cap rate
- 5.73%
- Cash-on-cash
- -2.02%
- DSCR
- 0.91
- GRM
- 11.8
CMA / ARV
- ARV (on-the-fly)
- $238,008
- Comps found
- 1
Show comp detail 1 sale within ~0.75 mi
| Address | Dist | Beds/Ba | Sqft | Sold | Price | $/sf | Match |
|---|---|---|---|---|---|---|---|
| 4727 Highway 66 | 0.65mi | 2/1.0 | 1,116 (-1%) | 24mo | $235,000 | $211 | 48 |
Match score weights: distance 35% · size 25% · config 20% · recency 20%. Top-matched comps best support the ARV.
Projected returns pro-forma
3.64% appreciation · 3.0% rent growth · sell at horizon
- IRR
- 7.4%
- Equity multiple
- 1.44×
- Total profit
- $17,374
- Equity at exit
- $68,029
- IRR
- 9.8%
- Equity multiple
- 2.58×
- Total profit
- $61,936
- Equity at exit
- $108,973
Cash invested: $39,200 (down + closing). Projections, not guarantees.
Landlord ↔ Tenant lean methodology
- Overall (STATE)
- 87 Strongly Landlord-Friendly
- State Tennessee
- 87 Strongly Landlord-Friendly · R+13
- County
- — inherits STATE
- City
- — inherits STATE
ZIP-level market 37857
- Home prices YoY
- 1.1%
- Active inventory
- 214
- Price-to-rent
- 11.8×
Monthly cashflow live
- Estimated rent
- $992 high interval (Pro) →
- Mortgage (P&I)
- −$734
- Tax from tax record
- −$57 /mo · $686/yr
- Insurance
- −$58
- HOA
- −$0
- Vacancy / Maint / Mgmt
- −$208
- Net cashflow
- $-66
Break-even live
Sensitivity live
| Price | -10% $13 | -5% $-26 | +0% $-66 | +5% $-106 | +10% $-145 |
|---|---|---|---|---|---|
| Rent | -10% $-144 | -5% $-105 | +0% $-66 | +5% $-27 | +10% $12 |
| Rate | -1.0pp $4 | -0.5pp $-30 | base $-66 | +0.5pp $-102 | +1.0pp $-139 |
UW: 25.0% down · 7.5% · 30yr · 1.5% tax · 5.0% vac · 8.0% maint · 8.0% mgmt
Financing live
Cash to close
- Down payment
- $35,000
- Closing costs
- $4,200
- Reserves months
- —
- Total cash needed
- —
Loan-product check · same deal, 3 products live
Conventional
25% down · 7.5% · 30yr
- Down + closing
- —
- Monthly P&I
- —
- Monthly cashflow
- —
- DSCR
- —
- Eligible?
- —
Personal DTI + credit; lowest rate.
DSCR
20% down · 8.5% · 30yr
- Down + closing
- —
- Monthly P&I
- —
- Monthly cashflow
- —
- DSCR
- —
- Eligible?
- —
No personal income docs; deal must DSCR.
Hard money
10% down · 12.0% · 12mo
- Down + closing
- —
- Monthly P&I
- —
- Monthly cashflow
- —
- DSCR
- —
- Eligible?
- —
Short-term bridge; refi at stabilization.
Rent comps 6 comps
| Address | Beds | Baths | Sqft | Rent | $/sqft | DOM | Units | Dist |
|---|---|---|---|---|---|---|---|---|
| 106 Brewer St Rogersville, TN | 2.0 | 1.0 | 989 | $1,100 | $1.11 | 15d | 1 | 0.30mi |
| 329 N Boyd St Unit 1 Rogersville, TN | 2.0 | 1.0 | 800 | $975 | $1.22 | 15d | 1 | 0.86mi |
| 329 Boyd St Unit 23 Rogersville, TN | 1.0 | 1.0 | 800 | $800 | $1.00 | 23d | 1 | 0.86mi |
| 303 Farside Dr Unit 5 Rogersville, TN | 2.0 | 1.0 | 790 | $950 | $1.20 | 45d | 1 | 0.90mi |
| 211 Dodge Dr Apt C2 Rogersville, TN | 2.0 | 1.0 | 780 | $910 | $1.17 | 45d | 1 | 0.99mi |
| 200 Arrowhead Dr Rogersville, TN | 1.0–2.0 | 1.0 | 816 | $886 | $1.09 | 23d | 1 | 1.47mi |
Listing history 9 events
-
2026-06-21days on market $140,000 Active 12 DOM
-
2026-06-21days on market $140,000 Active 11 DOM
-
2026-06-18days on market $140,000 Active 9 DOM
-
2026-06-17days on market $140,000 Active 8 DOM
-
2026-06-16days on market $140,000 Active 7 DOM
-
2026-06-15days on market $140,000 Active 6 DOM
-
2026-06-13days on market $140,000 Active 4 DOM
-
2026-06-12remarks 504-char remark
-
2026-06-12$140,000 Active 3 DOM
ⓘ Source: listings_history table (triggers on properties + properties_extension) + one-shot
backfill from property_details.listing_events for pre-trigger history.
Tax reassessment forecast TN · Resets to sale price
- Current annual tax
- $686 · $57/mo
- Projected year-2 tax
- $994 · $83/mo
- Expected delta
- +$308/yr (+$26/mo · 44.9%)
ⓘ Screening estimate from a state-policy table — verify with the county assessor before closing.
Climate risk First Street
- Flood 1/10 Low FEMA zone X (unshaded) · 0% chance over 30 yrs
- Wildfire 3/10 Moderate
- Heat 5/10 Major 7 d/yr ≥102°F today · 21 d/yr by 30 yrs out
- Wind 2/10 Low
- Air quality 3/10 Moderate 2 unhealthy d/yr today · 3 by 30 yrs out
Nearby sold comps map
Loading sold comps map…
Walkable amenities ~0.75 mi
Loading nearby amenities…
Taxation est. · year 1
- Rental income
- $11,903
- − Mortgage interest
- −$7,842
- − Property taxes
- −$686
- − Insurance
- −$700
- − Repairs & maintenance
- −$952
- − Management
- −$952
- − Depreciation
- −$4,073
- Taxable loss
- −$3,302
- Est. tax savings @ 24.0%
- +$793
- After-tax cash flow
- $0/yr
For passive investors: Depreciation is non-cash, so a rental often shows a tax loss while cash-flowing — sheltering income. Rental losses are passive: they offset passive income freely, and up to $25,000/yr can offset ordinary (W-2) income if you actively participate and your MAGI is under $100k (phasing out to $0 by $150k); unused losses carry forward. On sale, claimed depreciation is recaptured at up to 25%, and gains may owe capital-gains tax (a 1031 exchange can defer both). Figures are a year-1 estimate at your 24.0% rate — not tax advice; consult a CPA.
Schools (NCES district)
- District
- Rogersville
- NCES district ID
- 4703660
- Math proficiency
- 24% ▼ -21.00%
- Reading proficiency
- 31% ▼ -8.00%
- Median HH income
- $26,728
- Composite
- 21.88/100
- National rank
- #8235
- State rank
- #81 of 139 in TN
Livability — Rogersville
- Score
- 64/100
- State rank
- #168
- US rank
- #14424
Category grades
Schools grade is shown separately in the Schools card above.
Census & demographics
- Census place
- Rogersville, TN
- Population (ZIP)
- 20,425
Population outlook (Hawkins County) Hauer SSP2
- Today (2025)
- 55,226 people
- By 2030
- 53,784 · -2.6%
- By 2040
- 50,015 · -9.4%
- By 2050
- 45,682 · -17.3%
- By 2075
- 36,211 · -34.4%
- By 2100
- 26,536 · -52.0%
Race, ethnicity, and origin ACS 2023
- Neighborhood character
- Predominantly White (94%)
- Race & ethnicity
- White 94% Two or more races 4% Black 2% Hispanic / Latino 2%
- Common ancestry
- Serbian 2% Italian 1% Slovak 1%
- Foreign-born
- 2% · Canada
- Languages at home
- 98% English-only · Spanish 2%
Political lean MEDSL · Hawkins
- 2024 margin
- Solid R (+68.8) · D 15.2% · R 84.0%
- 2008→2024 swing
- -26.9pp toward R · 2008: -42.0pp · 2024: -68.8pp
- All cycles
- 2024: R+68.8 2020: R+65.8 2016: R+63.4 2012: R+47.0 2008: R+42.0
Not yet ingested
- Civics
- —
Market trends
- HPI YoY
- ▲ 3.64%
- Current HPI
- 331.2027
- Rent YoY
- —
- Metro
- —
- State GDP YoY
- ▲ 2.78%
- F500 in state
- 22
Industry mix (Fortune 500 HQ in TN)
| Industry | F500 HQs | Revenue |
|---|---|---|
| Healthcare | 3 | $91B |
|
||
| Retail | 3 | $72B |
|
||
| Transportation / Logistics | 1 | $88B |
|
||
| Paper / Packaging | 1 | $19B |
|
||
| Insurance | 1 | $13B |
|
||
| Energy | 1 | $12B |
|
||
Price history
-12.5% since first listed2 events — show timeline
- 2026-06-09 Listed $140,000 TVRMLS
- 2026-06-09 Listed $160,000 TVRMLS
Property tax history
+1.5%/yrLatest (2025): $686 · +0.0% YoY. Source: county tax records.
Cash-flow waterfall
monthlySold comps — $/sqft
last 12 mo · ≤1 miLoading sold comps…