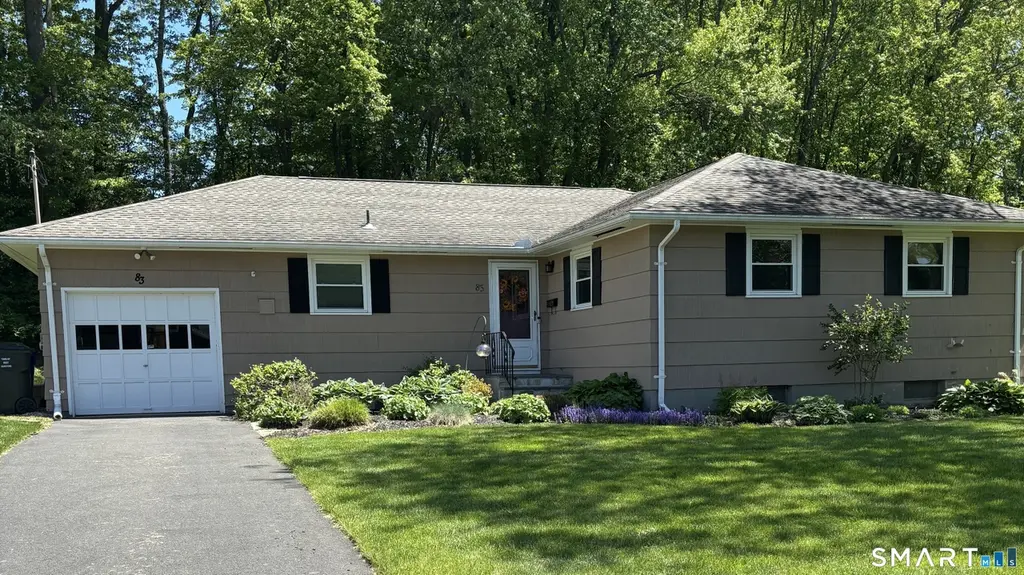
83 Northbrook Dr · West Hartford, CT
Flood risk 1/10 · Minimal
- FEMA flood zone
- X (unshaded)
- Chance of flooding over 30 yrs
- 0.0%
- Est. flood insurance / yr
- $473 – $860
Fire risk 1/10 · Minimal
- Est. fire insurance / yr
- $829 – $1,539
Heat risk 5/10 · Moderate
- Hot days now (above 97°F)
- 7 days/yr
- Hot days in 30 yrs
- 15 days/yr
Wind risk 6/10 · Moderate
- Chance of severe wind over 30 yrs
- 27.0%
Air-quality risk 3/10 · Minor
- Unhealthy air days now
- 3 days/yr
- Unhealthy air days in 30 yrs
- 4 days/yr
Risk factors via First Street. Map © Google.
Why this score? — see what drove the D grade
The composite is a weighted blend of 9 inputs, each scored 0–100. Each bar is that input's sub-score; the figure is the points it added to the 100-point composite (weight × sub-score).
- Cash flow +13.3/30.0
- ARV discount +8.4/15.0
- Schools +5.6/10.0
- 1% rule +4.2/10.0
- DSCR +4.0/10.0
- Livability +4.0/5.0
- Rent growth +2.5/5.0
- Condition / age +2.5/5.0
- Appreciation +0.0/10.0
$399,900
🖨 Deal sheet (PDF) 📄 Offer letter ✓ Due diligence
Listing remarks MLS
Nice spacious open airy feeling thruout! Lrge sunny kit*hdwd flrs undr all carp(main lev) furn 6 yrs* roof 7 yrs*1st flr laund*addit 472 sf in newly refurb llw/new carp&ceiling tiles*quiet very low traffic area*very well maintained!
Key facts
- 0.26 acre lot
- Garage
- Built 1960
Property features AI
Exterior
- Parking: Attached garage (1-car)
- Utilities: Public water connected; Public sewer connected; Domestic hot water (oil)
- Home design: Single-family home; Tan exterior color
- Construction: Frame construction; Concrete foundation; Asphalt shingle roof; Has attic (access via hatch)
- Exterior features: Deck; Gutters; Underground sprinkler; Lightly wooded, treed, level lot
Interior
- Kitchen: Electric cooktop; Wall oven; Refrigerator; Dishwasher; Garbage disposal
- Bedrooms: 3 bedrooms
- Bathrooms: 2 full bathrooms
- Heating & cooling: Hot water heating (oil-fired); Wall cooling unit; Oil tank located in basement
- Interior features: Auto garage door opener; Cable available; Security system; Storm doors
- Laundry & utility: Washer and dryer; Laundry on main level
Neighborhood map
What this means for you Summary
Snapshot
- This is a 3-bed/2.0-bath single-family listed at $400k.
Deal economics
- At list price, monthly cash flow is $3 ($30/yr) — positive.
- The deal already cash-flows at list — no discount required.
- To meet the 1% rule (rent ≥ 1% of price), the offer needs to be $367k (8.2% below list).
- Recommended offer: $367k (8.2% below list) — sets the bar for 1% rule.
- Cap rate 6.3% vs local median 3.3% in West Hartford — top-decile yield for the area; either an underpriced asset or a hidden risk that comps aren't pricing in. Stress-test before assuming the spread holds.
Location & tenants
- Location reads 79/100 on livability (#27 in CT, #1,989 nationally) — a middle-class / working-renter tenant base. Strengths: employment A+, housing A+, crime B+; Watch: amenities F, cost of living F.
- West Hartford School District (urban): math 56% / reading 67% proficiency, ranked #39 of 153 in CT (top 26%) — acceptable for families but not a draw, mixed tenant base, ~2y average lease; only 16% free/reduced lunch — higher-income household profile.
- Zoned schools: Aiken School (math 62% / reading 72%, grade B+, #99 of 553 statewide, top 19%, 415 students, 13% FRL); King Philip Middle School (math 53% / reading 69%, grade B+, #41 of 175 statewide, top 25%, 815 students, 26% FRL); Hall High School (math 62% / reading 82%, grade B+, #14 of 194 statewide, top 8%, 1,408 students, 20% FRL) — zoned schools at 20% FRL track the district average.
- Market conditions: 78 active listings in the ZIP; 7 comparable units currently listed for rent nearby; rentals leasing fast (median 14d on market — plan ~1-2 weeks tenant-placement turnaround); high-income renter base; 1,867 units permitted in Capitol Planning Region in 2024 (1,399 in 5+ unit buildings).
Forward outlook
- Local home prices are declining (-3.0%/yr); year-one equity from $3k of loan paydown is wiped out by about $12k of value loss. Plan a longer hold.
Negotiation context
- Only 2 days on market — expect competitive offers; lowballing is unlikely to land.
- 2 sale attempts since 21y ago with the ask held roughly flat each time — persistent listings suggest the price (not the market) is what's stuck; bring a comps-based counter.
Risks & watch-outs
- Climate carrying-cost: major wind risk, 27% chance of damaging wind over 30y; extreme-heat days projected 7→15/yr by 2055 (HVAC capex compounding) — expect insurance premiums to compound above CPI over the hold.
Questions for the listing agent
- Built in 1960 — when were the roof, HVAC, electrical panel, plumbing, and water heater last replaced?
- Is there a deadline driving the sale (1031 exchange, divorce, estate, relocation)? That informs how much negotiation room exists.
- Schools are A-rated — typically a magnet for longer-tenancy family renters. What's the average tenant stay here, and is there a school-zone premium baked into asking?
- The area grade is low — what's the realistic commute time and amenity access for the typical tenant pool here? Any planned neighborhood developments (good or bad) we should know about?
- What's the average days-on-market for RENTAL listings here right now (not sales)? A rising rental-DOM trend means longer vacancies and softer asking-rent achievability than the comps imply.
- What's the recent tenant-quality profile in this submarket — average credit score on applications, eviction rate, late-payment / NSF rate, and stable-employment percentage? A property-management company in the area should have these aggregated.
- How much new for-sale + rental construction is in the pipeline within 1–3 miles? Heavy new supply typically softens prices + rents 12–24 months out; constrained supply supports both.
Investment metrics
- 1% rule
- 0.92% ✗
- Cap rate
- 6.30%
- Cash-on-cash
- 0.03%
- DSCR
- 1.00
- GRM
- 9.1
CMA / ARV
- ARV (on-the-fly)
- $407,862
- Comps found
- 3
Show comp detail 3 sales within ~0.75 mi
| Address | Dist | Beds/Ba | Sqft | Sold | Price | $/sf | Match |
|---|---|---|---|---|---|---|---|
| 115 Northbrook Dr | 0.14mi | 3/1.5 | 1,472 (-2%) | 6mo | $400,000 | $272 | 84 |
| 11 Alderwood Dr | 0.10mi | 3/3.0 | 1,488 (-0%) | 18mo | $415,000 | $279 | 76 |
| 11 Timberwood Rd #11 | 0.72mi | 2/3.5 (-1) | 1,650 (+10%) | 21mo | $450,000 | $273 | 20 |
Match score weights: distance 35% · size 25% · config 20% · recency 20%. Top-matched comps best support the ARV.
Projected returns pro-forma
-3.0% appreciation · 3.0% rent growth · sell at horizon
- IRR
- -16.2%
- Equity multiple
- 0.42×
- Total profit
- $-64,503
- Equity at exit
- $59,626
- IRR
- -7.8%
- Equity multiple
- 0.51×
- Total profit
- $-55,403
- Equity at exit
- $34,576
Cash invested: $111,972 (down + closing). Projections, not guarantees.
Landlord ↔ Tenant lean methodology
- Overall (STATE)
- 27 Tenant-Leaning
- State Connecticut
- 27 Tenant-Leaning · D+7
- County
- — inherits STATE
- City
- — inherits STATE
ZIP-level market 06117
- Active inventory
- 78
- Price-to-rent
- 9.1×
Monthly cashflow live
- Estimated rent
- $3,670 high interval (Pro) →
- Mortgage (P&I)
- −$2,097
- Tax from tax record
- −$633 /mo · $7,598/yr
- Insurance
- −$167
- HOA
- −$0
- Vacancy / Maint / Mgmt
- −$771
- Net cashflow
- $3
Break-even live
Sensitivity live
| Price | -10% $229 | -5% $116 | +0% $3 | +5% $-111 | +10% $-224 |
|---|---|---|---|---|---|
| Rent | -10% $-287 | -5% $-142 | +0% $3 | +5% $147 | +10% $292 |
| Rate | -1.0pp $204 | -0.5pp $104 | base $3 | +0.5pp $-101 | +1.0pp $-207 |
UW: 25.0% down · 7.5% · 30yr · 1.5% tax · 5.0% vac · 8.0% maint · 8.0% mgmt
Financing live
Cash to close
- Down payment
- $99,975
- Closing costs
- $11,997
- Reserves months
- —
- Total cash needed
- —
Loan-product check · same deal, 3 products live
Conventional
25% down · 7.5% · 30yr
- Down + closing
- —
- Monthly P&I
- —
- Monthly cashflow
- —
- DSCR
- —
- Eligible?
- —
Personal DTI + credit; lowest rate.
DSCR
20% down · 8.5% · 30yr
- Down + closing
- —
- Monthly P&I
- —
- Monthly cashflow
- —
- DSCR
- —
- Eligible?
- —
No personal income docs; deal must DSCR.
Hard money
10% down · 12.0% · 12mo
- Down + closing
- —
- Monthly P&I
- —
- Monthly cashflow
- —
- DSCR
- —
- Eligible?
- —
Short-term bridge; refi at stabilization.
Rent comps 7 comps
| Address | Beds | Baths | Sqft | Rent | $/sqft | DOM | Units | Dist |
|---|---|---|---|---|---|---|---|---|
| 42 Alderwood Dr West Hartford, CT | 3.0 | 1.5 | 1470 | $3,300 | $2.24 | 13d | 1 | 0.14mi |
| 38 Portage Rd West Hartford, CT | 4.0 | 3.0 | 1842 | $3,950 | $2.14 | 3d | 1 | 0.27mi |
| 2 Francis Way Bloomfield, CT | 1.0–3.0 | 1.0–2.0 | 1037 | $3,194 | $3.08 | 3d | 18 | 0.87mi |
| 83 Hilldale Rd Unit Bdrm3 West Hartford, CT | 3.0 | 2.0 | 1732 | $1,400 | $0.81 | 18d | 1 | 1.21mi |
| 65 Jolley Dr Bloomfield, CT | 1.0–3.0 | 1.0–2.0 | 1054 | $4,500 | $4.27 | 45d | 16 | 1.27mi |
| 115 Hilldale Rd West Hartford, CT | 3.0 | 2.5 | 1448 | $3,750 | $2.59 | 12d | 1 | 1.36mi |
| 14 Revere Dr Bloomfield, CT | 2.0 | 1.0 | 980 | $2,088 | $2.13 | 45d | 1 | 1.47mi |
Listing history 6 events
-
2026-05-22status Under Contract
-
2026-05-21$399,900 Active
-
2026-05-18historical $399,900
-
2005-10-28soldstatus $242,500
-
2005-10-27soldstatus $242,500 236-char remark
Show marketing remark (236 chars)
Nice spacious open airy feeling thruout! Lrge sunny kit*hdwd flrs undr all carp(main lev) furn 6 yrs* roof 7 yrs*1st flr laund*addit 472 sf in newly refurb llw/new carp&ceiling tiles*quiet very low traffic area*very well maintained!
-
2005-09-14$249,000 236-char remark
Show marketing remark (236 chars)
Nice spacious open airy feeling thruout! Lrge sunny kit*hdwd flrs undr all carp(main lev) furn 6 yrs* roof 7 yrs*1st flr laund*addit 472 sf in newly refurb llw/new carp&ceiling tiles*quiet very low traffic area*very well maintained!
ⓘ Source: listings_history table (triggers on properties + properties_extension) + one-shot
backfill from property_details.listing_events for pre-trigger history.
Tax reassessment forecast CT · Partial reset (capped growth)
- Current annual tax
- $7,598 · $633/mo
- Projected year-2 tax
- $8,078 · $673/mo
- Expected delta
- +$480/yr (+$40/mo · 6.3%)
ⓘ Screening estimate from a state-policy table — verify with the county assessor before closing.
Climate risk First Street
- Flood 1/10 Low FEMA zone X (unshaded) · 0% chance over 30 yrs
- Wildfire 1/10 Low
- Heat 5/10 Major 7 d/yr ≥97°F today · 15 d/yr by 30 yrs out
- Wind 6/10 Major 27% chance of damaging wind over 30 yrs
- Air quality 3/10 Moderate 3 unhealthy d/yr today · 4 by 30 yrs out
Nearby sold comps map
Loading sold comps map…
Walkable amenities ~0.75 mi
Loading nearby amenities…
Taxation est. · year 1
- Rental income
- $44,042
- − Mortgage interest
- −$22,401
- − Property taxes
- −$7,598
- − Insurance
- −$2,000
- − Repairs & maintenance
- −$3,523
- − Management
- −$3,523
- − Depreciation
- −$11,633
- Taxable loss
- −$6,636
- Est. tax savings @ 24.0%
- +$1,593
- After-tax cash flow
- $1,623/yr
For passive investors: Depreciation is non-cash, so a rental often shows a tax loss while cash-flowing — sheltering income. Rental losses are passive: they offset passive income freely, and up to $25,000/yr can offset ordinary (W-2) income if you actively participate and your MAGI is under $100k (phasing out to $0 by $150k); unused losses carry forward. On sale, claimed depreciation is recaptured at up to 25%, and gains may owe capital-gains tax (a 1031 exchange can defer both). Figures are a year-1 estimate at your 24.0% rate — not tax advice; consult a CPA.
Schools (NCES district)
- District
- West Hartford School District
- NCES district ID
- 0904920
- Math proficiency
- 56% ▼ -6.00%
- Reading proficiency
- 67% ▼ -5.00%
- Median HH income
- $85,173
- Composite
- 55.64/100
- National rank
- #1228
- State rank
- #39 of 153 in CT
Livability — West Hartford
- Score
- 79/100
- State rank
- #27
- US rank
- #1989
Category grades
Schools grade is shown separately in the Schools card above.
Census & demographics
- Census place
- West Hartford, CT
- County
- Hartford County · 754,208 people
- City population
- 63,441
- Metro
- Hartford-East Hartford-Middletown, CT
- Population (ZIP)
- 16,116
- Household income
- $171,707
- Rent vs Own
- Severe rent burden
- 336.0
Population outlook (Capitol County) Hauer SSP2
- By 2040
- 1,063,519
Race, ethnicity, and origin ACS 2023
- Neighborhood character
- Predominantly White (72%)
- Race & ethnicity
- White 72% Asian 10% Two or more races 7% Hispanic / Latino 6% Black 6%
- Hispanic origin (detail)
- Common ancestry
- Romanian 6% Scotch-Irish 5% Italian 2%
- Foreign-born
- 20% · Canada, China, Vietnam
- Languages at home
- 77% English-only · Other Indo-European 6% Spanish 5% Russian/Polish/Slavic 4%
Political lean MEDSL · Capitol
- 2024 margin
- Strong D (+21.9) · D 60.1% · R 38.2% · Other 1.7%
- All cycles
- 2024: D+21.9
Not yet ingested
- Civics
- —
Market trends
- HPI YoY
- ▼ -191.98%
- Current HPI
- 176.7207
- Rent YoY
- —
- Metro
- Hartford-East Hartford-Middletown, CT
- State GDP YoY
- ▲ 1.06%
- F500 in state
- 38
Industry mix (Fortune 500 HQ in CT)
| Industry | F500 HQs | Revenue |
|---|---|---|
| Industrial Machinery | 4 | $38B |
|
||
| Insurance | 3 | $71B |
|
||
| Financial Services | 2 | $25B |
|
||
| Transportation / Logistics | 2 | $18B |
|
||
| Healthcare | 1 | $247B |
|
||
| Telecommunications | 1 | $55B |
|
||
Price history
+70.7% since first listed7 events — show timeline
- 2026-06-11 Sold (MLS) $425,000 Smart MLS
- 2026-05-22 Pending — Smart MLS
- 2026-05-21 Listed $399,900 Smart MLS
- 2026-05-18 Coming Soon $399,900 Smart MLS
- 2005-10-28 Sold (Public Records) $242,500 Public Records
- 2005-10-27 Sold (MLS) $242,500 Smart MLS
- 2005-09-14 Listed $249,000 Smart MLS
Property tax history
+2.1%/yrLatest (2025): $7,598 · +5.7% YoY. Source: county tax records.
Cash-flow waterfall
monthlySold comps — $/sqft
last 12 mo · ≤1 miLoading sold comps…