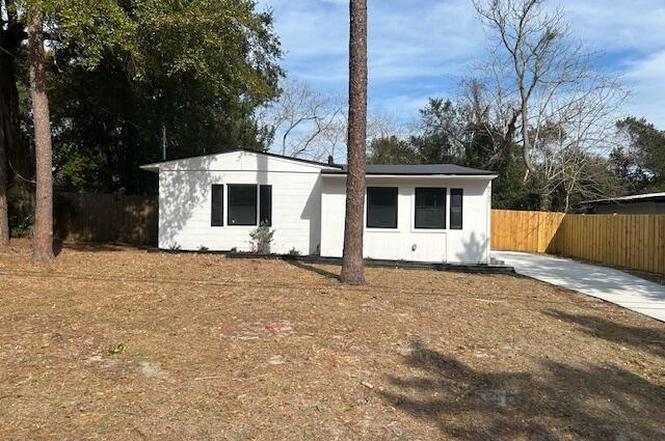
9727 Tiffany Ave · Jacksonville, FL
Flood risk 1/10 · Minimal
- FEMA flood zone
- X (unshaded)
- Chance of flooding over 30 yrs
- 0.0%
- Est. flood insurance / yr
- $507 – $1,088
Fire risk 4/10 · Minor
- Est. fire insurance / yr
- $947 – $1,759
Heat risk 9/10 · Severe
- Hot days now (above 107°F)
- 7 days/yr
- Hot days in 30 yrs
- 20 days/yr
Wind risk 9/10 · Severe
- Chance of severe wind over 30 yrs
- 99.0%
Air-quality risk 4/10 · Minor
- Unhealthy air days now
- 6 days/yr
- Unhealthy air days in 30 yrs
- 6 days/yr
Risk factors via First Street. Map © Google.
Why this score? — see what drove the D- grade
The composite is a weighted blend of 9 inputs, each scored 0–100. Each bar is that input's sub-score; the figure is the points it added to the 100-point composite (weight × sub-score).
- Cash flow +14.7/30.0
- DSCR +4.5/10.0
- Livability +4.2/5.0
- Schools +3.9/10.0
- 1% rule +3.7/10.0
- Condition / age +2.5/5.0
- ARV discount +1.9/15.0
- Rent growth +1.9/5.0
- Appreciation +0.0/10.0
$209,000
🖨 Deal sheet (PDF) 📄 Offer letter ✓ Due diligence
Listing remarks
WOW! Completely rehabbed 3 bedroom, 2 Bath home near Southside! New driveway, New rear patio, New bathrooms and fixtures, New roof, New electrical panel, New wiring, New windows, New AC, New kitchen with island, New tankless water heater, New side fence and gates. This cutie is fenced in the back as well. This gem is close to all kinds of shopping and entertainment. This home is ready for you! Seller will install all new kitchen appliances, including new refrigerator with a full priced offer!
Key facts
- New rear patio
- New wiring
- New driveway
Tags
Property features AI
Finance
- HOA & community: Not a senior community
Exterior
- Parking: Other parking
- Utilities: Electricity connected; Water connected; Sewer connected (Septic tank)
- Home design: Single family residence; Used as residential single-family
- Exterior features: Lot is approximately 0.2 acres; No private pool
Interior
- Kitchen: Dishwasher
- Bedrooms: 3 bedrooms
- Bathrooms: 2 full bathrooms
- Heating & cooling: Central heating; Central air conditioning
- Interior features: Dishwasher
- Laundry & utility: Unfurnished (no built-in/stacked laundry specified)
Neighborhood map
What this means for you Summary
Snapshot
- This is a 3-bed/1.0-bath single-family listed at $209k.
Deal economics
- At list price, monthly cash flow is $54 ($650/yr) — positive.
- The deal already cash-flows at list — no discount required.
- To meet the 1% rule (rent ≥ 1% of price), the offer needs to be $181k (13.3% below list).
- Recommended offer: $181k (13.3% below list) — sets the bar for 1% rule.
- Cap rate 6.6% vs local median 3.9% in Jacksonville — top-decile yield for the area; either an underpriced asset or a hidden risk that comps aren't pricing in. Stress-test before assuming the spread holds.
Location & tenants
- Location reads 83/100 on livability (#50 in FL, #911 nationally) — a professional / high-income tenant draw. Strengths: amenities A+, commute A+, housing A+.
- Duval (urban): math 46% / reading 45% proficiency, ranked #48 of 73 in FL (top 66%) — families likely to look elsewhere, expect single-tenant / working-renter base with shorter leases.
- Zoned schools: Windy Hill Elementary School (math 45% / reading 31%, grade F, #1,587 of 2,144 statewide, top 74%, 494 students, 74% FRL); Twin Lakes Academy Middle School (math 43% / reading 38%, grade F, #360 of 571 statewide, top 64%, 1,076 students, 44% FRL); Englewood High School (math 21% / reading 21%, grade F, #551 of 667 statewide, top 83%, 1,741 students, 58% FRL).
- Zoned-school proficiency averages 33% at this address vs 46% district-wide (-12 pts) — the specific schools serving this property underperform the Duval average; the district grade overstates school quality for this exact location.
- Market conditions: Rents soft (-2.4%/yr); 213 active listings in the ZIP; 15 comparable units currently listed for rent nearby; rentals at typical pace (median 15d on market — plan ~3-4 weeks tenant-placement turnaround); solid renter incomes; 6,503 units permitted in Duval County in 2024 (1,131 in 5+ unit buildings).
Forward outlook
- Local home prices are declining (-3.0%/yr); year-one equity from $1k of loan paydown is wiped out by about $6k of value loss. Plan a longer hold.
- Duval County population projected at +19% by 2050 — long-run rental-demand tailwind backs the buy-and-hold thesis.
Negotiation context
- It's been on market 112 days — a 9% lower offer ($190k) is reasonable based on typical stale-listing flexibility.
- Current owner paid $38k; list at $209k implies a 457% gain — meaningful room to come down on a strong offer.
Risks & watch-outs
- Watch-outs: built in 1952 — expect roof / HVAC / electrical / plumbing capex.
- Climate carrying-cost: severe wind risk, 99% chance of damaging wind over 30y; extreme-heat days projected 7→20/yr by 2055 (HVAC capex compounding) — expect insurance premiums to compound above CPI over the hold.
Questions for the listing agent
- It's been on market 112 days. Have you received any prior offers? Is the seller open to a 13% concession, seller financing, or rate buy-down credit?
- Built in 1952 — when were the roof, HVAC, electrical panel, plumbing, and water heater last replaced?
- Why hasn't it sold? Are there any deal-killer items the seller is aware of (foundation, flood, title, zoning, code violations)?
- Is there a deadline driving the sale (1031 exchange, divorce, estate, relocation)? That informs how much negotiation room exists.
- Schools are B-rated — typically a magnet for longer-tenancy family renters. What's the average tenant stay here, and is there a school-zone premium baked into asking?
- The area grade is low — what's the realistic commute time and amenity access for the typical tenant pool here? Any planned neighborhood developments (good or bad) we should know about?
- What's the average days-on-market for RENTAL listings here right now (not sales)? A rising rental-DOM trend means longer vacancies and softer asking-rent achievability than the comps imply.
- What's the recent tenant-quality profile in this submarket — average credit score on applications, eviction rate, late-payment / NSF rate, and stable-employment percentage? A property-management company in the area should have these aggregated.
- How much new for-sale + rental construction is in the pipeline within 1–3 miles? Heavy new supply typically softens prices + rents 12–24 months out; constrained supply supports both.
Investment metrics
- 1% rule
- 0.87% ✗
- Cap rate
- 6.60%
- Cash-on-cash
- 1.11%
- DSCR
- 1.05
- GRM
- 9.6
CMA / ARV
- ARV (on-the-fly)
- $186,048
- Comps found
- 12
Show comp detail 12 sales within ~0.75 mi
| Address | Dist | Beds/Ba | Sqft | Sold | Price | $/sf | Match |
|---|---|---|---|---|---|---|---|
| 9814 Buncome Rd | 0.06mi | 2/1.0 (-1) | 756 (-7%) | 10mo | $175,000 | $231 | 71 |
| 3445 Peach Dr | 0.47mi | 3/1.0 | 840 (+3%) | 3mo | $220,000 | $262 | 70 |
| 4026 Eve Dr E | 0.60mi | 3/1.0 | 813 (-0%) | 2mo | $182,500 | $224 | 70 |
| 3749 Bunnell Dr | 0.53mi | 2/1.0 (-1) | 816 (0%) | 6mo | $126,000 | $154 | 65 |
| 3749 Eve Dr E | 0.34mi | 2/1.0 (-1) | 778 (-5%) | 9mo | $200,000 | $257 | 64 |
| 3828 Eve Dr E | 0.41mi | 3/1.0 | 888 (+9%) | 7mo | $93,000 | $105 | 60 |
| 9834 Elaine Rd | 0.15mi | 2/1.0 (-1) | 704 (-14%) | 13mo | $155,000 | $220 | 54 |
| 4111 Ruby Dr W | 0.64mi | 2/1.0 (-1) | 777 (-5%) | 10mo | $61,000 | $79 | 49 |
| 3605 Bunnell Dr | 0.47mi | 2/1.0 (-1) | 896 (+10%) | 12mo | $185,000 | $206 | 47 |
| 4140 Ruby Dr E | 0.69mi | 2/1.0 (-1) | 816 (0%) | 19mo | $219,900 | $269 | 47 |
| 4120 Ruby Dr E | 0.65mi | 2/1.0 (-1) | 744 (-9%) | 16mo | $170,000 | $228 | 37 |
| 4170 Ruby Dr E | 0.74mi | 3/1.0 | 896 (+10%) | 19mo | $227,900 | $254 | 33 |
Match score weights: distance 35% · size 25% · config 20% · recency 20%. Top-matched comps best support the ARV.
Projected returns pro-forma
-3.0% appreciation · 0.0% rent growth · sell at horizon
- IRR
- -17.8%
- Equity multiple
- 0.39×
- Total profit
- $-35,743
- Equity at exit
- $31,163
- IRR
- -16.7%
- Equity multiple
- 0.19×
- Total profit
- $-47,268
- Equity at exit
- $18,071
Cash invested: $58,520 (down + closing). Projections, not guarantees.
Landlord ↔ Tenant lean methodology
- Overall (STATE)
- 87 Strongly Landlord-Friendly
- State Florida
- 87 Strongly Landlord-Friendly · R+3
- County
- — inherits STATE
- City
- — inherits STATE
ZIP-level market 32246
- Rents YoY
- -2.4%
- Active inventory
- 213
- Price-to-rent
- 9.6×
Monthly cashflow live
- Estimated rent
- $1,813 high interval (Pro) →
- Mortgage (P&I)
- −$1,096
- Tax from tax record
- −$195 /mo · $2,338/yr
- Insurance
- −$87
- HOA
- −$0
- Vacancy / Maint / Mgmt
- −$381
- Net cashflow
- $54
Break-even live
Sensitivity live
| Price | -10% $172 | -5% $113 | +0% $54 | +5% $-5 | +10% $-64 |
|---|---|---|---|---|---|
| Rent | -10% $-89 | -5% $-17 | +0% $54 | +5% $126 | +10% $197 |
| Rate | -1.0pp $159 | -0.5pp $107 | base $54 | +0.5pp $0 | +1.0pp $-55 |
UW: 25.0% down · 7.5% · 30yr · 1.5% tax · 5.0% vac · 8.0% maint · 8.0% mgmt
Financing live
Cash to close
- Down payment
- $52,250
- Closing costs
- $6,270
- Reserves months
- —
- Total cash needed
- —
Loan-product check · same deal, 3 products live
Conventional
25% down · 7.5% · 30yr
- Down + closing
- —
- Monthly P&I
- —
- Monthly cashflow
- —
- DSCR
- —
- Eligible?
- —
Personal DTI + credit; lowest rate.
DSCR
20% down · 8.5% · 30yr
- Down + closing
- —
- Monthly P&I
- —
- Monthly cashflow
- —
- DSCR
- —
- Eligible?
- —
No personal income docs; deal must DSCR.
Hard money
10% down · 12.0% · 12mo
- Down + closing
- —
- Monthly P&I
- —
- Monthly cashflow
- —
- DSCR
- —
- Eligible?
- —
Short-term bridge; refi at stabilization.
Rent comps 15 comps
| Address | Beds | Baths | Sqft | Rent | $/sqft | DOM | Units | Dist |
|---|---|---|---|---|---|---|---|---|
| 10412 Skycrest Dr N Jacksonville, FL | 3.0 | 1.0 | 870 | $1,550 | $1.78 | 19d | 1 | 0.90mi |
| 8601 Beach Blvd Jacksonville, FL | 2.0–3.0 | 2.0 | 1234 | $1,700 | $1.38 | 3d | 3 | 0.90mi |
| 8343 Hogan Rd Jacksonville, FL | 1.0–3.0 | 1.0–2.0 | 1043 | $1,574 | $1.51 | 4d | 17 | 0.94mi |
| 8550 Touchton Rd Jacksonville, FL | 1.0–2.0 | 1.0–2.0 | 1035 | $1,650 | $1.59 | 23d | 2 | 1.02mi |
| 8550 Touchton Rd Jacksonville, FL | 1.0–2.0 | 1.0 | 966 | $1,395 | $1.44 | 4d | 2 | 1.02mi |
| 2613 Sandusky Ave E Jacksonville, FL | 3.0 | 2.0 | 1116 | $1,800 | $1.61 | 9d | 1 | 1.05mi |
| 4028 Loys Dr Jacksonville, FL | 3.0 | 2.0 | 1070 | $1,890 | $1.77 | 14d | 1 | 1.11mi |
| 9800 Touchton Rd Jacksonville, FL | 1.0–3.0 | 1.0–2.0 | 1160 | $1,903 | $1.64 | 25d | 1 | 1.17mi |
| 10520 Stone Rd Jacksonville, FL | 3.0 | 1.0 | 850 | $1,675 | $1.97 | 6d | 1 | 1.18mi |
| 4435 Touchton Rd E Jacksonville, FL | 1.0–2.0 | 1.0–2.0 | 978 | $2,163 | $2.21 | 23d | 5 | 1.24mi |
| 6650 Corporate Center Pkwy Jacksonville, FL | 1.0–3.0 | 1.0–2.0 | 990 | $3,308 | $3.34 | 3d | 12 | 1.28mi |
| 3451 Saland Way Jacksonville, FL | 2.0–3.0 | 2.0 | 1070 | $1,425 | $1.33 | 14d | 1 | 1.28mi |
| 8067 Parental Cir Jacksonville, FL | 2.0 | 1.0 | 624 | $1,200 | $1.92 | 25d | 1 | 1.33mi |
| 8037 Parental Cir Jacksonville, FL | 2.0 | 1.0 | 624 | $1,350 | $2.16 | 25d | 1 | 1.36mi |
| 7505 Beach Blvd Jacksonville, FL | 3.0 | 1.0–2.0 | 900 | $1,650 | $1.83 | 25d | 20 | 1.46mi |
Listing history 5 events
-
2026-04-18historical Active Under Contract
-
2026-03-31price $209,000
-
2026-03-03price $219,900
-
2026-02-03$234,900 Active
-
1998-03-10soldstatus $37,500
ⓘ Source: listings_history table (triggers on properties + properties_extension) + one-shot
backfill from property_details.listing_events for pre-trigger history.
Tax reassessment forecast FL · Resets to sale price
- Current annual tax
- $2,338 · $195/mo
- Projected year-2 tax
- $2,338 · $195/mo
- Expected delta
- $0/yr ($0/mo · 0.0%)
ⓘ Screening estimate from a state-policy table — verify with the county assessor before closing.
Climate risk First Street
- Flood 1/10 Low FEMA zone X (unshaded) · 0% chance over 30 yrs
- Wildfire 4/10 Moderate
- Heat 9/10 Extreme 7 d/yr ≥107°F today · 20 d/yr by 30 yrs out
- Wind 9/10 Extreme 99% chance of damaging wind over 30 yrs
- Air quality 4/10 Moderate 6 unhealthy d/yr today · 6 by 30 yrs out
Nearby sold comps map
Loading sold comps map…
Walkable amenities ~0.75 mi
Loading nearby amenities…
Taxation est. · year 1
- Rental income
- $21,754
- − Mortgage interest
- −$11,707
- − Property taxes
- −$2,338
- − Insurance
- −$1,045
- − Repairs & maintenance
- −$1,740
- − Management
- −$1,740
- − Depreciation
- −$6,080
- Taxable loss
- −$2,897
- Est. tax savings @ 24.0%
- +$695
- After-tax cash flow
- $1,345/yr
For passive investors: Depreciation is non-cash, so a rental often shows a tax loss while cash-flowing — sheltering income. Rental losses are passive: they offset passive income freely, and up to $25,000/yr can offset ordinary (W-2) income if you actively participate and your MAGI is under $100k (phasing out to $0 by $150k); unused losses carry forward. On sale, claimed depreciation is recaptured at up to 25%, and gains may owe capital-gains tax (a 1031 exchange can defer both). Figures are a year-1 estimate at your 24.0% rate — not tax advice; consult a CPA.
Schools (NCES district)
- District
- Duval
- NCES district ID
- 1200480
- Math proficiency
- 46% ▼ -11.00%
- Reading proficiency
- 45% ▼ -4.00%
- Median HH income
- $48,987
- Composite
- 38.97/100
- National rank
- #4076
- State rank
- #48 of 73 in FL
Livability — Jacksonville
- Score
- 83/100
- State rank
- #50
- US rank
- #911
Category grades
Schools grade is shown separately in the Schools card above.
Census & demographics
- Census place
- Jacksonville, FL
- County
- Duval County · 1,015,274 people
- City population
- 979,034
- Metro
- Jacksonville, FL
- Population (ZIP)
- 62,562
- Household income
- $80,963
- Rent vs Own
- Severe rent burden
- 2016.0
Population outlook (Duval County) Hauer SSP2
- Today (2025)
- 1,013,010 people
- By 2030
- 1,059,228 · +4.6%
- By 2040
- 1,141,439 · +12.7%
- By 2050
- 1,205,258 · +19.0%
- By 2075
- 1,324,282 · +30.7%
- By 2100
- 1,319,620 · +30.3%
Race, ethnicity, and origin ACS 2023
- Neighborhood character
- Diverse neighborhood (Simpson 0.67)
- Race & ethnicity
- White 51% Hispanic / Latino 18% Two or more races 15% Black 14% Asian 10%
- Hispanic origin (detail)
- Mexican 4% Puerto Rican 5% Cuban 2%
- Common ancestry
- Italian 2% Romanian 2% Slovak 2%
- Foreign-born
- 22% · Canada, Jamaica, Vietnam
- Languages at home
- 73% English-only · Spanish 12% Other Indo-European 3% Tagalog/Filipino 2%
Political lean MEDSL · Duval
- 2024 margin
- Toss-up / Even · D 48.7% · R 50.1% · Other 1.2%
- 2008→2024 swing
- +0.4pp no change · 2008: -1.9pp · 2024: -1.5pp
- All cycles
- 2024: R+1.5 2020: D+3.8 2016: R+1.5 2012: R+3.6 2008: R+1.9
Not yet ingested
- Civics
- —
Market trends
- HPI YoY
- ▼ -247.36%
- Current HPI
- 282.8438
- Rent YoY
- ▼ -2.35%
- Metro
- Jacksonville, FL
- State GDP YoY
- ▲ 3.28%
- F500 in state
- 36
Industry mix (Fortune 500 HQ in FL)
| Industry | F500 HQs | Revenue |
|---|---|---|
| Industrial Technology | 2 | $29B |
|
||
| Insurance | 2 | $17B |
|
||
| Retail | 1 | $60B |
|
||
| Technology Distribution | 1 | $58B |
|
||
| Homebuilding | 1 | $35B |
|
||
| Technology Manufacturing | 1 | $35B |
|
||
Price history
+457.3% since first listed5 events — show timeline
- 2026-04-18 Contingent — realMLS
- 2026-03-31 Price Changed $209,000 realMLS
- 2026-03-03 Price Changed $219,900 realMLS
- 2026-02-03 Listed $234,900 realMLS
- 1998-03-10 Sold (Public Records) $37,500 Public Records
Property tax history
+8.2%/yrLatest (2025): $2,338 · +14.6% YoY. Source: county tax records.
Cash-flow waterfall
monthlySold comps — $/sqft
last 12 mo · ≤1 miLoading sold comps…