 🌊 Lakefront
104 Mark Twain Ln · Rotonda, FL
Flood risk 8/10 · Major
- FEMA flood zone
- X (shaded)
- Chance of flooding over 30 yrs
- 0.97%
- Est. flood insurance / yr
- $507 – $1,088
Fire risk 2/10 · Minimal
- Est. fire insurance / yr
- $947 – $1,759
Heat risk 10/10 · Severe
- Hot days now (above 107°F)
- 7 days/yr
- Hot days in 30 yrs
- 29 days/yr
Wind risk 10/10 · Severe
- Chance of severe wind over 30 yrs
- 99.0%
Air-quality risk 2/10 · Minimal
- Unhealthy air days now
- 1 days/yr
- Unhealthy air days in 30 yrs
- 1 days/yr
Risk factors via First Street. Map © Google.
Why this score? — see what drove the C grade
The composite is a weighted blend of 9 inputs, each scored 0–100. Each bar is that input's sub-score; the figure is the points it added to the 100-point composite (weight × sub-score).
- Cash flow +15.0/30.0
- ARV discount +12.4/15.0
- Appreciation +5.6/10.0
- DSCR +4.6/10.0
- Schools +4.6/10.0
- 1% rule +4.5/10.0
- Livability +3.4/5.0
- Condition / age +2.5/5.0
- Rent growth +2.4/5.0
$299,000
🖨 Deal sheet 📄 Offer letter ✓ Due diligence
Listing remarks
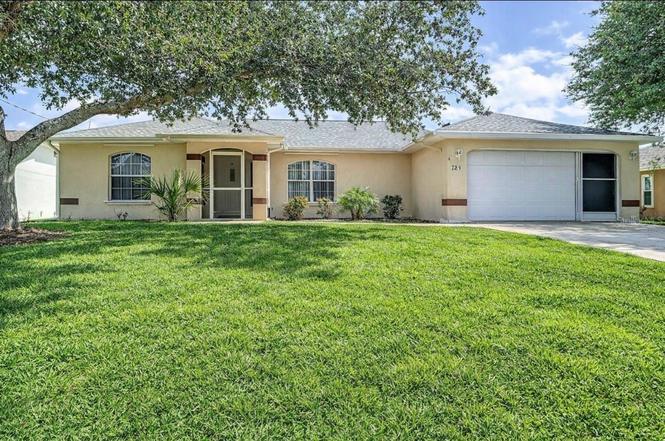
Charming Canal-Front Home with Space for a Pool and Recent Updates in Rotonda West Step into this refreshed 3-bedroom, 2-bath home in Rotonda West, a tranquil community known for its golf courses and waterways. With a split-bedroom layout and thoughtful updates, this home offers modern comfort and peace of mind. Highlights: Spacious Lot: Room to design your dream pool. New Roof (2023): Built to last. AC Unit (2021) & Water Heater (2023): Efficient and reliable. Re-piping (2018) & Garbage Disposal (2023): Upgraded systems for ease of living. The open kitchen with updated appliances and airy Great Room are perfect for entertaining, while the master suite provides a quiet retreat
Key facts
- Re-piping
- Canal-front home
- Water heater
Tags
Property features AI
Finance
- Other: Located near golf course; Lot is in a flood zone; Roads are paved and public maintained; Landscaped lot with trees (approx. 0.23 acre; lot dimensions approx. 80 x 125)
- Financial info: No lease restrictions reported
- HOA & community: HOA with annual fee ($190 per year; about $15.83/month); Association amenities include park and pickleball courts; Association: ROTONDA WEST HOA OFFICE; Deed restrictions; Pets allowed (cats and dogs)
Exterior
- Parking: Attached 2-car garage (approx. 20 x 22) with garage door opener; Driveway
- Security: Hurricane shutters
- Utilities: Public water; Public sewer; Electricity connected; Broadband/high-speed internet available; Cable available; Water connected; Sewer connected
- Home design: Single-family residence; One story; South-facing
- Construction: Block and stucco construction; Shingle roof; Slab foundation; Built on one level
- Exterior features: Patio (screened); Hurricane shutters; Exterior lighting; Rain gutters; Sliding doors; Irrigation equipment; Canal frontage (freshwater) with water access and water view
Interior
- Kitchen: Dishwasher; Disposal; Microwave; Range; Refrigerator; Eat-in kitchen
- Bedrooms: 3 bedrooms
- Flooring: Carpet; Tile
- Bathrooms: 2 full bathrooms
- Heating & cooling: Central heating (electric); Central air conditioning
- Interior features: Ceiling fans; Eat-in kitchen; Living room and dining room combo; Open floorplan; Split-bedroom layout; Thermostat; Vaulted ceilings; Walk-in closets; Great room; Inside utility room
- Laundry & utility: Inside laundry room; Washer; Dryer; Electric water heater
Neighborhood map
What this means for you Summary
Snapshot
- This is a 3-bed/2.0-bath single-family listed at $299k.
Deal economics
- At list price, monthly cash flow is $29 ($343/yr) — positive.
- The deal already cash-flows at list — no discount required.
- To meet the 1% rule (rent ≥ 1% of price), the offer needs to be $284k (5.0% below list).
- Recommended offer: $263k (12.0% below list) — sets the bar for market timing.
- Cap rate 6.7% vs local median 3.1% in Rotonda — top-decile yield for the area; either an underpriced asset or a hidden risk that comps aren't pricing in. Stress-test before assuming the spread holds.
Location & tenants
- Location reads 67/100 on livability (#548 in FL) — a middle-class / working-renter tenant base. Strengths: crime A+, housing A-, cost of living B+; Watch: amenities F, commute F, health & safety D-.
- Charlotte (suburban): math 54% / reading 54% proficiency, ranked #22 of 73 in FL (top 30%) — acceptable for families but not a draw, mixed tenant base, ~2y average lease.
- Zoned schools: Vineland Elementary School (math 74% / reading 67%, grade A-, #333 of 2,144 statewide, top 16%, 579 students, 45% FRL); Lemon Bay High School (math 50% / reading 56%, grade C-, #148 of 667 statewide, top 23%, 1,360 students, 28% FRL) — zoned schools average 37% FRL vs 54% district-wide (17 pts lower); this property's tenant base skews higher-income than the district average.
- Market conditions: Rents soft (-0.2%/yr); 863 active listings in the ZIP; 33 comparable units currently listed for rent nearby; rentals at typical pace (median 21d on market — plan ~3-4 weeks tenant-placement turnaround); solid renter incomes; 4,585 units permitted in Charlotte County in 2024 (703 in 5+ unit buildings).
Forward outlook
- In year one you build about $6k of equity ($2k loan paydown + $4k appreciation (1.2% local appreciation)).
- Charlotte County population projected at +24% by 2050 — long-run rental-demand tailwind backs the buy-and-hold thesis.
- By year 6, paydown + projected appreciation supports a ~$32k cash-out refi (75% LTV) — recoverable capital for the next deal without selling this one.
Negotiation context
- It's been on market 359 days — a 12% lower offer ($263k) is reasonable based on typical stale-listing flexibility.
- 4 sale attempts since 3y ago; this cycle's ask has dropped $50k (14%) from the opening price — seller is motivated, your offer sets the floor, not the list.
- Current owner paid $168k; list at $299k implies a 78% gain — meaningful room to come down on a strong offer.
Risks & watch-outs
- Watch-outs: flood insurance adds $66/mo.
- Climate carrying-cost: severe flood risk; severe wind risk, 99% chance of damaging wind over 30y; extreme-heat days projected 7→29/yr by 2055 (HVAC capex compounding) — expect insurance premiums to compound above CPI over the hold.
Questions for the listing agent
- It's been on market 359 days. Have you received any prior offers? Is the seller open to a 12% concession, seller financing, or rate buy-down credit?
- What's the actual annual flood-insurance premium (NFIP or private), and is the property in a SFHA with mandatory coverage?
- What does the HOA fee cover, when was the last increase, and are there any pending special assessments or reserve-fund shortfalls?
- Why hasn't it sold? Are there any deal-killer items the seller is aware of (foundation, flood, title, zoning, code violations)?
- Is there a deadline driving the sale (1031 exchange, divorce, estate, relocation)? That informs how much negotiation room exists.
- Schools are D-rated, which usually means shorter tenancies and higher turnover. Who's the typical renter profile here, and what's been the actual vacancy rate?
- This sits on a lake — are riparian / water-frontage rights deeded with the parcel? Any dock permits, shoreline easements, or HOA water-use restrictions?
- What's the documented flood / surge / shoreline-erosion history here (FEMA AND non-FEMA — e.g., storm surge, creek backup, septic-field saturation)?
- Any water-quality or seasonal algae-bloom issues that affect tenant satisfaction or short-term-rental demand?
- What's the average days-on-market for RENTAL listings here right now (not sales)? A rising rental-DOM trend means longer vacancies and softer asking-rent achievability than the comps imply.
- What's the recent tenant-quality profile in this submarket — average credit score on applications, eviction rate, late-payment / NSF rate, and stable-employment percentage? A property-management company in the area should have these aggregated.
- How much new for-sale + rental construction is in the pipeline within 1–3 miles? Heavy new supply typically softens prices + rents 12–24 months out; constrained supply supports both.
Investment metrics
- 1% rule
- 0.95% ✗
- Cap rate
- 6.67%
- Cash-on-cash
- 1.36%
- DSCR
- 1.06
- GRM
- 8.8
CMA / ARV
- ARV (on-the-fly)
- $335,730
- Comps found
- 12
Show comp detail 12 sales within ~0.75 mi
| Address | Dist | Beds/Ba | Sqft | Sold | Price | $/sf | Match |
|---|---|---|---|---|---|---|---|
| 239 Annapolis Ln | 0.39mi | 3/2.0 | 1,747 (-3%) | 3mo | $130,000 | $74 | 74 |
| 46 Bunker Ct | 0.56mi | 3/2.0 | 1,818 (+1%) | 2mo | $339,000 | $186 | 71 |
| 158 Mark Twain Ln | 0.32mi | 3/2.0 | 1,670 (-8%) | 5mo | $359,000 | $215 | 69 |
| 14 Bunker Ct | 0.65mi | 3/2.0 | 1,854 (+3%) | 3mo | $345,000 | $186 | 63 |
| 62 Mariner Ln | 0.62mi | 3/2.0 | 1,815 (+1%) | 12mo | $289,800 | $160 | 60 |
| 104 Caddy Rd | 0.49mi | 3/2.0 | 1,839 (+2%) | 18mo | $175,000 | $95 | 59 |
| 13 Bunker Pl | 0.40mi | 3/2.0 | 1,568 (-13%) | 4mo | $359,900 | $230 | 56 |
| 209 Mark Twain Ln | 0.46mi | 3/2.0 | 1,588 (-12%) | 4mo | $306,100 | $193 | 55 |
| 254 Mark Twain Ln | 0.69mi | 4/2.0 (+1) | 1,874 (+4%) | 2mo | $399,900 | $213 | 55 |
| 137 Mariner Ln | 0.47mi | 3/2.0 | 2,027 (+12%) | 4mo | $365,900 | $181 | 54 |
| 21 S Golfview Rd | 0.63mi | 3/2.0 | 1,985 (+10%) | 3mo | $339,900 | $171 | 51 |
| 30 Bunker Ln | 0.72mi | 3/2.0 | 1,972 (+9%) | 8mo | $409,000 | $207 | 44 |
Match score weights: distance 35% · size 25% · config 20% · recency 20%. Top-matched comps best support the ARV.
Projected returns pro-forma
1.25% appreciation · 0.0% rent growth · sell at horizon
- IRR
- 0.7%
- Equity multiple
- 1.03×
- Total profit
- $2,894
- Equity at exit
- $105,983
- IRR
- 3.4%
- Equity multiple
- 1.41×
- Total profit
- $33,957
- Equity at exit
- $143,915
Cash invested: $83,720 (down + closing). Projections, not guarantees.
Landlord ↔ Tenant lean methodology
- Overall (STATE)
- 87 Strongly Landlord-Friendly
- State Florida
- 87 Strongly Landlord-Friendly · R+3
- County
- — inherits STATE
- City
- — inherits STATE
ZIP-level market 33947
- Home prices YoY
- 0.4%
- Rents YoY
- -0.2%
- Active inventory
- 863
- Price-to-rent
- 8.8×
Monthly cashflow live
- Estimated rent
- $2,841 high interval (Pro) →
- Mortgage (P&I)
- −$1,568
- Tax from tax record
- −$441 /mo · $5,298/yr
- Insurance
- −$125
- Flood insurance flood zone
- −$66 /mo · $798/yr
- HOA
- −$15
- Vacancy / Maint / Mgmt
- −$597
- Net cashflow
- $29
Break-even live
UW: 25.0% down · 7.5% · 30yr · 1.5% tax · 5.0% vac · 8.0% maint · 8.0% mgmt
Financing live
Cash to close
- Down payment
- $74,750
- Closing costs
- $8,970
- Reserves months
- —
- Total cash needed
- —
Loan-product check · same deal, 3 products live
Conventional
25% down · 7.5% · 30yr
- Down + closing
- —
- Monthly P&I
- —
- Monthly cashflow
- —
- DSCR
- —
- Eligible?
- —
Personal DTI + credit; lowest rate.
DSCR
20% down · 8.5% · 30yr
- Down + closing
- —
- Monthly P&I
- —
- Monthly cashflow
- —
- DSCR
- —
- Eligible?
- —
No personal income docs; deal must DSCR.
Hard money
10% down · 12.0% · 12mo
- Down + closing
- —
- Monthly P&I
- —
- Monthly cashflow
- —
- DSCR
- —
- Eligible?
- —
Short-term bridge; refi at stabilization.
Rent comps 33 comps
| Address | Beds | Baths | Sqft | Rent | $/sqft | DOM | Units | Dist |
|---|---|---|---|---|---|---|---|---|
| 87 Mark Twain Ln Rotonda West, FL | 3.0 | 2.0 | 1235 | $2,500 | $2.02 | 21d | 1 | 0.13mi |
| 230 Annapolis Ln Rotonda West, FL | 3.0 | 2.0 | 1768 | $1,800 | $1.02 | 21d | 1 | 0.35mi |
| 181 Bunker Rd Rotonda West, FL | 2.0 | 2.0 | 1355 | $4,600 | $3.39 | 21d | 1 | 0.39mi |
| 239 Annapolis Ln Rotonda West, FL | 3.0 | 2.0 | 1747 | $2,000 | $1.14 | 21d | 1 | 0.39mi |
| 118 Caddy Rd Rotonda West, FL | 3.0 | 2.0 | 1828 | $2,795 | $1.53 | 21d | 1 | 0.43mi |
| 36 Bunker Cir Rotonda West, FL | 2.0 | 2.0 | 1533 | $3,999 | $2.61 | 21d | 1 | 0.45mi |
| 65 Oakland Hills Pl Rotonda West, FL | 2.0 | 2.0 | 1444 | $4,500 | $3.12 | 21d | 1 | 0.45mi |
| 42 Mark Twain Ln Rotonda West, FL | 3.0 | 2.5 | 1677 | $2,800 | $1.67 | 21d | 1 | 0.48mi |
| 80 Mariner Ln Rotonda West, FL | 3.0 | 2.0 | 2052 | $4,800 | $2.34 | 21d | 1 | 0.55mi |
| 37 Oakland Hills Pl Rotonda West, FL | 3.0 | 2.0 | 1321 | $4,000 | $3.03 | 21d | 1 | 0.60mi |
| 60 Golfview Rd Rotonda West, FL | 3.0 | 2.0 | 1336 | $5,550 | $4.15 | 21d | 1 | 0.63mi |
| 65 Fairway Rd Rotonda West, FL | 3.0 | 2.0 | 1865 | $2,700 | $1.45 | 21d | 1 | 0.64mi |
| 64 Golfview Rd Rotonda West, FL | 4.0 | 2.0 | 1697 | $1,795 | $1.06 | 13d | 1 | 0.65mi |
| 45 Oakland Hills Ct Rotonda West, FL | 4.0 | 2.0 | 1536 | $2,700 | $1.76 | 21d | 1 | 0.75mi |
| 18 Golfview Ct Rotonda West, FL | 3.0 | 2.0 | 1686 | $3,000 | $1.78 | 21d | 1 | 0.79mi |
| 173 Rotonda Cir Rotonda West, FL | 3.0 | 2.0 | 1350 | $3,200 | $2.37 | 21d | 1 | 0.85mi |
| 25 Fairway Rd Rotonda West, FL | 3.0 | 2.0 | 2068 | $2,375 | $1.15 | 21d | 1 | 0.87mi |
| 22 Mariner Ln Rotonda West, FL | 3.0 | 2.0 | 2015 | $4,200 | $2.08 | 21d | 1 | 0.87mi |
| 188 Boundary Blvd Unit B Rotonda West, FL | 2.0 | 2.0 | 2086 | $2,000 | $0.96 | 21d | 1 | 0.89mi |
| 285 Mark Twain Ln Rotonda West, FL | 3.0 | 2.0 | 1759 | $1,750 | $0.99 | 21d | 1 | 0.92mi |
| 130 Boundary Blvd Unit B Rotonda West, FL | 2.0 | 2.0 | 2060 | $2,000 | $0.97 | 21d | 1 | 0.99mi |
| 12 Broadmoor Rd Unit 1 Rotonda West, FL | 3.0 | 2.0 | 2065 | $3,500 | $1.69 | 21d | 1 | 1.01mi |
| 155 Long Meadow Ln Rotonda West, FL | 3.0 | 2.0 | 1598 | $4,500 | $2.82 | 21d | 1 | 1.05mi |
| 100 Rotonda Lakes Cir Rotonda West, FL | 1.0–3.0 | 1.0–2.0 | 1024 | $1,232 | $1.20 | 13d | 1 | 1.06mi |
| 113 Boundary Blvd Unit B 1 Rotonda West, FL | 3.0 | 2.0 | 1325 | $1,695 | $1.28 | 21d | 1 | 1.07mi |
| 113 Boundary Blvd #2 Rotonda West, FL | 3.0 | 2.0 | 1323 | $1,625 | $1.23 | 13d | 1 | 1.07mi |
| 123 Marker Rd Rotonda West, FL | 3.0 | 2.0 | 2006 | $2,400 | $1.20 | 13d | 1 | 1.10mi |
| 93 Boundary Blvd #303 Rotonda West, FL | 2.0 | 2.0 | 1228 | $2,800 | $2.28 | 13d | 1 | 1.12mi |
| 127 White Marsh Ln Rotonda West, FL | 3.0 | 2.0 | 2216 | $2,700 | $1.22 | 21d | 1 | 1.15mi |
| 30 Pinehurst Pl Rotonda West, FL | 3.0 | 3.0 | 2461 | $3,900 | $1.58 | 21d | 1 | 1.16mi |
| 511 Sweetwater Dr Rotonda West, FL | 4.0 | 2.5 | 2160 | $2,200 | $1.02 | 21d | 1 | 1.26mi |
| 72 Long Meadow Ln Rotonda West, FL | 3.0 | 2.0 | 1945 | $1,920 | $0.99 | 13d | 1 | 1.42mi |
| 72 Long Meadow Ct Rotonda West, FL | 3.0 | 2.0 | 1570 | $5,200 | $3.31 | 21d | 1 | 1.48mi |
HOA detail
- Monthly dues
- $15 · $180/yr
- Likely covers
- watertrashpool
Listing history 23 events
-
2026-06-18days on market $299,000 Active 359 DOM
-
2026-06-17days on market $299,000 Active 358 DOM
-
2026-06-16days on market $299,000 Active 357 DOM
-
2026-06-15days on market $299,000 Active 356 DOM
-
2026-06-14days on market $299,000 Active 354 DOM
-
2026-06-13days on market $299,000 Active 353 DOM
-
2026-06-10days on market $299,000 Active 351 DOM
-
2026-06-09days on market $299,000 Active 350 DOM
-
2026-06-08days on market $299,000 Active 349 DOM
-
2026-06-05days on market $299,000 Active 345 DOM
-
2026-06-02days on market $299,000 Active 343 DOM
-
2026-06-01days on market $299,000 Active 342 DOM
-
2026-05-31days on market $299,000 Active 341 DOM
-
2026-05-30days on market $299,000 Active 340 DOM
-
2026-04-11price $299,000
-
2025-06-24$349,500 Active
-
2025-04-14historical
-
2024-08-15$399,000 Active
-
2024-07-30historical
-
2024-01-21$399,000 Active
-
2024-01-02historical
-
2023-10-02$399,000 Active
-
2004-05-13soldstatus $168,000
ⓘ Source: listings_history table (triggers on properties + properties_extension) + one-shot
backfill from property_details.listing_events for pre-trigger history.
Tax reassessment forecast FL · Resets to sale price
- Current annual tax
- $5,298 · $441/mo
- Projected year-2 tax
- $5,298 · $441/mo
- Expected delta
- $0/yr ($0/mo · 0.0%)
ⓘ Screening estimate from a state-policy table — verify with the county assessor before closing.
Climate risk First Street
- Flood 8/10 Severe FEMA zone X (shaded) · 97% chance over 30 yrs
- Wildfire 2/10 Low
- Heat 10/10 Extreme 7 d/yr ≥107°F today · 29 d/yr by 30 yrs out
- Wind 10/10 Extreme 99% chance of damaging wind over 30 yrs
- Air quality 2/10 Low 1 unhealthy d/yr today · 1 by 30 yrs out
Nearby sold comps map
Loading sold comps map…
Walkable amenities ~0.75 mi
Loading nearby amenities…
Taxation est. · year 1
- Rental income
- $34,087
- − Mortgage interest
- −$16,749
- − Property taxes
- −$5,298
- − Insurance
- −$2,292
- − Repairs & maintenance
- −$2,727
- − Management
- −$2,727
- − HOA
- −$180
- − Depreciation
- −$8,698
- Taxable loss
- −$4,584
- Est. tax savings @ 24.0%
- +$1,100
- After-tax cash flow
- $1,443/yr
For passive investors: Depreciation is non-cash, so a rental often shows a tax loss while cash-flowing — sheltering income. Rental losses are passive: they offset passive income freely, and up to $25,000/yr can offset ordinary (W-2) income if you actively participate and your MAGI is under $100k (phasing out to $0 by $150k); unused losses carry forward. On sale, claimed depreciation is recaptured at up to 25%, and gains may owe capital-gains tax (a 1031 exchange can defer both). Figures are a year-1 estimate at your 24.0% rate — not tax advice; consult a CPA.
Schools (NCES district)
- District
- Charlotte
- NCES district ID
- 1200240
- Math proficiency
- 54% ▼ -6.00%
- Reading proficiency
- 54% ▼ -1.00%
- Median HH income
- $44,864
- Composite
- 45.62/100
- National rank
- #2586
- State rank
- #22 of 73 in FL
Livability — Rotonda
- Score
- 67/100
- State rank
- #548
- US rank
- #10359
Category grades
Schools grade is shown separately in the Schools card above.
Census & demographics
- Census place
- Rotonda, FL
- County
- Charlotte County · 196,994 people
- City population
- 10,490
- Metro
- Punta Gorda, FL
- Population (ZIP)
- 10,447
- Household income
- $80,091
- Rent vs Own
- Severe rent burden
- 91.0
Population outlook (Charlotte County) Hauer SSP2
- Today (2025)
- 198,646 people
- By 2030
- 210,507 · +6.0%
- By 2040
- 230,857 · +16.2%
- By 2050
- 247,148 · +24.4%
- By 2075
- 281,777 · +41.8%
- By 2100
- 293,609 · +47.8%
Race, ethnicity, and origin ACS 2023
- Neighborhood character
- Predominantly White (96%)
- Race & ethnicity
- White 96% Hispanic / Latino 2% Two or more races 2%
- Common ancestry
- Romanian 5% Lithuanian 4% Slovak 4%
- Foreign-born
- 8% · Canada, Vietnam
- Languages at home
- 93% English-only · Russian/Polish/Slavic 3% Spanish 2% German/W. Germanic 1%
Political lean MEDSL · Charlotte
- 2024 margin
- Solid R (+34.0) · D 32.7% · R 66.7%
- 2008→2024 swing
- -26.7pp toward R · 2008: -7.2pp · 2024: -34.0pp
- All cycles
- 2024: R+34.0 2020: R+26.6 2016: R+27.8 2012: R+14.3 2008: R+7.2
Not yet ingested
- Civics
- —
Market trends
- HPI YoY
- ▲ 1.25%
- Current HPI
- 311.3231
- Rent YoY
- ▼ -0.22%
- Metro
- Punta Gorda, FL
- State GDP YoY
- ▲ 3.28%
- F500 in state
- 36
Industry mix (Fortune 500 HQ in FL)
| Industry | F500 HQs | Revenue |
|---|---|---|
| Industrial Technology | 2 | $29B |
|
||
| Insurance | 2 | $17B |
|
||
| Retail | 1 | $60B |
|
||
| Technology Distribution | 1 | $58B |
|
||
| Homebuilding | 1 | $35B |
|
||
| Technology Manufacturing | 1 | $35B |
|
||
Price history
+78.0% since first listed9 events — show timeline
- 2026-04-11 Price Changed $299,000 Stellar MLS as Distributed by MLS Grid
- 2025-06-24 Listed $349,500 Stellar MLS as Distributed by MLS Grid
- 2025-04-14 Listing Removed — Stellar MLS as Distributed by MLS Grid
- 2024-08-15 Listed $399,000 Stellar MLS as Distributed by MLS Grid
- 2024-07-30 Listing Removed — Stellar MLS as Distributed by MLS Grid
- 2024-01-21 Listed $399,000 Stellar MLS as Distributed by MLS Grid
- 2024-01-02 Listing Removed — Stellar MLS as Distributed by MLS Grid
- 2023-10-02 Listed $399,000 Stellar MLS as Distributed by MLS Grid
- 2004-05-13 Sold (Public Records) $168,000 Public Records
Property tax history
+5.7%/yrLatest (2025): $5,298 · +1.2% YoY. Source: county tax records.
Cash-flow waterfall
monthlySold comps — $/sqft
last 12 mo · ≤1 miLoading sold comps…