0 5 East Ballard Ave · Thompson Springs, UT
Flood risk No data
- FEMA flood zone
- —
- Chance of flooding over 30 yrs
- —
- Est. flood insurance / yr
- —
Fire risk No data
- Est. fire insurance / yr
- —
Heat risk No data
- Hot days now (above threshold)
- —
- Hot days in 30 yrs
- —
Wind risk No data
- Chance of severe wind over 30 yrs
- —
Air-quality risk No data
- Unhealthy air days now
- —
- Unhealthy air days in 30 yrs
- —
Risk factors via First Street. Map © Google.
Why this score? — see what drove the C grade
The composite is a weighted blend of 9 inputs, each scored 0–100. Each bar is that input's sub-score; the figure is the points it added to the 100-point composite (weight × sub-score).
- Cash flow +23.0/30.0
- ARV discount +7.5/15.0
- DSCR +7.4/10.0
- 1% rule +6.0/10.0
- Appreciation +5.0/10.0
- Condition / age +3.8/5.0
- Rent growth +2.5/5.0
- Schools +2.5/10.0
- Livability +1.9/5.0
$80,000
🖨 Deal sheet 📄 Offer letter ✓ Due diligence
Listing remarks
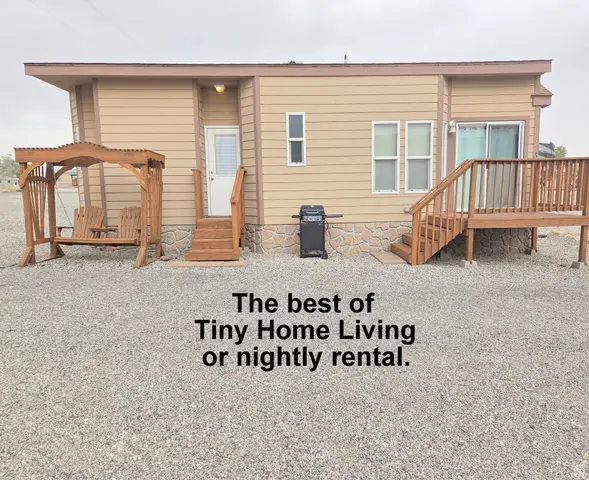
This cute little affordable tiny home is move in ready and also zoned for nightly rentals. It has everything you would need to occupy it or keep it as a nightly rental. Land is not included. Lot fee is about $400.00 per month plus utilities. This is a perfect size and place for one or two people, and or weekend warriors. It's hard to find a nightly rentals for sale in the Moab or the Grand County area, so this is a bargain.
Key facts
- Built 2015
- Listed 35 days
Tags
Property features AI
Finance
- Other: Small lot (0.01 acres); Above-grade finished area listed
- HOA & community: Located in Ballard RV park, Thompson Springs subdivision; Zoned single-family with short term rental allowed (BC11)
Exterior
- Parking: Uncovered open parking
- Utilities: Natural gas connected; Electricity connected; Sewer connected; Culinary water connected
- Home design: Mobile home, single level living; Faces west; Residential use
- Construction: Clapboard/Masonite exterior; Metal pitched roof; Built and standing
- Exterior features: Open porch; Double-pane windows; Exterior lighting; Swing set; Xeriscaped yard; Unpaved road access; Mountain and red rock views
Interior
- Kitchen: Gas oven and range; Microwave; Range hood; Refrigerator
- Bedrooms: One main level bedroom (primary on 1st floor)
- Flooring: Carpet; Vinyl
- Bathrooms: One three-quarter bathroom
- Heating & cooling: Central heating (gas); Gas stove heating; Propane heating; Central air conditioning
- Interior features: Gas oven and gas range; Free-standing range/oven; Ceiling fan; Gas grill/BBQ; Microwave; Range hood; Refrigerator; Satellite dish; Blinds and drapes; Full window treatments
- Laundry & utility: No basement
Neighborhood map
What this means for you Summary
Snapshot
- This is a 1-bed/1.0-bath manufactured listed at $80k. Condition is rated good.
Deal economics
- At list price, monthly cash flow is $141 ($2k/yr) — positive.
- The deal already cash-flows at list — no discount required.
- Meets the 1% rule at list price ($879 rent vs $80k).
- Recommended offer: $78k (3.0% below list) — sets the bar for market timing.
Location & tenants
- Location reads 38/100 on livability (#319 in UT) — a limited-amenity area; tenant pool skews transient or value-seeking. Strengths: crime A, cost of living A-; Watch: amenities F, commute F, employment F.
- Grand District (town): math 27% / reading 31% proficiency, ranked #71 of 80 in UT (top 89%) — low school quality limits family demand, transient renter base, plan for 1-2y turnover.
- Zoned schools: Helen M. Knight School (math 30% / reading 28%, grade F, #444 of 585 statewide, top 77%, 732 students, 49% FRL); Grand County High (math 22% / reading 47%, grade F, #95 of 171 statewide, top 61%, 461 students, 36% FRL) — zoned schools at 42% FRL track the district average.
- Market conditions: 15 active listings in the ZIP; 238 units permitted in Grand County in 2024 (100 in 5+ unit buildings).
Forward outlook
- In year one you build about $3k of equity ($553 loan paydown + $2k appreciation (3.0% local appreciation)).
- Grand County population projected at +10% by 2050 — modest demand growth; plan on rents tracking national, not racing it.
- At projected returns (3.0% appreciation + 3.0% rent growth), your $22k cash investment doubles in ~5 years — after that, you're playing with house money.
Negotiation context
- It's been on market 36 days — a 3% lower offer ($78k) is reasonable based on typical stale-listing flexibility.
Questions for the listing agent
- It's been on market 36 days. Have you received any prior offers? Is the seller open to a 3% concession, seller financing, or rate buy-down credit?
- Is there a deadline driving the sale (1031 exchange, divorce, estate, relocation)? That informs how much negotiation room exists.
- What's the average days-on-market for RENTAL listings here right now (not sales)? A rising rental-DOM trend means longer vacancies and softer asking-rent achievability than the comps imply.
- What's the recent tenant-quality profile in this submarket — average credit score on applications, eviction rate, late-payment / NSF rate, and stable-employment percentage? A property-management company in the area should have these aggregated.
- How much new for-sale + rental construction is in the pipeline within 1–3 miles? Heavy new supply typically softens prices + rents 12–24 months out; constrained supply supports both.
Investment metrics
- 1% rule
- 1.10% ✓
- Cap rate
- 8.42%
- Cash-on-cash
- 7.58%
- DSCR
- 1.34
- GRM
- 7.6
CMA / ARV
No comps found within radius.
Projected returns pro-forma
3.0% appreciation · 3.0% rent growth · sell at horizon
- IRR
- 14.6%
- Equity multiple
- 1.83×
- Total profit
- $18,662
- Equity at exit
- $35,971
- IRR
- 16.4%
- Equity multiple
- 3.40×
- Total profit
- $53,837
- Equity at exit
- $55,436
Cash invested: $22,400 (down + closing). Projections, not guarantees.
Landlord ↔ Tenant lean methodology
- Overall (STATE)
- 86 Strongly Landlord-Friendly
- State Utah
- 86 Strongly Landlord-Friendly · R+15
- County
- — inherits STATE
- City
- — inherits STATE
ZIP-level market 84540
- Active inventory
- 15
- Price-to-rent
- 7.6×
Monthly cashflow live
- Estimated rent
- $879 medium interval (Pro) →
- Mortgage (P&I)
- −$420
- Tax est. 1.5%
- −$100 /mo · $1,200/yr
- Insurance
- −$33
- HOA
- −$0
- Vacancy / Maint / Mgmt
- −$185
- Net cashflow
- $141
Break-even live
UW: 25.0% down · 7.5% · 30yr · 1.5% tax · 5.0% vac · 8.0% maint · 8.0% mgmt
Financing live
Cash to close
- Down payment
- $20,000
- Closing costs
- $2,400
- Reserves months
- —
- Total cash needed
- —
Loan-product check · same deal, 3 products live
Conventional
25% down · 7.5% · 30yr
- Down + closing
- —
- Monthly P&I
- —
- Monthly cashflow
- —
- DSCR
- —
- Eligible?
- —
Personal DTI + credit; lowest rate.
DSCR
20% down · 8.5% · 30yr
- Down + closing
- —
- Monthly P&I
- —
- Monthly cashflow
- —
- DSCR
- —
- Eligible?
- —
No personal income docs; deal must DSCR.
Hard money
10% down · 12.0% · 12mo
- Down + closing
- —
- Monthly P&I
- —
- Monthly cashflow
- —
- DSCR
- —
- Eligible?
- —
Short-term bridge; refi at stabilization.
Listing history 18 events
-
2026-06-19days on market $80,000 Active 36 DOM
-
2026-06-18days on market $80,000 Active 35 DOM
-
2026-06-17days on market $80,000 Active 34 DOM
-
2026-06-16days on market $80,000 Active 33 DOM
-
2026-06-15days on market $80,000 Active 32 DOM
-
2026-06-14days on market $80,000 Active 30 DOM
-
2026-06-13days on market $80,000 Active 29 DOM
-
2026-06-10days on market $80,000 Active 27 DOM
-
2026-06-09days on market $80,000 Active 26 DOM
-
2026-06-08days on market $80,000 Active 25 DOM
-
2026-06-07days on market $80,000 Active 24 DOM
-
2026-06-05days on market $80,000 Active 21 DOM
-
2026-06-03days on market $80,000 Active 20 DOM
-
2026-06-02days on market $80,000 Active 19 DOM
-
2026-06-01days on market $80,000 Active 18 DOM
-
2026-05-31days on market $80,000 Active 17 DOM
-
2026-05-30days on market $80,000 Active 16 DOM
-
2026-05-14$80,000 Active
ⓘ Source: listings_history table (triggers on properties + properties_extension) + one-shot
backfill from property_details.listing_events for pre-trigger history.
Nearby sold comps map
Loading sold comps map…
Walkable amenities ~0.75 mi
Loading nearby amenities…
Taxation est. · year 1
- Rental income
- $10,547
- − Mortgage interest
- −$4,481
- − Property taxes
- −$1,200
- − Insurance
- −$400
- − Repairs & maintenance
- −$844
- − Management
- −$844
- − Depreciation
- −$2,327
- Taxable income
- $451
- Est. tax owed @ 24.0%
- −$108
- After-tax cash flow
- $1,590/yr
For passive investors: Depreciation is non-cash, so a rental often shows a tax loss while cash-flowing — sheltering income. Rental losses are passive: they offset passive income freely, and up to $25,000/yr can offset ordinary (W-2) income if you actively participate and your MAGI is under $100k (phasing out to $0 by $150k); unused losses carry forward. On sale, claimed depreciation is recaptured at up to 25%, and gains may owe capital-gains tax (a 1031 exchange can defer both). Figures are a year-1 estimate at your 24.0% rate — not tax advice; consult a CPA.
Condition & rehab AI · 13 photos
This move-in ready manufactured home is in good condition with minimal repairs needed. It offers a good balance of curb appeal and interior functionality, making it an attractive option for both buyers and renters.
Value-add opportunities
- Both Painting the exterior and interior walls — Fresh paint can enhance curb appeal and interior aesthetics.
- Both Landscaping improvements — Enhanced landscaping can improve curb appeal and attract potential buyers/renters.
- Both Upgrading the HVAC system — A more efficient HVAC system can improve comfort and energy efficiency, attracting more tenants and buyers.
- Both Adding a small garden or patio area — A small garden or patio can enhance the living space and attract more potential buyers/renters.
- Both Upgrading the kitchen appliances — Upgrading to more modern and energy-efficient appliances can improve the home's appeal and attract more potential buyers/renters.
Renovation cost estimate screening
Value-add ROI direction
- Both Painting the exterior and interior walls — Fresh paint can enhance curb appeal and interior aesthetics. ↑
- Both Landscaping improvements — Enhanced landscaping can improve curb appeal and attract potential buyers/renters. ↑
- Both Upgrading the HVAC system — A more efficient HVAC system can improve comfort and energy efficiency, attracting more tenants and buyers. ↑
- Both Adding a small garden or patio area — A small garden or patio can enhance the living space and attract more potential buyers/renters. ↑
- Both Upgrading the kitchen appliances — Upgrading to more modern and energy-efficient appliances can improve the home's appeal and attract more potential buyers/renters. ↑
ⓘ Cost ranges are severity-bucket heuristics (US national rule-of-thumb). Get contractor quotes + a written scope before underwriting a rehab budget.
Schools (NCES district)
- District
- Grand District
- NCES district ID
- 4900330
- Math proficiency
- 27% ▼ -7.00%
- Reading proficiency
- 31% ▼ -8.00%
- Median HH income
- $43,188
- Composite
- 24.71/100
- National rank
- #7611
- State rank
- #71 of 80 in UT
Livability — Thompson Springs
- Score
- 38/100
- State rank
- #319
- US rank
- #27531
Category grades
Schools grade is shown separately in the Schools card above.
Census & demographics
- Census place
- Thompson Springs, UT
Population outlook (Grand County) Hauer SSP2
- Today (2025)
- 10,228 people
- By 2030
- 10,507 · +2.7%
- By 2040
- 10,897 · +6.5%
- By 2050
- 11,243 · +9.9%
- By 2075
- 12,309 · +20.3%
- By 2100
- 13,202 · +29.1%
Not yet ingested
- Political lean
- —
- Race & ethnicity
- —
- Common origin
- —
- Civics
- —
Market trends
- HPI YoY
- —
- Current HPI
- —
- Rent YoY
- —
- Metro
- —
- State GDP YoY
- ▲ 3.54%
- F500 in state
- 2
Industry mix (Fortune 500 HQ in UT)
| Industry | F500 HQs | Revenue |
|---|---|---|
| Financial Services | 1 | $3B |
|
||
Price history
1 event — show timeline
- 2026-05-14 Listed $80,000 WFRMLS
Cash-flow waterfall
monthlySold comps — $/sqft
last 12 mo · ≤1 miLoading sold comps…