1900 N Bayshore Dr #4007 · Miami, FL
Flood risk 10/10 · Severe
- FEMA flood zone
- VE
- Chance of flooding over 30 yrs
- 0.99%
- Est. flood insurance / yr
- $5,013 – $11,043
Fire risk 1/10 · Minimal
- Est. fire insurance / yr
- $947 – $1,759
Heat risk 10/10 · Severe
- Hot days now (above 103°F)
- 6 days/yr
- Hot days in 30 yrs
- 23 days/yr
Wind risk 10/10 · Severe
- Chance of severe wind over 30 yrs
- 99.0%
Air-quality risk 2/10 · Minimal
- Unhealthy air days now
- 1 days/yr
- Unhealthy air days in 30 yrs
- 1 days/yr
Risk factors via First Street. Map © Google.
Why this score? — see what drove the D- grade
The composite is a weighted blend of 9 inputs, each scored 0–100. Each bar is that input's sub-score; the figure is the points it added to the 100-point composite (weight × sub-score).
- Cash flow +7.6/30.0
- ARV discount +7.5/15.0
- 1% rule +5.0/10.0
- Schools +4.2/10.0
- Livability +3.9/5.0
- Appreciation +3.7/10.0
- Rent growth +2.7/5.0
- Condition / age +2.5/5.0
- DSCR +1.7/10.0
$399,900
🖨 Deal sheet (PDF) 📄 Offer letter ✓ Due diligence
Listing remarks
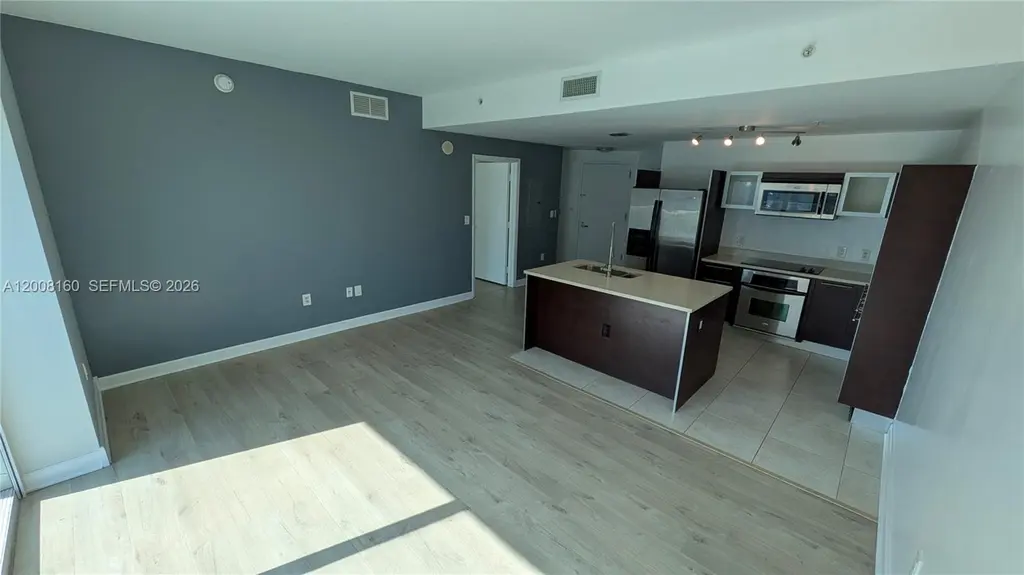
Experience Bay and Skyline views from this exquisite 1-bed, 1.5-bath condo in the prestigious Quantum on the Bay. Perched high above the city and aligned with the neighboring tower, this residence enjoys exceptional natural light throughout the day, with sunlight pouring in at the same height as the adjacent building. Enjoy partial bay and city views from your private balcony and expansive floor-to-ceiling windows that enhance the bright, airy feel. This stylish unit boasts modern upgrades, including elegant wood floors and a sleek, open-concept kitchen. Located in the vibrant heart of Edgewater Miami, just steps from Pace Park and Biscayne Bay, this property offers resort-style living with
Key facts
- Skyline views
- Modern upgrades
- Wood floors
Tags
Property features AI
Finance
- Other: Association pool (heated)
- Financial info: Pets allowed with restrictions or possible restrictions
- HOA & community: Monthly association fee; Association fee covers common areas, hot water, internet, pool(s), sewer, security, trash and water; Community amenities include billiard room, bike storage, business center, clubhouse, elevators, fitness center, barbecue/picnic area, pool, sauna and trash service; Community of 691 units
Exterior
- Parking: Attached deeded garage; 1 covered garage space; Valet
- Security: Secured garage/parking; Key card entry; Lobby secured; Fire sprinkler system; Smoke detectors
- Utilities: Cable available
- Home design: Attached property (unit in a larger building); High-rise building; Has a view
- Construction: Block construction; Resale property
- Exterior features: Balcony; Open balcony/porch; Security/high-impact doors; Bayfront waterfront
Interior
- Kitchen: Dishwasher; Electric range; Self-cleaning oven; Microwave; Refrigerator; Disposal; Kitchen island; Eat-in kitchen; Breakfast bar
- Bedrooms: Bedroom on main level
- Flooring: Hardwood; Wood; Tile
- Bathrooms: 1 full bathroom; 1 half bathroom
- Heating & cooling: Central heating; Central air conditioning
- Interior features: Blinds and impact-resistant glass windows; Breakfast bar; Closet cabinetry; Eat-in kitchen; Kitchen island; Living/dining room; Main living area on entry level; Tub with shower; Walk-in closets
- Laundry & utility: Washer; Dryer
Neighborhood map
What this means for you Summary
Snapshot
- This is a 1-bed/1.0-bath condo listed at $400k.
Deal economics
- At list price, monthly cash flow is $-1k ($-14k/yr) — negative.
- To cash-flow at today's rent, offer at most $198k (50.4% below list).
- To meet the 1% rule (rent ≥ 1% of price), the offer needs to be $399k (0.1% below list).
- Recommended offer: $198k (50.4% below list) — sets the bar for cash-flow.
- Cap rate 4.9% vs local median 1.9% in Miami — top-decile yield for the area; either an underpriced asset or a hidden risk that comps aren't pricing in. Stress-test before assuming the spread holds.
Location & tenants
- Location reads 78/100 on livability (#177 in FL, #2,724 nationally) — a middle-class / working-renter tenant base. Strengths: amenities A+, commute A+, health & safety A+; Watch: employment C-, crime F, cost of living F.
- Miami-Dade (suburban): math 45% / reading 54% proficiency, ranked #40 of 73 in FL (top 55%) — families likely to look elsewhere, expect single-tenant / working-renter base with shorter leases; 64% free/reduced lunch — lower-income household profile, screen leases tightly.
- Zoned schools: Phyllis Wheatley Elementary School (math 17% / reading 17%, grade F, #2,121 of 2,144 statewide, top 99%, 189 students, 88% FRL); Jose De Diego Middle School (math 20% / reading 24%, grade F, #549 of 571 statewide, top 97%, 868 students, 68% FRL); Booker T. Washington Senior High (math 12% / reading 19%, grade F, #604 of 667 statewide, top 91%, 1,014 students, 60% FRL).
- Zoned-school proficiency averages 18% at this address vs 50% district-wide (-31 pts) — the specific schools serving this property underperform the Miami-Dade average; the district grade overstates school quality for this exact location.
- Market conditions: Rents flat; 882 active listings in the ZIP; 3 comparable units currently listed for rent nearby; rentals leasing fast (median 1d on market — plan ~1-2 weeks tenant-placement turnaround); solid renter incomes; 10,051 units permitted in Miami-Dade County in 2024 (7,758 in 5+ unit buildings).
Forward outlook
- Local home prices are declining (-2.5%/yr); year-one equity from $3k of loan paydown is wiped out by about $10k of value loss. Plan a longer hold.
- Miami-Dade County population projected at +28% by 2050 — long-run rental-demand tailwind backs the buy-and-hold thesis.
Negotiation context
- It's been on market 55 days — a 3% lower offer ($388k) is reasonable based on typical stale-listing flexibility.
- 10 sale attempts since 11y ago with the ask held roughly flat each time — persistent listings suggest the price (not the market) is what's stuck; bring a comps-based counter.
- Current owner paid $255k; list at $400k implies a 57% gain — meaningful room to come down on a strong offer.
Risks & watch-outs
- Watch-outs: flood insurance adds $669/mo.
- Climate carrying-cost: in FEMA flood zone VE (mandatory federal flood insurance); severe wind risk, 99% chance of damaging wind over 30y; extreme-heat days projected 6→23/yr by 2055 (HVAC capex compounding) — expect insurance premiums to compound above CPI over the hold.
Questions for the listing agent
- What do current leases actually rent for vs. the listed asking? Can we see a recent rent roll and the last 12 months of T-12 income?
- It's been on market 55 days. Have you received any prior offers? Is the seller open to a 50% concession, seller financing, or rate buy-down credit?
- What's the actual annual flood-insurance premium (NFIP or private), and is the property in a SFHA with mandatory coverage?
- What does the HOA fee cover, when was the last increase, and are there any pending special assessments or reserve-fund shortfalls?
- Any open or pending special assessments — roof, HVAC, plumbing, elevator, façade? What's the per-unit balance and payoff schedule, and is the seller paying it off at close or rolling it to the buyer?
- Is there a deadline driving the sale (1031 exchange, divorce, estate, relocation)? That informs how much negotiation room exists.
- Schools are B-rated — typically a magnet for longer-tenancy family renters. What's the average tenant stay here, and is there a school-zone premium baked into asking?
- Crime grade is F in this area — have there been break-ins, vandalism, or insurance claims at this property in the last 3 years? What carrier currently insures it and at what premium?
- The area grade is low — what's the realistic commute time and amenity access for the typical tenant pool here? Any planned neighborhood developments (good or bad) we should know about?
- What's the average days-on-market for RENTAL listings here right now (not sales)? A rising rental-DOM trend means longer vacancies and softer asking-rent achievability than the comps imply.
- What's the recent tenant-quality profile in this submarket — average credit score on applications, eviction rate, late-payment / NSF rate, and stable-employment percentage? A property-management company in the area should have these aggregated.
- How much new apartment / multifamily construction is in the pipeline within 1–3 miles? Heavy new supply (>2% of stock underway) typically softens rents 12–24 months out; light construction supports rent growth.
Investment metrics
- 1% rule
- 1.00% ✗
- Cap rate
- 4.88%
- Cash-on-cash
- -5.06%
- DSCR
- 0.77
- GRM
- 8.3
CMA / ARV
No comps found within radius.
Projected returns pro-forma
-2.52% appreciation · 0.74% rent growth · sell at horizon
- IRR
- -37.1%
- Equity multiple
- -0.23×
- Total profit
- $-137,384
- Equity at exit
- $68,119
- IRR
- -56.2%
- Equity multiple
- -1.12×
- Total profit
- $-237,055
- Equity at exit
- $49,342
Cash invested: $111,972 (down + closing). Projections, not guarantees.
Landlord ↔ Tenant lean methodology
- Overall (STATE)
- 87 Strongly Landlord-Friendly
- State Florida
- 87 Strongly Landlord-Friendly · R+3
- County
- — inherits STATE
- City
- — inherits STATE
ZIP-level market 33132
- Home prices YoY
- -0.8%
- Rents YoY
- 0.7%
- Active inventory
- 882
- Price-to-rent
- 8.3×
Monthly cashflow live
- Estimated rent
- $3,993 medium interval (Pro) →
- Mortgage (P&I)
- −$2,097
- Tax from tax record
- −$578 /mo · $6,938/yr
- Insurance
- −$167
- Flood insurance flood zone
- −$669 /mo · $8,028/yr
- HOA
- −$785
- Vacancy / Maint / Mgmt
- −$839
- Net cashflow
- $-1,141
Break-even live
Sensitivity live
| Price | -10% $-915 | -5% $-1,028 | +0% $-1,141 | +5% $-1,254 | +10% $-1,368 |
|---|---|---|---|---|---|
| Rent | -10% $-1,457 | -5% $-1,299 | +0% $-1,141 | +5% $-984 | +10% $-826 |
| Rate | -1.0pp $-940 | -0.5pp $-1,040 | base $-1,141 | +0.5pp $-1,245 | +1.0pp $-1,350 |
UW: 25.0% down · 7.5% · 30yr · 1.5% tax · 5.0% vac · 8.0% maint · 8.0% mgmt
Financing live
Cash to close
- Down payment
- $99,975
- Closing costs
- $11,997
- Reserves months
- —
- Total cash needed
- —
Loan-product check · same deal, 3 products live
Conventional
25% down · 7.5% · 30yr
- Down + closing
- —
- Monthly P&I
- —
- Monthly cashflow
- —
- DSCR
- —
- Eligible?
- —
Personal DTI + credit; lowest rate.
DSCR
20% down · 8.5% · 30yr
- Down + closing
- —
- Monthly P&I
- —
- Monthly cashflow
- —
- DSCR
- —
- Eligible?
- —
No personal income docs; deal must DSCR.
Hard money
10% down · 12.0% · 12mo
- Down + closing
- —
- Monthly P&I
- —
- Monthly cashflow
- —
- DSCR
- —
- Eligible?
- —
Short-term bridge; refi at stabilization.
Rent comps 3 comps
| Address | Beds | Baths | Sqft | Rent | $/sqft | DOM | Units | Dist |
|---|---|---|---|---|---|---|---|---|
| 2900 Biscayne Blvd Miami, FL | 3.0 | 1.0–3.5 | 1260 | $8,110 | $6.44 | 4d | 13 | 0.74mi |
| 601 NE 1st Ave Unit 1227496P Miami, FL | 3.0 | 1.0–3.0 | 904 | $8,354 | $9.24 | 0d | 4 | 0.97mi |
| 555 NE 34th St Miami, FL | 1.0–4.0 | 1.5–4.0 | 2653 | $3,780 | $1.42 | 0d | 19 | 1.05mi |
HOA detail condo
- Monthly dues
- $785 · $9,420/yr
- Likely covers
- water
- Assessments
- None detected in remarks — confirm with the listing agent.
Listing history 41 events
-
2026-06-21days on market $399,900 Active 55 DOM
-
2026-06-18days on market $399,900 Active 52 DOM
-
2026-06-17days on market $399,900 Active 51 DOM
-
2026-06-16days on market $399,900 Active 50 DOM
-
2026-06-15days on market $399,900 Active 49 DOM
-
2026-06-13days on market $399,900 Active 47 DOM
-
2026-06-09days on market $399,900 Active 43 DOM
-
2026-06-08days on market $399,900 Active 42 DOM
-
2026-06-07days on market $399,900 Active 41 DOM
-
2026-06-04days on market $399,900 Active 38 DOM
-
2026-06-03days on market $399,900 Active 37 DOM
-
2026-06-02days on market $399,900 Active 36 DOM
-
2026-06-01days on market $399,900 Active 35 DOM
-
2026-05-31days on market $399,900 Active 34 DOM
-
2026-04-24$399,900 Active
-
2026-04-01historical
-
2026-01-06historical $2,800
-
2025-12-30price $399,995
-
2025-12-17$2,800
-
2025-11-01$399,999 Active
-
2025-08-31historical
-
2025-02-14$415,000 Active
-
2025-01-08historical
-
2024-09-11$425,000 Active
-
2023-11-03historical $2,750
-
2023-10-17price $2,750
-
2023-10-12$2,900
-
2019-09-06soldstatus $255,000
-
2019-09-05soldstatus $255,000 Sold
-
2019-07-17status Pending
-
2019-05-24$270,000 Active
-
2019-05-13historical
-
2019-01-14$285,000 Active
-
2017-12-07soldstatus $256,000
-
2017-09-01historical
-
2017-01-21price $264,000
-
2016-12-02$269,000 Active
-
2015-12-12historical
-
2015-09-09price $289,000
-
2015-06-11$298,000 Active
-
2008-02-19soldstatus $241,000
ⓘ Source: listings_history table (triggers on properties + properties_extension) + one-shot
backfill from property_details.listing_events for pre-trigger history.
Tax reassessment forecast FL · Resets to sale price
- Current annual tax
- $6,938 · $578/mo
- Projected year-2 tax
- $6,938 · $578/mo
- Expected delta
- $0/yr ($0/mo · 0.0%)
ⓘ Screening estimate from a state-policy table — verify with the county assessor before closing.
Climate risk First Street
- Flood 10/10 Extreme FEMA zone VE · 99% chance over 30 yrs
- Wildfire 1/10 Low
- Heat 10/10 Extreme 6 d/yr ≥103°F today · 23 d/yr by 30 yrs out
- Wind 10/10 Extreme 99% chance of damaging wind over 30 yrs
- Air quality 2/10 Low 1 unhealthy d/yr today · 1 by 30 yrs out
Nearby sold comps map
Loading sold comps map…
Walkable amenities ~0.75 mi
Loading nearby amenities…
Taxation est. · year 1
- Rental income
- $47,919
- − Mortgage interest
- −$22,401
- − Property taxes
- −$6,938
- − Insurance
- −$10,028
- − Repairs & maintenance
- −$3,834
- − Management
- −$3,834
- − HOA
- −$9,420
- − Depreciation
- −$11,633
- Taxable loss
- −$20,168
- Est. tax savings @ 24.0%
- +$4,840
- After-tax cash flow
- $-8,855/yr
For passive investors: Depreciation is non-cash, so a rental often shows a tax loss while cash-flowing — sheltering income. Rental losses are passive: they offset passive income freely, and up to $25,000/yr can offset ordinary (W-2) income if you actively participate and your MAGI is under $100k (phasing out to $0 by $150k); unused losses carry forward. On sale, claimed depreciation is recaptured at up to 25%, and gains may owe capital-gains tax (a 1031 exchange can defer both). Figures are a year-1 estimate at your 24.0% rate — not tax advice; consult a CPA.
Schools (NCES district)
- District
- Miami-Dade
- NCES district ID
- 1200390
- Math proficiency
- 45% ▼ -16.00%
- Reading proficiency
- 54% ▼ -5.00%
- Median HH income
- $43,928
- Composite
- 41.76/100
- National rank
- #3397
- State rank
- #40 of 73 in FL
Livability — Miami
- Score
- 78/100
- State rank
- #177
- US rank
- #2724
Category grades
Schools grade is shown separately in the Schools card above.
Census & demographics
- Census place
- Miami, FL
- County
- Miami-Dade County · 2,697,751 people
- City population
- 827,308
- Metro
- Miami-Fort Lauderdale-Pompano Beach, FL
- Population (ZIP)
- 20,253
- Household income
- $109,109
- Rent vs Own
- Severe rent burden
- 2260.0
Population outlook (Miami-Dade County) Hauer SSP2
- Today (2025)
- 3,126,439 people
- By 2030
- 3,325,765 · +6.4%
- By 2040
- 3,697,561 · +18.3%
- By 2050
- 4,012,134 · +28.3%
- By 2075
- 4,605,612 · +47.3%
- By 2100
- 4,866,598 · +55.7%
Race, ethnicity, and origin ACS 2023
- Neighborhood character
- Diverse neighborhood (Simpson 0.63)
- Race & ethnicity
- Hispanic / Latino 53% Two or more races 39% White 29% Black 7% Asian 6%
- Hispanic origin (detail)
- Mexican 3% Puerto Rican 4% Cuban 9% Dominican 2% Salvadoran 1%
- Common ancestry
- Estonian 2% Scotch-Irish 2% Romanian 1%
- Foreign-born
- 50% · Canada, Jamaica, Dominican Republic
- Languages at home
- 35% English-only · Spanish 49% Other Indo-European 6% Other Asian/Pacific 2%
Political lean MEDSL · Miami-Dade
- 2024 margin
- R (+11.4) · D 43.9% · R 55.4%
- 2008→2024 swing
- -27.6pp toward R · 2008: 16.1pp · 2024: -11.4pp
- All cycles
- 2024: R+11.4 2020: D+7.3 2016: D+29.6 2012: D+23.7 2008: D+16.1
Not yet ingested
- Civics
- —
Market trends
- HPI YoY
- ▼ -2.52%
- Current HPI
- 294.3744
- Rent YoY
- ▲ 0.74%
- Metro
- Miami-Fort Lauderdale-Pompano Beach, FL
- State GDP YoY
- ▲ 3.28%
- F500 in state
- 36
Industry mix (Fortune 500 HQ in FL)
| Industry | F500 HQs | Revenue |
|---|---|---|
| Industrial Technology | 2 | $29B |
|
||
| Insurance | 2 | $17B |
|
||
| Retail | 1 | $60B |
|
||
| Technology Distribution | 1 | $58B |
|
||
| Homebuilding | 1 | $35B |
|
||
| Technology Manufacturing | 1 | $35B |
|
||
Price history
+65.9% since first listed27 events — show timeline
- 2026-04-24 Listed $399,900 MARMLS
- 2026-04-01 Listing Removed — MARMLS
- 2026-01-06 Rental Removed $2,800 MARMLS
- 2025-12-30 Price Changed $399,995 MARMLS
- 2025-12-17 Listed for Rent $2,800 MARMLS
- 2025-11-01 Listed $399,999 MARMLS
- 2025-08-31 Listing Removed — MARMLS
- 2025-02-14 Listed $415,000 MARMLS
- 2025-01-08 Listing Removed — MARMLS
- 2024-09-11 Listed $425,000 MARMLS
- 2023-11-03 Rental Removed $2,750 MARMLS
- 2023-10-17 Price Changed $2,750 MARMLS
- 2023-10-12 Listed for Rent $2,900 MARMLS
- 2019-09-06 Sold (Public Records) $255,000 Public Records
- 2019-09-05 Sold (MLS) $255,000 MARMLS
- 2019-07-17 Pending — MARMLS
- 2019-05-24 Listed $270,000 MARMLS
- 2019-05-13 Listing Removed — MARMLS
- 2019-01-14 Listed $285,000 MARMLS
- 2017-12-07 Sold (Public Records) $256,000 Public Records
- 2017-09-01 Listing Removed — MARMLS
- 2017-01-21 Price Changed $264,000 MARMLS
- 2016-12-02 Listed $269,000 MARMLS
- 2015-12-12 Listing Removed — MARMLS
- 2015-09-09 Price Changed $289,000 MARMLS
- 2015-06-11 Listed $298,000 MARMLS
- 2008-02-19 Sold (Public Records) $241,000 Public Records
Property tax history
+5.7%/yrLatest (2025): $6,938 · -7.7% YoY. Source: county tax records.
Cash-flow waterfall
monthlySold comps — $/sqft
last 12 mo · ≤1 miLoading sold comps…