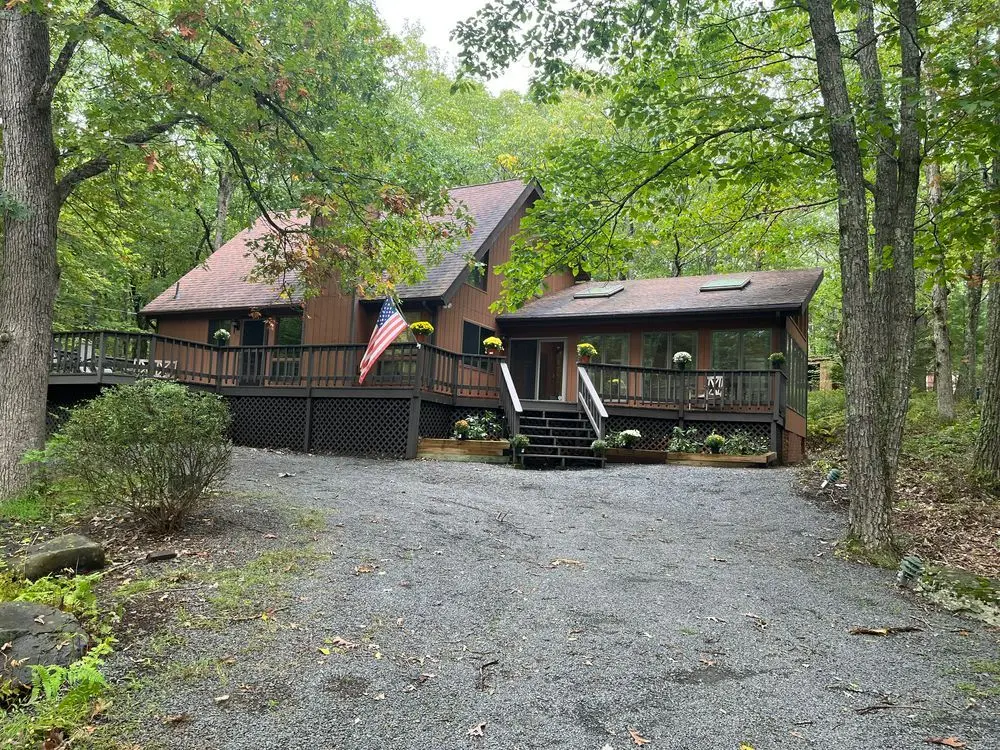
123 Portage Ln · Hemlock Farms, PA
Flood risk 6/10 · Moderate
- FEMA flood zone
- X (unshaded)
- Chance of flooding over 30 yrs
- 0.74%
- Est. flood insurance / yr
- $473 – $860
Fire risk 5/10 · Moderate
- Est. fire insurance / yr
- $511 – $949
Heat risk 2/10 · Minimal
- Hot days now (above 91°F)
- 7 days/yr
- Hot days in 30 yrs
- 15 days/yr
Wind risk 3/10 · Minor
- Chance of severe wind over 30 yrs
- 5.0%
Air-quality risk 2/10 · Minimal
- Unhealthy air days now
- 1 days/yr
- Unhealthy air days in 30 yrs
- 2 days/yr
Risk factors via First Street. Map © Google.
Why this score? — see what drove the B grade
The composite is a weighted blend of 9 inputs, each scored 0–100. Each bar is that input's sub-score; the figure is the points it added to the 100-point composite (weight × sub-score).
- Cash flow +25.7/30.0
- Appreciation +10.0/10.0
- DSCR +8.6/10.0
- ARV discount +7.8/15.0
- 1% rule +6.9/10.0
- Livability +3.4/5.0
- Schools +3.0/10.0
- Rent growth +2.5/5.0
- Condition / age +2.5/5.0
$330,000
🖨 Deal sheet 📄 Offer letter ✓ Due diligence
Listing remarks
Beautiful solidly built home nestled on a quiet cul-de-sac in the amenity-filled prestige community of Hemlock Farms PA. This home has lots of light, lots of functionality for all 4 seasons, and backs onto state forest land. Family visits are always welcome when you have 2 upstairs bedrooms and a bath, separate from the 1st floor master suite. Laundry conveniently located on main floor. Walk to one of the multiple lakes in the community, or take a short ride to the golf course/country club. Amenities are balanced with safety and efficiency by the community leaders. This home is a doable drive from the city for weekend and summer visits, and perfect for those considering retirement to a tran
Key facts
- Community amenities
- Cul-de-sac
- Multiple lakes
Tags
Property features AI
Exterior
- Home design: House
- Exterior features: Lot is approximately 0.51 acres
Neighborhood map
What this means for you Summary
Snapshot
- This is a 3-bed/2.0-bath single-family listed at $330k.
Deal economics
- At list price, monthly cash flow is $792 ($10k/yr) — positive.
- The deal already cash-flows at list — no discount required.
- Meets the 1% rule at list price ($4k rent vs $330k).
- Recommended offer: $325k (1.5% below list) — sets the bar for market timing.
- Cap rate 9.2% vs local median 7.1% in Hemlock Farms — meaningfully above typical; check what's discounted (condition, days-on-market, listing class) to confirm the premium yield is real.
Location & tenants
- Location reads 68/100 on livability (#884 in PA) — a middle-class / working-renter tenant base. Strengths: crime A+, housing A+, health & safety A+; Watch: schools C-, amenities F, commute F.
- East Stroudsburg Area SD (rural): math 25% / reading 43% proficiency, ranked #413 of 539 in PA (top 77%) — families likely to look elsewhere, expect single-tenant / working-renter base with shorter leases.
- Market conditions: 371 active listings in the ZIP; 2 comparable units currently listed for rent nearby; 213 units permitted in Pike County in 2024 (0 in 5+ unit buildings).
Forward outlook
- In year one you build about $35k of equity ($2k loan paydown + $33k appreciation (10.0% local appreciation)).
- Pike County population projected at -25% by 2050 — secular population decline; favor cash flow + early exit over multi-decade hold.
- At projected returns (10.0% appreciation + 3.0% rent growth), your $92k cash investment doubles in ~2 years — after that, you're playing with house money.
- By year 2, paydown + projected appreciation supports a ~$57k cash-out refi (75% LTV) — recoverable capital for the next deal without selling this one.
Negotiation context
- It's been on market 15 days — a 2% lower offer ($325k) is reasonable based on typical stale-listing flexibility.
- 6 sale attempts since 3y ago with the ask held roughly flat each time — persistent listings suggest the price (not the market) is what's stuck; bring a comps-based counter.
Risks & watch-outs
- Climate carrying-cost: major flood risk; moderate wildfire risk — expect insurance premiums to compound above CPI over the hold.
Questions for the listing agent
- Is there a deadline driving the sale (1031 exchange, divorce, estate, relocation)? That informs how much negotiation room exists.
- What's the average days-on-market for RENTAL listings here right now (not sales)? A rising rental-DOM trend means longer vacancies and softer asking-rent achievability than the comps imply.
- What's the recent tenant-quality profile in this submarket — average credit score on applications, eviction rate, late-payment / NSF rate, and stable-employment percentage? A property-management company in the area should have these aggregated.
- How much new for-sale + rental construction is in the pipeline within 1–3 miles? Heavy new supply typically softens prices + rents 12–24 months out; constrained supply supports both.
Investment metrics
- 1% rule
- 1.19% ✓
- Cap rate
- 9.17%
- Cash-on-cash
- 10.29%
- DSCR
- 1.46
- GRM
- 7.0
CMA / ARV
- ARV (on-the-fly)
- $331,962
- Comps found
- 10
Show comp detail 10 sales within ~0.75 mi
| Address | Dist | Beds/Ba | Sqft | Sold | Price | $/sf | Match |
|---|---|---|---|---|---|---|---|
| 128 Portage Ln | 0.09mi | 3/2.0 | 1,651 (-9%) | 3mo | $340,000 | $206 | 78 |
| 800 Main Ct | 0.15mi | 3/2.0 | 1,962 (+8%) | 14mo | $417,000 | $213 | 68 |
| 110 Washington Dr | 0.28mi | 3/2.5 | 1,944 (+7%) | 9mo | $350,000 | $180 | 66 |
| 805 Main Ct | 0.23mi | 3/3.0 | 1,920 (+6%) | 18mo | $401,750 | $209 | 60 |
| 120 Portage Ln | 0.06mi | 3/2.5 | 2,078 (+15%) | 22mo | $410,000 | $197 | 53 |
| 139 Fairway Dr | 0.67mi | 3/2.0 | 1,916 (+6%) | 17mo | $350,000 | $183 | 45 |
| 107 Franklin Dr | 0.66mi | 3/2.5 | 1,993 (+10%) | 8mo | $320,000 | $161 | 44 |
| 119 Washington Dr | 0.21mi | 4/2.0 (+1) | 2,071 (+14%) | 21mo | $309,000 | $149 | 44 |
| 102 Roosevelt Dr | 0.55mi | 3/2.0 | 1,576 (-13%) | 19mo | $270,000 | $171 | 37 |
| 103 Fairway Ln | 0.69mi | 4/2.0 (+1) | 1,548 (-15%) | 14mo | $249,000 | $161 | 27 |
Match score weights: distance 35% · size 25% · config 20% · recency 20%. Top-matched comps best support the ARV.
Projected returns pro-forma
10.0% appreciation · 3.0% rent growth · sell at horizon
- IRR
- 31.8%
- Equity multiple
- 3.49×
- Total profit
- $230,249
- Equity at exit
- $297,290
- IRR
- 27.5%
- Equity multiple
- 7.91×
- Total profit
- $638,535
- Equity at exit
- $641,117
Cash invested: $92,400 (down + closing). Projections, not guarantees.
Landlord ↔ Tenant lean methodology
- Overall (STATE)
- 62 Landlord-Friendly
- State Pennsylvania
- 62 Landlord-Friendly · EVEN
- County
- — inherits STATE
- City
- — inherits STATE
ZIP-level market 18428
- Home prices YoY
- 9.2%
- Active inventory
- 371
- Price-to-rent
- 7.0×
Monthly cashflow live
- Estimated rent
- $3,931 medium interval (Pro) →
- Mortgage (P&I)
- −$1,731
- Tax from tax record
- −$445 /mo · $5,344/yr
- Insurance
- −$138
- HOA
- −$0
- Vacancy / Maint / Mgmt
- −$825
- Net cashflow
- $792
Break-even live
UW: 25.0% down · 7.5% · 30yr · 1.5% tax · 5.0% vac · 8.0% maint · 8.0% mgmt
Financing live
Cash to close
- Down payment
- $82,500
- Closing costs
- $9,900
- Reserves months
- —
- Total cash needed
- —
Loan-product check · same deal, 3 products live
Conventional
25% down · 7.5% · 30yr
- Down + closing
- —
- Monthly P&I
- —
- Monthly cashflow
- —
- DSCR
- —
- Eligible?
- —
Personal DTI + credit; lowest rate.
DSCR
20% down · 8.5% · 30yr
- Down + closing
- —
- Monthly P&I
- —
- Monthly cashflow
- —
- DSCR
- —
- Eligible?
- —
No personal income docs; deal must DSCR.
Hard money
10% down · 12.0% · 12mo
- Down + closing
- —
- Monthly P&I
- —
- Monthly cashflow
- —
- DSCR
- —
- Eligible?
- —
Short-term bridge; refi at stabilization.
Rent comps 2 comps
| Address | Beds | Baths | Sqft | Rent | $/sqft | DOM | Units | Dist |
|---|---|---|---|---|---|---|---|---|
| 113 Portage Ln Milford, PA | 3.0 | 2.0 | 1400 | $4,000 | $2.86 | 1d | 1 | 0.10mi |
| 402 Canoe Brook Dr Hawley, PA | 3.0 | 2.0 | 2055 | $3,500 | $1.70 | 1d | 1 | 0.74mi |
Listing history 13 events
-
2026-06-19days on market $330,000 Active 15 DOM
-
2026-06-18days on market $330,000 Active 14 DOM
-
2026-06-17days on market $330,000 Active 13 DOM
-
2026-06-16days on market $330,000 Active 12 DOM
-
2026-06-15days on market $330,000 Active 11 DOM
-
2026-06-14days on market $330,000 Active 9 DOM
-
2026-06-13days on market $330,000 Active 8 DOM
-
2026-06-10days on market $330,000 Active 6 DOM
-
2026-06-09days on market $330,000 Active 5 DOM
-
2026-06-08days on market $330,000 Active 4 DOM
-
2026-06-07days on market $330,000 Active 3 DOM
-
2026-06-05remarks 699-char remark
-
2026-06-05$330,000 Active 1 DOM
ⓘ Source: listings_history table (triggers on properties + properties_extension) + one-shot
backfill from property_details.listing_events for pre-trigger history.
Tax reassessment forecast PA · Partial reset (capped growth)
- Current annual tax
- $5,344 · $445/mo
- Projected year-2 tax
- $5,344 · $445/mo
- Expected delta
- $0/yr ($0/mo · 0.0%)
ⓘ Screening estimate from a state-policy table — verify with the county assessor before closing.
Climate risk First Street
- Flood 6/10 Major FEMA zone X (unshaded) · 74% chance over 30 yrs
- Wildfire 5/10 Major
- Heat 2/10 Low 7 d/yr ≥91°F today · 15 d/yr by 30 yrs out
- Wind 3/10 Moderate 5% chance of damaging wind over 30 yrs
- Air quality 2/10 Low 1 unhealthy d/yr today · 2 by 30 yrs out
Nearby sold comps map
Loading sold comps map…
Walkable amenities ~0.75 mi
Loading nearby amenities…
Taxation est. · year 1
- Rental income
- $47,171
- − Mortgage interest
- −$18,485
- − Property taxes
- −$5,344
- − Insurance
- −$1,650
- − Repairs & maintenance
- −$3,774
- − Management
- −$3,774
- − Depreciation
- −$9,600
- Taxable income
- $4,544
- Est. tax owed @ 24.0%
- −$1,091
- After-tax cash flow
- $8,413/yr
For passive investors: Depreciation is non-cash, so a rental often shows a tax loss while cash-flowing — sheltering income. Rental losses are passive: they offset passive income freely, and up to $25,000/yr can offset ordinary (W-2) income if you actively participate and your MAGI is under $100k (phasing out to $0 by $150k); unused losses carry forward. On sale, claimed depreciation is recaptured at up to 25%, and gains may owe capital-gains tax (a 1031 exchange can defer both). Figures are a year-1 estimate at your 24.0% rate — not tax advice; consult a CPA.
Schools (NCES district)
- District
- East Stroudsburg Area SD
- NCES district ID
- 4208670
- Math proficiency
- 25% ▼ -11.00%
- Reading proficiency
- 43% ▼ -18.00%
- Median HH income
- $57,142
- Composite
- 30.13/100
- National rank
- #6332
- State rank
- #413 of 539 in PA
Livability — Hemlock Farms
- Score
- 68/100
- State rank
- #884
- US rank
- #9421
Category grades
Schools grade is shown separately in the Schools card above.
Census & demographics
- Census place
- Hemlock Farms, PA
- Population (ZIP)
- 12,446
Population outlook (Pike County) Hauer SSP2
- Today (2025)
- 53,548 people
- By 2030
- 51,622 · -3.6%
- By 2040
- 46,490 · -13.2%
- By 2050
- 40,372 · -24.6%
- By 2075
- 31,951 · -40.3%
- By 2100
- 26,821 · -49.9%
Race, ethnicity, and origin ACS 2023
- Neighborhood character
- Predominantly White (85%)
- Race & ethnicity
- White 85% Hispanic / Latino 8% Two or more races 6% Black 1% Asian 1%
- Hispanic origin (detail)
- Puerto Rican 5%
- Common ancestry
- Romanian 5% Portuguese 3% Italian 2%
- Foreign-born
- 5% · Canada
- Languages at home
- 91% English-only · Spanish 5% Russian/Polish/Slavic 1% Other Asian/Pacific 1%
Political lean MEDSL · Pike
- 2024 margin
- Strong R (+24.1) · D 37.6% · R 61.6%
- 2008→2024 swing
- -19.8pp toward R · 2008: -4.2pp · 2024: -24.1pp
- All cycles
- 2024: R+24.1 2020: R+19.0 2016: R+26.0 2012: R+11.0 2008: R+4.2
Not yet ingested
- Civics
- —
Market trends
- HPI YoY
- ▲ 28.60%
- Current HPI
- 340.8254
- Rent YoY
- —
- Metro
- —
- State GDP YoY
- ▲ 1.68%
- F500 in state
- 34
Industry mix (Fortune 500 HQ in PA)
| Industry | F500 HQs | Revenue |
|---|---|---|
| Healthcare | 2 | $309B |
|
||
| Insurance | 2 | $27B |
|
||
| Telecommunications / Media | 1 | $124B |
|
||
| Industrial Distribution | 1 | $22B |
|
||
| Financial Services | 1 | $20B |
|
||
| Chemicals / Materials | 1 | $18B |
|
||
Price history
+106.2% since first listed26 events — show timeline
- 2026-06-04 Listed $330,000 ForSaleByOwner.com
- 2025-12-11 Price Changed $350,500 PWMLS
- 2025-12-09 Price Changed $352,500 PWMLS
- 2025-12-01 Price Changed $356,500 PWMLS
- 2025-11-13 Price Changed $359,500 PWMLS
- 2025-09-16 Price Changed $364,500 PWMLS
- 2025-09-02 Price Changed $369,500 PWMLS
- 2025-08-14 Price Changed $361,500 PWMLS
- 2025-08-13 Price Changed $364,500 PWMLS
- 2025-08-01 Listed $369,500 PWMLS
- 2024-05-08 Price Changed $379,000 PWMLS
- 2024-04-24 Price Changed $382,500 PWMLS
- 2024-04-12 Price Changed $384,000 PWMLS
- 2024-03-27 Price Changed $389,000 PWMLS
- 2024-03-16 Price Changed $409,500 PWMLS
- 2024-03-01 Relisted — PWMLS
- 2024-03-01 Price Changed $399,500 PWMLS
- 2024-02-12 Price Changed $389,000 PWMLS
- 2024-01-27 Listed $369,000 PWMLS
- 2023-08-11 Sold (Public Records) $290,000 Public Records
- 2023-07-31 Sold (MLS) $290,000 PWMLS
- 2023-07-31 Sold (MLS) $290,000 PWMLS
- 2023-07-01 Pending — PWMLS
- 2023-06-28 Listed $299,000 PWMLS
- 2023-06-28 Listed $299,000 PWMLS
- 2001-08-08 Sold (Public Records) $160,000 Public Records
Property tax history
+1.1%/yrLatest (2026): $5,344 · +2.3% YoY. Source: county tax records.
Cash-flow waterfall
monthlySold comps — $/sqft
last 12 mo · ≤1 miLoading sold comps…