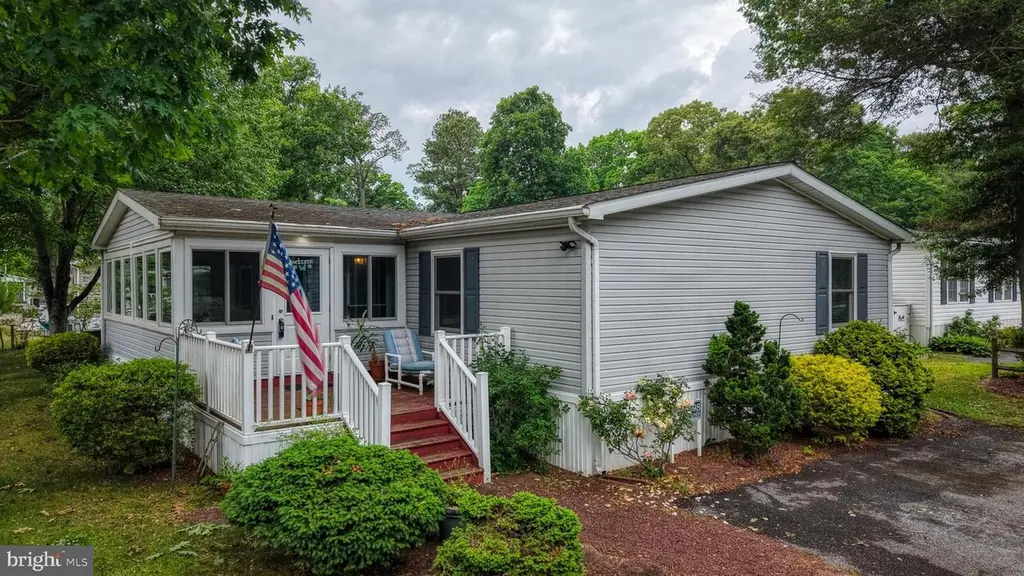
26598 Pepperidge Cv #3057 · Long Neck, DE
Flood risk 6/10 · Moderate
- FEMA flood zone
- X (unshaded)
- Chance of flooding over 30 yrs
- 0.73%
- Est. flood insurance / yr
- $473 – $860
Fire risk 1/10 · Minimal
- Est. fire insurance / yr
- $476 – $884
Heat risk 8/10 · Major
- Hot days now (above 101°F)
- 7 days/yr
- Hot days in 30 yrs
- 18 days/yr
Wind risk 8/10 · Major
- Chance of severe wind over 30 yrs
- 80.0%
Air-quality risk 2/10 · Minimal
- Unhealthy air days now
- 1 days/yr
- Unhealthy air days in 30 yrs
- 1 days/yr
Risk factors via First Street. Map © Google.
Why this score? — see what drove the B+ grade
The composite is a weighted blend of 9 inputs, each scored 0–100. Each bar is that input's sub-score; the figure is the points it added to the 100-point composite (weight × sub-score).
- Cash flow +30.0/30.0
- ARV discount +15.0/15.0
- 1% rule +10.0/10.0
- DSCR +10.0/10.0
- Livability +3.5/5.0
- Schools +2.9/10.0
- Condition / age +2.8/5.0
- Rent growth +2.5/5.0
- Appreciation +0.0/10.0
$149,000
🖨 Deal sheet 📄 Offer letter ✓ Due diligence
Listing remarks
Wonderful cozy home in a desired community of Pot Nets Lakeside. Some furnishings are included . Many improvements including windows and walk in shower . This would be a great second home near the beach or a full time residence in an active community. It is a must see ! There is a very nice lake that centers this community, a clubhouse for many uses, a community pool.
Key facts
- Community pool
- Walk in shower
- Nice lake
Tags
Property features AI
Finance
- Other: Property listed in a community named Pot Nets Creekside; Pets allowed (cats and dogs permitted)
- Financial info: Land lease of $860 per month (approximately 5 years remaining); Ground rent exists and is paid annually
- HOA & community: Community amenities include beach access, bike trail, community center, gated community, jogging/walking paths, outdoor pool, and swimming pool
Exterior
- Parking: Paved driveway; Two driveway spaces; Two off-street spaces; Total of four garage/parking spaces
- Security: Community offers security
- Utilities: Public water; Public sewer hookups available; Above-ground utilities; Cable TV available; Propane available; Municipal trash not provided
- Home design: Manufactured home (double wide); Single-story (entry level 1); Vinyl siding; Shingle (asphalt) roof; Estimated year built; Not in a federal flood zone; Building not winterized
- Construction: Modular/manufactured construction; Pillar/post/pier foundation with crawl space; Insulated windows with screens
- Exterior features: Deck(s); Outbuilding(s); Above-grade outdoor structure
Interior
- Kitchen: Dishwasher; Garbage disposal; Icemaker; Refrigerator; Microwave; Gas range/oven; Range hood
- Bedrooms: Three bedrooms on the main level
- Flooring: Carpet; Vinyl
- Bathrooms: Two full bathrooms (main level)
- Heating & cooling: Forced-air heating; Heat pump(s); Propane (leased) heating fuel; Central air conditioning; 100 Amp electrical service
- Interior features: Country-style kitchen; Entry-level bedroom; Skylights; Insulated doors
- Laundry & utility: Washer and electric dryer on the main floor; Electric water heater
Neighborhood map
What this means for you Summary
Snapshot
- This is a 3-bed/2.0-bath single-family listed at $149k. Condition is rated average.
Deal economics
- At list price, monthly cash flow is $1k ($12k/yr) — positive.
- The deal already cash-flows at list — no discount required.
- Meets the 1% rule at list price ($3k rent vs $149k).
- Recommended offer: $147k (1.5% below list) — sets the bar for market timing.
- Cap rate 14.5% vs local median 3.2% in Long Neck — top-decile yield for the area; either an underpriced asset or a hidden risk that comps aren't pricing in. Stress-test before assuming the spread holds.
Location & tenants
- Location reads 69/100 on livability (#30 in DE) — a middle-class / working-renter tenant base. Strengths: cost of living A+, housing A+, crime A-; Watch: employment D+, amenities F, commute F.
- Indian River School District (rural): math 25% / reading 41% proficiency, ranked #14 of 26 in DE (top 54%) — families likely to look elsewhere, expect single-tenant / working-renter base with shorter leases.
- Zoned schools: Long Neck Elementary School (math 22% / reading 35%, grade F, #57 of 105 statewide, top 55%, 693 students, 0% FRL); Millsboro Middle School (math 24% / reading 42%, grade F, #14 of 36 statewide, top 37%, 771 students, 0% FRL); Indian River High School (math 32% / reading 52%, grade F, #10 of 40 statewide, top 26%, 1,088 students, 0% FRL) — zoned schools average 0% FRL vs 49% district-wide (49 pts lower); this property's tenant base skews higher-income than the district average.
- Market conditions: 865 active listings in the ZIP; 2 comparable units currently listed for rent nearby; solid renter incomes; 4,354 units permitted in Sussex County in 2024 (344 in 5+ unit buildings).
- This rent runs 40% of the median local income ($78k/yr) — at the standard rent-burdened threshold; future hikes will face affordability resistance.
Forward outlook
- Local home prices are declining (-3.0%/yr); year-one equity from $1k of loan paydown is wiped out by about $4k of value loss. Plan a longer hold.
- Sussex County population projected at +25% by 2050 — long-run rental-demand tailwind backs the buy-and-hold thesis.
- At projected returns (-3.0% appreciation + 3.0% rent growth), your $42k cash investment doubles in ~5 years — after that, you're playing with house money.
Negotiation context
- It's been on market 22 days — a 2% lower offer ($147k) is reasonable based on typical stale-listing flexibility.
Risks & watch-outs
- Climate carrying-cost: major flood risk; severe wind risk, 80% chance of damaging wind over 30y; extreme-heat days projected 7→18/yr by 2055 (HVAC capex compounding) — expect insurance premiums to compound above CPI over the hold.
Questions for the listing agent
- Is there a deadline driving the sale (1031 exchange, divorce, estate, relocation)? That informs how much negotiation room exists.
- Schools are F-rated, which usually means shorter tenancies and higher turnover. Who's the typical renter profile here, and what's been the actual vacancy rate?
- What's the average days-on-market for RENTAL listings here right now (not sales)? A rising rental-DOM trend means longer vacancies and softer asking-rent achievability than the comps imply.
- What's the recent tenant-quality profile in this submarket — average credit score on applications, eviction rate, late-payment / NSF rate, and stable-employment percentage? A property-management company in the area should have these aggregated.
- How much new for-sale + rental construction is in the pipeline within 1–3 miles? Heavy new supply typically softens prices + rents 12–24 months out; constrained supply supports both.
Investment metrics
- 1% rule
- 1.74% ✓
- Cap rate
- 14.54%
- Cash-on-cash
- 29.45%
- DSCR
- 2.31
- GRM
- 4.8
CMA / ARV
- ARV (on-the-fly)
- $193,520
- Comps found
- 12
Show comp detail 12 sales within ~0.75 mi
| Address | Dist | Beds/Ba | Sqft | Sold | Price | $/sf | Match |
|---|---|---|---|---|---|---|---|
| 33361 Nannyberry Cv #2601 | 0.33mi | 3/2.0 | 1,680 (+2%) | 2mo | $166,000 | $99 | 79 |
| 26656 Castaway Cir #52344 | 0.25mi | 3/2.0 | 1,680 (+2%) | 8mo | $199,000 | $118 | 78 |
| 26496 Launch Cv #2947 | 0.33mi | 3/2.0 | 1,680 (+2%) | 5mo | $100,000 | $60 | 76 |
| 32935 Mimosa Cv | 0.41mi | 3/2.0 | 1,680 (+2%) | 4mo | $280,000 | $167 | 74 |
| 33284 High Bush #2662 | 0.14mi | 3/2.0 | 1,488 (-9%) | 6mo | $198,897 | $134 | 73 |
| 33239 Tidewater Cv #2678 | 0.07mi | 3/2.0 | 1,400 (-15%) | 8mo | $119,000 | $85 | 66 |
| 26300 Timbercreek Ln | 0.44mi | 3/2.0 | 1,775 (+8%) | 2mo | $439,690 | $248 | 64 |
| 33318 Lakeshore Cir #2763 | 0.36mi | 3/2.0 | 1,782 (+9%) | 8mo | $205,000 | $115 | 62 |
| 26294 Creekwood Cir #2631 | 0.31mi | 3/2.0 | 1,848 (+13%) | 2mo | $208,000 | $113 | 62 |
| 32685 Seaview Loop | 0.58mi | 2/2.0 (-1) | 1,734 (+6%) | 1mo | $385,000 | $222 | 58 |
| 32912-LOT # 3167 Tern Cv | 0.44mi | 3/2.0 | 1,855 (+13%) | 3mo | $430,779 | $232 | 55 |
| 33424 Pinebark Cv #2625 | 0.61mi | 3/2.0 | 1,820 (+11%) | 1mo | $192,000 | $105 | 52 |
Match score weights: distance 35% · size 25% · config 20% · recency 20%. Top-matched comps best support the ARV.
Projected returns pro-forma
-3.0% appreciation · 3.0% rent growth · sell at horizon
- IRR
- 23.9%
- Equity multiple
- 1.99×
- Total profit
- $41,097
- Equity at exit
- $22,216
- IRR
- 31.8%
- Equity multiple
- 3.87×
- Total profit
- $119,904
- Equity at exit
- $12,883
Cash invested: $41,720 (down + closing). Projections, not guarantees.
Landlord ↔ Tenant lean methodology
- Overall (STATE)
- 70 Landlord-Friendly
- State Delaware
- 70 Landlord-Friendly · D+7
- County
- — inherits STATE
- City
- — inherits STATE
ZIP-level market 19966
- Home prices YoY
- -6.4%
- Active inventory
- 865
- Price-to-rent
- 4.8×
Monthly cashflow live
- Estimated rent
- $2,599 medium interval (Pro) →
- Mortgage (P&I)
- −$781
- Tax est. 1.5%
- −$186 /mo · $2,235/yr
- Insurance
- −$62
- HOA
- −$0
- Vacancy / Maint / Mgmt
- −$546
- Net cashflow
- $1,024
Break-even live
UW: 25.0% down · 7.5% · 30yr · 1.5% tax · 5.0% vac · 8.0% maint · 8.0% mgmt
Financing live
Cash to close
- Down payment
- $37,250
- Closing costs
- $4,470
- Reserves months
- —
- Total cash needed
- —
Loan-product check · same deal, 3 products live
Conventional
25% down · 7.5% · 30yr
- Down + closing
- —
- Monthly P&I
- —
- Monthly cashflow
- —
- DSCR
- —
- Eligible?
- —
Personal DTI + credit; lowest rate.
DSCR
20% down · 8.5% · 30yr
- Down + closing
- —
- Monthly P&I
- —
- Monthly cashflow
- —
- DSCR
- —
- Eligible?
- —
No personal income docs; deal must DSCR.
Hard money
10% down · 12.0% · 12mo
- Down + closing
- —
- Monthly P&I
- —
- Monthly cashflow
- —
- DSCR
- —
- Eligible?
- —
Short-term bridge; refi at stabilization.
Rent comps 2 comps
| Address | Beds | Baths | Sqft | Rent | $/sqft | DOM | Units | Dist |
|---|---|---|---|---|---|---|---|---|
| 23567 Devonshire Rd Millsboro, DE | 3.0 | 2.5 | 2166 | $2,000 | $0.92 | 21d | 1 | 1.25mi |
| 22140 Shorebird Way Millsboro, DE | 4.0 | 2.5 | 1906 | $3,000 | $1.57 | 43d | 1 | 1.46mi |
Listing history 15 events
-
2026-06-18days on market $149,000 Active 22 DOM
-
2026-06-17days on market $149,000 Active 21 DOM
-
2026-06-16days on market $149,000 Active 20 DOM
-
2026-06-15days on market $149,000 Active 19 DOM
-
2026-06-14days on market $149,000 Active 17 DOM
-
2026-06-13days on market $149,000 Active 16 DOM
-
2026-06-10days on market $149,000 Active 14 DOM
-
2026-06-09days on market $149,000 Active 13 DOM
-
2026-06-08days on market $149,000 Active 12 DOM
-
2026-06-07days on market $149,000 Active 11 DOM
-
2026-06-02days on market $149,000 Active 6 DOM
-
2026-06-01days on market $149,000 Active 5 DOM
-
2026-05-31days on market $149,000 Active 4 DOM
-
2026-05-30days on market $149,000 Active 3 DOM
-
2026-05-27$149,000 Active
ⓘ Source: listings_history table (triggers on properties + properties_extension) + one-shot
backfill from property_details.listing_events for pre-trigger history.
Climate risk First Street
- Flood 6/10 Major FEMA zone X (unshaded) · 73% chance over 30 yrs
- Wildfire 1/10 Low
- Heat 8/10 Severe 7 d/yr ≥101°F today · 18 d/yr by 30 yrs out
- Wind 8/10 Severe 80% chance of damaging wind over 30 yrs
- Air quality 2/10 Low 1 unhealthy d/yr today · 1 by 30 yrs out
Nearby sold comps map
Loading sold comps map…
Walkable amenities ~0.75 mi
Loading nearby amenities…
Taxation est. · year 1
- Rental income
- $31,191
- − Mortgage interest
- −$8,346
- − Property taxes
- −$2,235
- − Insurance
- −$745
- − Repairs & maintenance
- −$2,495
- − Management
- −$2,495
- − Depreciation
- −$4,335
- Taxable income
- $10,540
- Est. tax owed @ 24.0%
- −$2,530
- After-tax cash flow
- $9,755/yr
For passive investors: Depreciation is non-cash, so a rental often shows a tax loss while cash-flowing — sheltering income. Rental losses are passive: they offset passive income freely, and up to $25,000/yr can offset ordinary (W-2) income if you actively participate and your MAGI is under $100k (phasing out to $0 by $150k); unused losses carry forward. On sale, claimed depreciation is recaptured at up to 25%, and gains may owe capital-gains tax (a 1031 exchange can defer both). Figures are a year-1 estimate at your 24.0% rate — not tax advice; consult a CPA.
Condition & rehab AI · 12 photos
This home requires moderate repairs and maintenance, with average condition overall. Painting and updating appliances and fixtures can significantly increase its resale value.
Repairs flagged
- Minor paint — paint appears faded
- Minor kitchen cabinets — slight wear
- Minor bathroom fixtures — standard fixtures
Value-add opportunities
- Resale painting — fresh paint can significantly improve curb appeal
- Resale kitchen appliances — newer appliances can attract more buyers
- Resale bathroom fixtures — upgrading fixtures can enhance the bathroom's appearance
Renovation cost estimate screening
| Repair item | Severity | Est. cost |
|---|---|---|
| paint · paint appears faded | Minor | $500–3,000 |
| kitchen cabinets · slight wear | Minor | $500–3,000 |
| bathroom fixtures · standard fixtures | Minor | $500–3,000 |
| Total estimated repair cost · 3 items | $1,500–9,000 |
Value-add ROI direction
- Resale painting — fresh paint can significantly improve curb appeal ↑
- Resale kitchen appliances — newer appliances can attract more buyers ↑
- Resale bathroom fixtures — upgrading fixtures can enhance the bathroom's appearance ↑
ⓘ Cost ranges are severity-bucket heuristics (US national rule-of-thumb). Get contractor quotes + a written scope before underwriting a rehab budget.
Schools (NCES district)
- District
- Indian River School District
- NCES district ID
- 1000680
- Math proficiency
- 25% ▼ -27.00%
- Reading proficiency
- 41% ▼ -17.00%
- Median HH income
- $53,838
- Composite
- 28.99/100
- National rank
- #6620
- State rank
- #14 of 26 in DE
Livability — Long Neck
- Score
- 69/100
- State rank
- #30
- US rank
- #8720
Category grades
Schools grade is shown separately in the Schools card above.
Census & demographics
- Census place
- Long Neck, DE
- County
- Sussex County · 82,708 people
- Metro
- Salisbury, MD-DE
- Population (ZIP)
- 35,884
- Household income
- $78,305
- Rent vs Own
- Severe rent burden
- 464.0
Population outlook (Sussex County) Hauer SSP2
- Today (2025)
- 248,853 people
- By 2030
- 264,464 · +6.3%
- By 2040
- 290,980 · +16.9%
- By 2050
- 311,259 · +25.1%
- By 2075
- 352,488 · +41.6%
- By 2100
- 367,406 · +47.6%
Race, ethnicity, and origin ACS 2023
- Neighborhood character
- Predominantly White (74%)
- Race & ethnicity
- White 74% Hispanic / Latino 11% Black 8% Two or more races 7% Native American 3% Asian 1%
- Hispanic origin (detail)
- Mexican 3%
- Common ancestry
- Romanian 4% Slovak 2% Serbian 1%
- Foreign-born
- 8% · Canada, China
- Languages at home
- 88% English-only · Spanish 9% Other Indo-European 1%
Political lean MEDSL · Sussex
- 2024 margin
- R (+11.0) · D 43.9% · R 54.9% · Other 1.2%
- 2008→2024 swing
- -2.4pp toward R · 2008: -8.6pp · 2024: -11.0pp
- All cycles
- 2024: R+11.0 2020: R+11.2 2016: R+22.0 2012: R+13.0 2008: R+8.6
Not yet ingested
- Civics
- —
Market trends
- HPI YoY
- ▼ -18.26%
- Current HPI
- 268.5609
- Rent YoY
- —
- Metro
- Salisbury, MD-DE
- State GDP YoY
- —
- F500 in state
- 0
Price history
1 event — show timeline
- 2026-05-27 Listed $149,000 BRIGHT MLS
Cash-flow waterfall
monthlySold comps — $/sqft
last 12 mo · ≤1 miLoading sold comps…