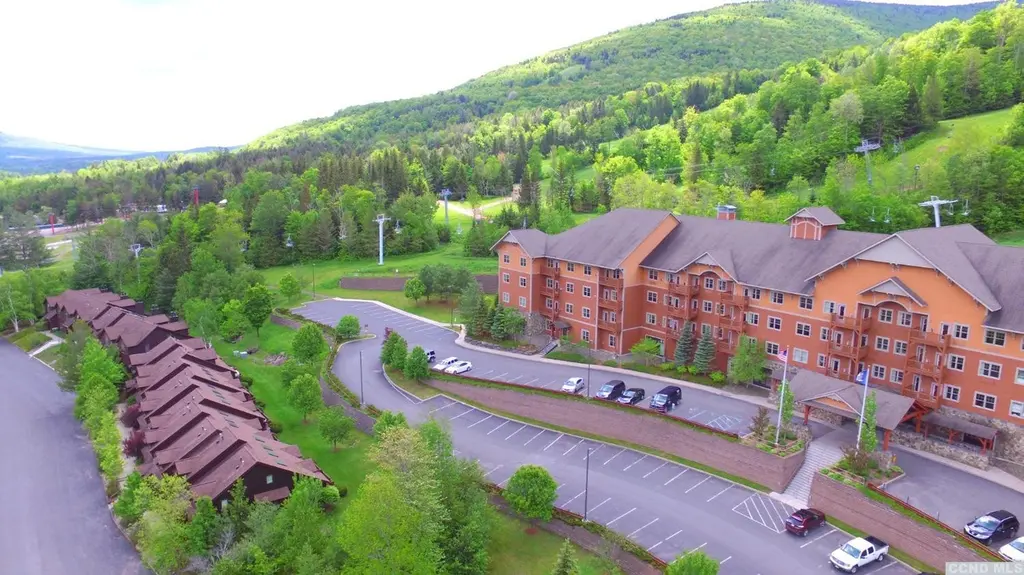
62 Liftside Dr Unit 303-Week 2 · Hunter, NY
Flood risk 1/10 · Minimal
- FEMA flood zone
- X (unshaded)
- Chance of flooding over 30 yrs
- 0.0%
- Est. flood insurance / yr
- $473 – $860
Fire risk 3/10 · Minor
- Est. fire insurance / yr
- $691 – $1,283
Heat risk 2/10 · Minimal
- Hot days now (above 87°F)
- 9 days/yr
- Hot days in 30 yrs
- 21 days/yr
Wind risk 3/10 · Minor
- Chance of severe wind over 30 yrs
- 5.0%
Air-quality risk 2/10 · Minimal
- Unhealthy air days now
- 0 days/yr
- Unhealthy air days in 30 yrs
- 1 days/yr
Risk factors via First Street. Map © Google.
Why this score? — see what drove the B grade
The composite is a weighted blend of 9 inputs, each scored 0–100. Each bar is that input's sub-score; the figure is the points it added to the 100-point composite (weight × sub-score).
- Cash flow +30.0/30.0
- 1% rule +10.0/10.0
- DSCR +10.0/10.0
- ARV discount +7.5/15.0
- Schools +4.6/10.0
- Livability +3.0/5.0
- Appreciation +2.6/10.0
- Rent growth +2.5/5.0
- Condition / age +2.2/5.0
$21,500
🖨 Deal sheet 📄 Offer letter ✓ Due diligence
Listing remarks
Right on the slopes of Hunter Mountain. The lovely Kaatskill Mountain Club. Studio deluxe model - only two of these were made. Deck and views of the ski slope. Living room with fireplace, kitchen with dining area, on premise ski locker. Heated outdoor pool, hot tubs, steam room, sauna, excellent restaurant, bar and gym for the complete get away experience. Just come and enjoy your unit - no hassle, no fuss, no need to worry about maintaining anything as the club takes care of all. 13 rotating weeks per year. Week 2. Deeded ownership so it's yours. HOA fees include utilities, wi-fi, cable and club amenities. Optional rental program and vacation exchange available. HOA fee includes utilities
Key facts
- Deck and views
- Studio deluxe model
- Heated outdoor pool
Tags
Property features AI
Finance
- HOA & community: Homeowners association with monthly fee of $238; Community clubhouse; Community fitness center
Exterior
- Utilities: Public water; Public sewer; Electric service with circuit breakers
- Home design: Condominium (attached property); Entry level: 496
- Construction: Frame and wood siding construction; Other construction materials; Concrete perimeter foundation; Asphalt roof; Built as a residential condominium
- Exterior features: Deck; Porch; Heated in-ground pool; Pool house; Secluded setting; Paved road access; Has a view
Interior
- Flooring: Carpet; Tile
- Bathrooms: 1 full bathroom
- Heating & cooling: Electric forced-air heating
- Interior features: High-speed internet
- Laundry & utility: Electric water heater
Neighborhood map
What this means for you Summary
Snapshot
- This is a 1-bed/1.0-bath condo listed at $22k. Condition is rated fair.
Deal economics
- At list price, monthly cash flow is $286 ($3k/yr) — positive.
- The deal already cash-flows at list — no discount required.
- Meets the 1% rule at list price ($851 rent vs $22k).
- Recommended offer: $21k (3.0% below list) — sets the bar for market timing.
- Cap rate 22.2% vs local median 1.6% in Hunter — top-decile yield for the area; either an underpriced asset or a hidden risk that comps aren't pricing in. Stress-test before assuming the spread holds.
Location & tenants
- Location reads 60/100 on livability (#971 in NY) — a middle-class / working-renter tenant base. Strengths: health & safety A+; Watch: housing D+, crime F, amenities F.
- Hunter-Tannersville Central School District (rural): math 55% / reading 50% proficiency, ranked #425 of 755 in NY (top 56%) — acceptable for families but not a draw, mixed tenant base, ~2y average lease.
- Market conditions: 114 active listings in the ZIP; 97 units permitted in Greene County in 2024 (0 in 5+ unit buildings).
Forward outlook
- Local home prices are declining (-3.0%/yr); year-one equity from $149 of loan paydown is wiped out by about $645 of value loss. Plan a longer hold.
- Greene County population projected at -22% by 2050 — secular population decline; favor cash flow + early exit over multi-decade hold.
- At projected returns (-3.0% appreciation + 3.0% rent growth), your $6k cash investment doubles in ~2 years — after that, you're playing with house money.
Negotiation context
- It's been on market 48 days — a 3% lower offer ($21k) is reasonable based on typical stale-listing flexibility.
Risks & watch-outs
- Watch-outs: HOA is 28% of rent.
Questions for the listing agent
- It's been on market 48 days. Have you received any prior offers? Is the seller open to a 3% concession, seller financing, or rate buy-down credit?
- Have any recent inspections been done? Can we get a copy of the seller's disclosures and any deferred-maintenance estimates?
- What does the HOA fee cover, when was the last increase, and are there any pending special assessments or reserve-fund shortfalls?
- Any open or pending special assessments — roof, HVAC, plumbing, elevator, façade? What's the per-unit balance and payoff schedule, and is the seller paying it off at close or rolling it to the buyer?
- Is there a deadline driving the sale (1031 exchange, divorce, estate, relocation)? That informs how much negotiation room exists.
- Crime grade is F in this area — have there been break-ins, vandalism, or insurance claims at this property in the last 3 years? What carrier currently insures it and at what premium?
- What's the average days-on-market for RENTAL listings here right now (not sales)? A rising rental-DOM trend means longer vacancies and softer asking-rent achievability than the comps imply.
- What's the recent tenant-quality profile in this submarket — average credit score on applications, eviction rate, late-payment / NSF rate, and stable-employment percentage? A property-management company in the area should have these aggregated.
- How much new apartment / multifamily construction is in the pipeline within 1–3 miles? Heavy new supply (>2% of stock underway) typically softens rents 12–24 months out; light construction supports rent growth.
Investment metrics
- 1% rule
- 3.96% ✓
- Cap rate
- 22.25%
- Cash-on-cash
- 56.99%
- DSCR
- 3.54
- GRM
- 2.1
CMA / ARV
- ARV (median comp)
- $233,501
- List price
- $21,500
- Delta
- -90.79%
- Verdict
- UNDERPRICED
- Comps
- 4 within 1.0 mi
Projected returns pro-forma
-3.0% appreciation · 3.0% rent growth · sell at horizon
- IRR
- 55.8%
- Equity multiple
- 3.47×
- Total profit
- $14,884
- Equity at exit
- $3,206
- IRR
- 60.9%
- Equity multiple
- 7.16×
- Total profit
- $37,053
- Equity at exit
- $1,859
Cash invested: $6,020 (down + closing). Projections, not guarantees.
Landlord ↔ Tenant lean methodology
- Overall (STATE)
- 15 Strongly Tenant-Friendly
- State New York
- 15 Strongly Tenant-Friendly · D+10
- County
- — inherits STATE
- City
- — inherits STATE
ZIP-level market 12442
- Home prices YoY
- -1.1%
- Active inventory
- 114
- Price-to-rent
- 2.1×
Monthly cashflow live
- Estimated rent
- $851 medium interval (Pro) →
- Mortgage (P&I)
- −$113
- Tax est. 1.5%
- −$27 /mo · $322/yr
- Insurance
- −$9
- HOA
- −$238
- Vacancy / Maint / Mgmt
- −$179
- Net cashflow
- $286
Break-even live
UW: 25.0% down · 7.5% · 30yr · 1.5% tax · 5.0% vac · 8.0% maint · 8.0% mgmt
Financing live
Cash to close
- Down payment
- $5,375
- Closing costs
- $645
- Reserves months
- —
- Total cash needed
- —
Loan-product check · same deal, 3 products live
Conventional
25% down · 7.5% · 30yr
- Down + closing
- —
- Monthly P&I
- —
- Monthly cashflow
- —
- DSCR
- —
- Eligible?
- —
Personal DTI + credit; lowest rate.
DSCR
20% down · 8.5% · 30yr
- Down + closing
- —
- Monthly P&I
- —
- Monthly cashflow
- —
- DSCR
- —
- Eligible?
- —
No personal income docs; deal must DSCR.
Hard money
10% down · 12.0% · 12mo
- Down + closing
- —
- Monthly P&I
- —
- Monthly cashflow
- —
- DSCR
- —
- Eligible?
- —
Short-term bridge; refi at stabilization.
HOA detail condo
- Monthly dues
- $238 · $2,856/yr
- Likely covers
- internetcablepoolgym
- Assessments
- None detected in remarks — confirm with the listing agent.
Listing history 17 events
-
2026-06-19days on market $21,500 Active 48 DOM
-
2026-06-18days on market $21,500 Active 47 DOM
-
2026-06-17days on market $21,500 Active 46 DOM
-
2026-06-16days on market $21,500 Active 45 DOM
-
2026-06-15days on market $21,500 Active 44 DOM
-
2026-06-14days on market $21,500 Active 42 DOM
-
2026-06-12days on market $21,500 Active 41 DOM
-
2026-06-09days on market $21,500 Active 38 DOM
-
2026-06-08days on market $21,500 Active 37 DOM
-
2026-06-07days on market $21,500 Active 36 DOM
-
2026-06-05days on market $21,500 Active 33 DOM
-
2026-06-03days on market $21,500 Active 32 DOM
-
2026-06-02days on market $21,500 Active 31 DOM
-
2026-06-01days on market $21,500 Active 30 DOM
-
2026-05-31days on market $21,500 Active 29 DOM
-
2026-05-30days on market $21,500 Active 28 DOM
-
2026-05-01$21,500 Active 844-char remark
ⓘ Source: listings_history table (triggers on properties + properties_extension) + one-shot
backfill from property_details.listing_events for pre-trigger history.
Climate risk First Street
- Flood 1/10 Low FEMA zone X (unshaded) · 0% chance over 30 yrs
- Wildfire 3/10 Moderate
- Heat 2/10 Low 9 d/yr ≥87°F today · 21 d/yr by 30 yrs out
- Wind 3/10 Moderate 5% chance of damaging wind over 30 yrs
- Air quality 2/10 Low 0 unhealthy d/yr today · 1 by 30 yrs out
Nearby sold comps map
Loading sold comps map…
Walkable amenities ~0.75 mi
Loading nearby amenities…
Taxation est. · year 1
- Rental income
- $10,215
- − Mortgage interest
- −$1,204
- − Property taxes
- −$322
- − Insurance
- −$108
- − Repairs & maintenance
- −$817
- − Management
- −$817
- − HOA
- −$2,856
- − Depreciation
- −$625
- Taxable income
- $3,465
- Est. tax owed @ 24.0%
- −$832
- After-tax cash flow
- $2,599/yr
For passive investors: Depreciation is non-cash, so a rental often shows a tax loss while cash-flowing — sheltering income. Rental losses are passive: they offset passive income freely, and up to $25,000/yr can offset ordinary (W-2) income if you actively participate and your MAGI is under $100k (phasing out to $0 by $150k); unused losses carry forward. On sale, claimed depreciation is recaptured at up to 25%, and gains may owe capital-gains tax (a 1031 exchange can defer both). Figures are a year-1 estimate at your 24.0% rate — not tax advice; consult a CPA.
Condition & rehab AI · 0 photos
The property is in fair condition with minor cosmetic issues that can be addressed with paint touch-ups and general cleaning. It offers a great location with ski slopes and club amenities, making it suitable for both resale and rental.
Repairs flagged
- Minor Paint touch-ups — Paint appears faded in some areas, indicating wear.
Value-add opportunities
- Both Paint touch-ups — Enhances curb appeal and interior aesthetics, improving both resale and rental value.
- Both HVAC maintenance — Ensures the HVAC system is in optimal condition, improving comfort and reducing energy costs.
Renovation cost estimate screening
| Repair item | Severity | Est. cost |
|---|---|---|
| Paint touch-ups · Paint appears faded in some areas, indicating wear. | Minor | $500–3,000 |
| Total estimated repair cost · 1 items | $500–3,000 |
Value-add ROI direction
- Both Paint touch-ups — Enhances curb appeal and interior aesthetics, improving both resale and rental value. ↑
- Both HVAC maintenance — Ensures the HVAC system is in optimal condition, improving comfort and reducing energy costs. ↑
ⓘ Cost ranges are severity-bucket heuristics (US national rule-of-thumb). Get contractor quotes + a written scope before underwriting a rehab budget.
Schools (NCES district)
- District
- Hunter-Tannersville Central School District
- NCES district ID
- 3615060
- Math proficiency
- 55% ▲ 5.00%
- Reading proficiency
- 50% ▬ 0.00%
- Median HH income
- $43,719
- Composite
- 46.19/100
- National rank
- #5442
- State rank
- #425 of 755 in NY
Livability — Hunter
- Score
- 60/100
- State rank
- #971
- US rank
- #18992
Category grades
Schools grade is shown separately in the Schools card above.
Census & demographics
- Census place
- Hunter, NY
- Population (ZIP)
- 425
Population outlook (Greene County) Hauer SSP2
- Today (2025)
- 44,963 people
- By 2030
- 43,126 · -4.1%
- By 2040
- 38,756 · -13.8%
- By 2050
- 34,913 · -22.4%
- By 2075
- 28,156 · -37.4%
- By 2100
- 22,296 · -50.4%
Race, ethnicity, and origin ACS 2023
- Neighborhood character
- Predominantly White (90%)
- Race & ethnicity
- White 90% Hispanic / Latino 8% Two or more races 2% Pacific Islander 1%
- Hispanic origin (detail)
- Puerto Rican 6%
- Common ancestry
- Romanian 15% Scotch-Irish 8% Subsaharan African 4%
- Foreign-born
- 7% · Canada
- Languages at home
- 86% English-only · Spanish 7% Russian/Polish/Slavic 4% German/W. Germanic 2%
Political lean MEDSL · Greene
- 2024 margin
- R (+17.0) · D 41.5% · R 58.5%
- 2008→2024 swing
- -7.1pp toward R · 2008: -9.9pp · 2024: -17.0pp
- All cycles
- 2024: R+17.0 2020: R+15.6 2016: R+27.4 2012: R+11.1 2008: R+9.9
Not yet ingested
- Civics
- —
Market trends
- HPI YoY
- ▼ -4.82%
- Current HPI
- 454.3942
- Rent YoY
- —
- Metro
- —
- State GDP YoY
- ▲ 2.60%
- F500 in state
- 92
Industry mix (Fortune 500 HQ in NY)
| Industry | F500 HQs | Revenue |
|---|---|---|
| Financial Services | 10 | $950B |
|
||
| Consumer Goods | 9 | $162B |
|
||
| Insurance | 4 | $225B |
|
||
| Telecommunications | 2 | $144B |
|
||
| Pharmaceuticals | 2 | $112B |
|
||
| Media / Entertainment | 2 | $69B |
|
||
Price history
1 event — show timeline
- 2026-05-01 Listed $21,500 HVCRMLS
Cash-flow waterfall
monthlySold comps — $/sqft
last 12 mo · ≤1 miLoading sold comps…