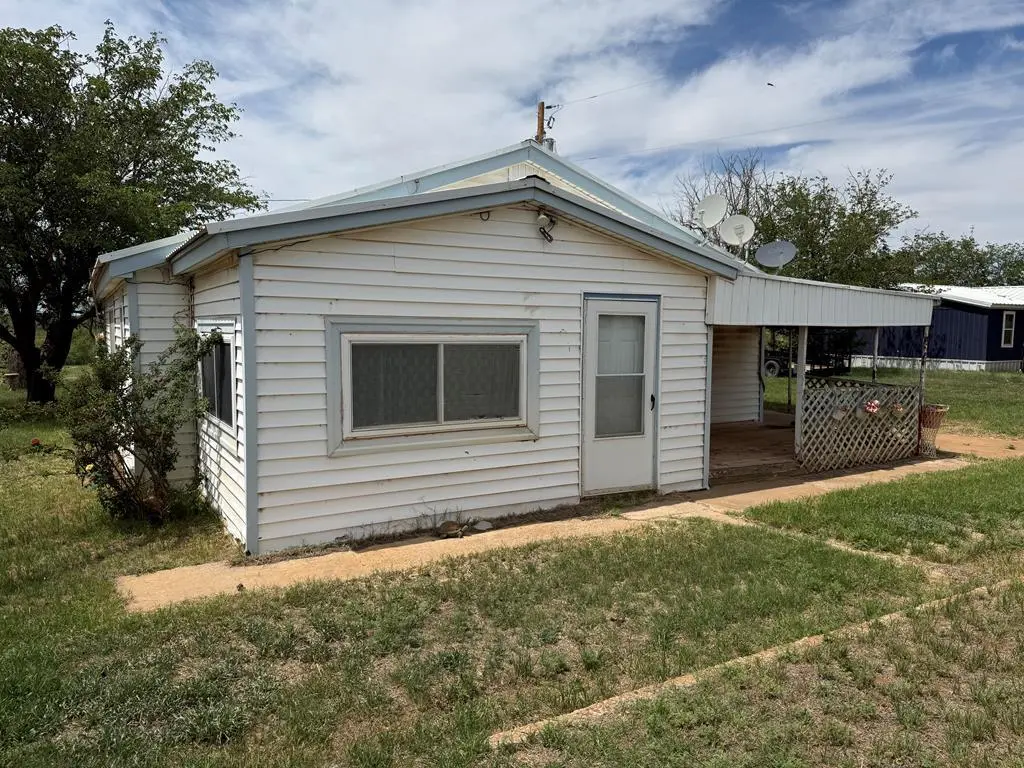
1155 Lcr 175 · Colorado City, TX
Flood risk 1/10 · Minimal
- FEMA flood zone
- —
- Chance of flooding over 30 yrs
- 0.0%
- Est. flood insurance / yr
- —
Fire risk 6/10 · Moderate
- Est. fire insurance / yr
- $1,222 – $2,270
Heat risk 6/10 · Moderate
- Hot days now (above 104°F)
- 6 days/yr
- Hot days in 30 yrs
- 17 days/yr
Wind risk 4/10 · Minor
- Chance of severe wind over 30 yrs
- 10.0%
Air-quality risk 1/10 · Minimal
- Unhealthy air days now
- 0 days/yr
- Unhealthy air days in 30 yrs
- 0 days/yr
Risk factors via First Street. Map © Google.
Why this score? — see what drove the C grade
The composite is a weighted blend of 9 inputs, each scored 0–100. Each bar is that input's sub-score; the figure is the points it added to the 100-point composite (weight × sub-score).
- Cash flow +20.5/30.0
- ARV discount +7.5/15.0
- Appreciation +7.2/10.0
- DSCR +6.5/10.0
- 1% rule +5.4/10.0
- Livability +3.5/5.0
- Schools +3.0/10.0
- Rent growth +2.5/5.0
- Condition / age +2.2/5.0
$110,000
🖨 Deal sheet 📄 Offer letter ✓ Due diligence
Listing remarks
Waterfront opportunity on Lake Champion, known for excellent bass fishing! Situated on a . 65-acre lot, this 2 bed, 2 bath lake cabin offers an oversized living room plus a bonus room perfect for an office or extra guests. Enjoy beautiful lake views, plenty of space for entertaining, a storage shed, water well, and carport. Bring your vision because this property is priced to sell and ready for updates. Park your boat by the water and enjoy lake life! Call today and let's get you in the house to enjoy your summer on the lake! 817.648.3637
Key facts
- Water well
- Lake views
- Carport
Tags
Property features AI
Exterior
- Parking: Carport with 2 spaces
- Utilities: Public water available; Well water; Private water source; Septic tank
- Home design: Single-family residence; 1 story
- Exterior features: Metal roof; Shed(s); 0.65-acre lot
Interior
- Kitchen: Electric range
- Flooring: Carpet; Vinyl
- Bathrooms: 2 full bathrooms
- Heating & cooling: Ceiling fan(s)
- Interior features: Electric range
Neighborhood map
What this means for you Summary
Snapshot
- This is a 2-bed/2.0-bath single-family listed at $110k. Condition is rated fair.
Deal economics
- At list price, monthly cash flow is $145 ($2k/yr) — positive.
- The deal already cash-flows at list — no discount required.
- Meets the 1% rule at list price ($1k rent vs $110k).
- Recommended offer: $108k (1.5% below list) — sets the bar for market timing.
Location & tenants
- Location reads 70/100 on livability (#355 in TX) — a middle-class / working-renter tenant base. Strengths: cost of living A+, housing A+, crime B+; Watch: health & safety C-, amenities F, commute F.
- Colorado ISD (town): math 37% / reading 34% proficiency, ranked #508 of 826 in TX (top 62%) — families likely to look elsewhere, expect single-tenant / working-renter base with shorter leases.
- Zoned schools: Colorado H S (math 44% / reading 44%, grade F, #652 of 1,632 statewide, top 43%, 227 students, 65% FRL).
- Market conditions: 84 active listings in the ZIP.
Forward outlook
- In year one you build about $6k of equity ($761 loan paydown + $5k appreciation (4.4% local appreciation)).
- Mitchell County population projected at +8% by 2050 — modest demand growth; plan on rents tracking national, not racing it.
- At projected returns (4.4% appreciation + 3.0% rent growth), your $31k cash investment doubles in ~4 years — after that, you're playing with house money.
- By year 7, paydown + projected appreciation supports a ~$36k cash-out refi (75% LTV) — recoverable capital for the next deal without selling this one.
Negotiation context
- It's been on market 22 days — a 2% lower offer ($108k) is reasonable based on typical stale-listing flexibility.
Risks & watch-outs
- Climate carrying-cost: major wildfire risk; extreme-heat days projected 6→17/yr by 2055 (HVAC capex compounding) — expect insurance premiums to compound above CPI over the hold.
Questions for the listing agent
- Have any recent inspections been done? Can we get a copy of the seller's disclosures and any deferred-maintenance estimates?
- Is there a deadline driving the sale (1031 exchange, divorce, estate, relocation)? That informs how much negotiation room exists.
- What's the average days-on-market for RENTAL listings here right now (not sales)? A rising rental-DOM trend means longer vacancies and softer asking-rent achievability than the comps imply.
- What's the recent tenant-quality profile in this submarket — average credit score on applications, eviction rate, late-payment / NSF rate, and stable-employment percentage? A property-management company in the area should have these aggregated.
- How much new for-sale + rental construction is in the pipeline within 1–3 miles? Heavy new supply typically softens prices + rents 12–24 months out; constrained supply supports both.
Investment metrics
- 1% rule
- 1.04% ✓
- Cap rate
- 7.87%
- Cash-on-cash
- 5.65%
- DSCR
- 1.25
- GRM
- 8.0
CMA / ARV
No comps found within radius.
Projected returns pro-forma
4.37% appreciation · 3.0% rent growth · sell at horizon
- IRR
- 16.2%
- Equity multiple
- 2.00×
- Total profit
- $30,694
- Equity at exit
- $58,179
- IRR
- 16.9%
- Equity multiple
- 3.82×
- Total profit
- $86,848
- Equity at exit
- $97,129
Cash invested: $30,800 (down + closing). Projections, not guarantees.
Landlord ↔ Tenant lean methodology
- Overall (STATE)
- 87 Strongly Landlord-Friendly
- State Texas
- 87 Strongly Landlord-Friendly · R+5
- County
- — inherits STATE
- City
- — inherits STATE
ZIP-level market 79512
- Home prices YoY
- 4.6%
- Active inventory
- 84
- Price-to-rent
- 8.0×
Monthly cashflow live
- Estimated rent
- $1,146 medium interval (Pro) →
- Mortgage (P&I)
- −$577
- Tax est. 1.5%
- −$138 /mo · $1,650/yr
- Insurance
- −$46
- HOA
- −$0
- Vacancy / Maint / Mgmt
- −$241
- Net cashflow
- $145
Break-even live
UW: 25.0% down · 7.5% · 30yr · 1.5% tax · 5.0% vac · 8.0% maint · 8.0% mgmt
Financing live
Cash to close
- Down payment
- $27,500
- Closing costs
- $3,300
- Reserves months
- —
- Total cash needed
- —
Loan-product check · same deal, 3 products live
Conventional
25% down · 7.5% · 30yr
- Down + closing
- —
- Monthly P&I
- —
- Monthly cashflow
- —
- DSCR
- —
- Eligible?
- —
Personal DTI + credit; lowest rate.
DSCR
20% down · 8.5% · 30yr
- Down + closing
- —
- Monthly P&I
- —
- Monthly cashflow
- —
- DSCR
- —
- Eligible?
- —
No personal income docs; deal must DSCR.
Hard money
10% down · 12.0% · 12mo
- Down + closing
- —
- Monthly P&I
- —
- Monthly cashflow
- —
- DSCR
- —
- Eligible?
- —
Short-term bridge; refi at stabilization.
Listing history 14 events
-
2026-06-18days on market $110,000 Active 22 DOM
-
2026-06-17days on market $110,000 Active 21 DOM
-
2026-06-16days on market $110,000 Active 20 DOM
-
2026-06-15days on market $110,000 Active 19 DOM
-
2026-06-13days on market $110,000 Active 17 DOM
-
2026-06-12days on market $110,000 Active 16 DOM
-
2026-06-09days on market $110,000 Active 13 DOM
-
2026-06-08days on market $110,000 Active 12 DOM
-
2026-06-08days on market $110,000 Active 11 DOM
-
2026-06-05days on market $110,000 Active 9 DOM
-
2026-06-03days on market $110,000 Active 7 DOM
-
2026-06-02days on market $110,000 Active 6 DOM
-
2026-06-01days on market $110,000 Active 5 DOM
-
2026-05-31days on market $110,000 Active 4 DOM
ⓘ Source: listings_history table (triggers on properties + properties_extension) + one-shot
backfill from property_details.listing_events for pre-trigger history.
Climate risk First Street
- Flood 1/10 Low 0% chance over 30 yrs
- Wildfire 6/10 Major
- Heat 6/10 Major 6 d/yr ≥104°F today · 17 d/yr by 30 yrs out
- Wind 4/10 Moderate 10% chance of damaging wind over 30 yrs
- Air quality 1/10 Low 0 unhealthy d/yr today · 0 by 30 yrs out
Nearby sold comps map
Loading sold comps map…
Walkable amenities ~0.75 mi
Loading nearby amenities…
Taxation est. · year 1
- Rental income
- $13,749
- − Mortgage interest
- −$6,162
- − Property taxes
- −$1,650
- − Insurance
- −$550
- − Repairs & maintenance
- −$1,100
- − Management
- −$1,100
- − Depreciation
- −$3,200
- Taxable loss
- −$13
- Est. tax savings @ 24.0%
- +$3
- After-tax cash flow
- $1,742/yr
For passive investors: Depreciation is non-cash, so a rental often shows a tax loss while cash-flowing — sheltering income. Rental losses are passive: they offset passive income freely, and up to $25,000/yr can offset ordinary (W-2) income if you actively participate and your MAGI is under $100k (phasing out to $0 by $150k); unused losses carry forward. On sale, claimed depreciation is recaptured at up to 25%, and gains may owe capital-gains tax (a 1031 exchange can defer both). Figures are a year-1 estimate at your 24.0% rate — not tax advice; consult a CPA.
Condition & rehab AI · 12 photos
This home requires significant updates to its exterior, interior, and systems to improve its condition and value. Potential buyers should be aware of the extensive work needed.
Repairs flagged
- Major siding — Significant wear and tear
- Major roof — Weathered and potentially leaking
- Major flooring — Worn and outdated
- Major interior walls — Peeling paint and outdated wood paneling
- Major bathrooms — Outdated fixtures and small space
- Major kitchen — Outdated cabinets and small space
- Major systems — Ceiling fans and outdated lighting
Value-add opportunities
- Resale new siding — Enhances curb appeal and durability
- Resale new roof — Fixes potential leaks and enhances durability
- Resale new flooring — Updates the look and feel of the home
- Resale new interior walls — Updates the look and feel of the home
- Resale new bathrooms — Expands space and enhances functionality
- Resale new kitchen — Expands space and enhances functionality
- Resale new systems — Updates the look and feel of the home
Renovation cost estimate screening
| Repair item | Severity | Est. cost |
|---|---|---|
| siding · Significant wear and tear | Major | $15,000–50,000 |
| roof · Weathered and potentially leaking | Major | $15,000–50,000 |
| flooring · Worn and outdated | Major | $15,000–50,000 |
| interior walls · Peeling paint and outdated wood paneling | Major | $15,000–50,000 |
| bathrooms · Outdated fixtures and small space | Major | $15,000–50,000 |
| kitchen · Outdated cabinets and small space | Major | $15,000–50,000 |
| systems · Ceiling fans and outdated lighting | Major | $15,000–50,000 |
| Total estimated repair cost · 7 items | $105,000–350,000 |
Value-add ROI direction
- Resale new siding — Enhances curb appeal and durability ↑
- Resale new roof — Fixes potential leaks and enhances durability ↑
- Resale new flooring — Updates the look and feel of the home ↑
- Resale new interior walls — Updates the look and feel of the home ↑
- Resale new bathrooms — Expands space and enhances functionality ↑
- Resale new kitchen — Expands space and enhances functionality ↑
- Resale new systems — Updates the look and feel of the home ↑
ⓘ Cost ranges are severity-bucket heuristics (US national rule-of-thumb). Get contractor quotes + a written scope before underwriting a rehab budget.
Schools (NCES district)
- District
- Colorado ISD
- NCES district ID
- 4814640
- Math proficiency
- 37% ▼ -8.00%
- Reading proficiency
- 34% ▼ -4.00%
- Median HH income
- $46,054
- Composite
- 30.41/100
- National rank
- #6249
- State rank
- #508 of 826 in TX
Livability — Colorado City
- Score
- 70/100
- State rank
- #355
- US rank
- #7722
Category grades
Schools grade is shown separately in the Schools card above.
Census & demographics
- Population (ZIP)
- 7,672
Population outlook (Mitchell County) Hauer SSP2
- Today (2025)
- 8,476 people
- By 2030
- 8,723 · +2.9%
- By 2040
- 9,046 · +6.7%
- By 2050
- 9,200 · +8.5%
- By 2075
- 8,936 · +5.4%
- By 2100
- 7,978 · -5.9%
Race, ethnicity, and origin ACS 2023
- Neighborhood character
- Diverse neighborhood (Simpson 0.64)
- Race & ethnicity
- White 47% Hispanic / Latino 37% Two or more races 20% Black 6% Asian 2%
- Hispanic origin (detail)
- Mexican 34%
- Common ancestry
- Serbian 2% Lithuanian 1% Slovak 1%
- Foreign-born
- 3% · Canada
- Languages at home
- 80% English-only · Spanish 18% Tagalog/Filipino 1%
Political lean MEDSL · Mitchell
- 2024 margin
- Solid R (+71.3) · D 14.0% · R 85.3%
- 2008→2024 swing
- -20.8pp toward R · 2008: -50.5pp · 2024: -71.3pp
- All cycles
- 2024: R+71.3 2020: R+68.8 2016: R+65.2 2012: R+52.7 2008: R+50.5
Not yet ingested
- Civics
- —
Market trends
- HPI YoY
- ▲ 4.37%
- Current HPI
- 99.8822
- Rent YoY
- —
- Metro
- —
- State GDP YoY
- ▲ 3.95%
- F500 in state
- 110
Industry mix (Fortune 500 HQ in TX)
| Industry | F500 HQs | Revenue |
|---|---|---|
| Energy | 16 | $1,198B |
|
||
| Technology | 5 | $198B |
|
||
| Engineering / Construction | 4 | $72B |
|
||
| Energy Services | 3 | $60B |
|
||
| Utilities | 3 | $41B |
|
||
| Healthcare | 2 | $330B |
|
||
Price history
1 event — show timeline
- 2026-05-27 Listed $110,000 PBBOR
Cash-flow waterfall
monthlySold comps — $/sqft
last 12 mo · ≤1 miLoading sold comps…