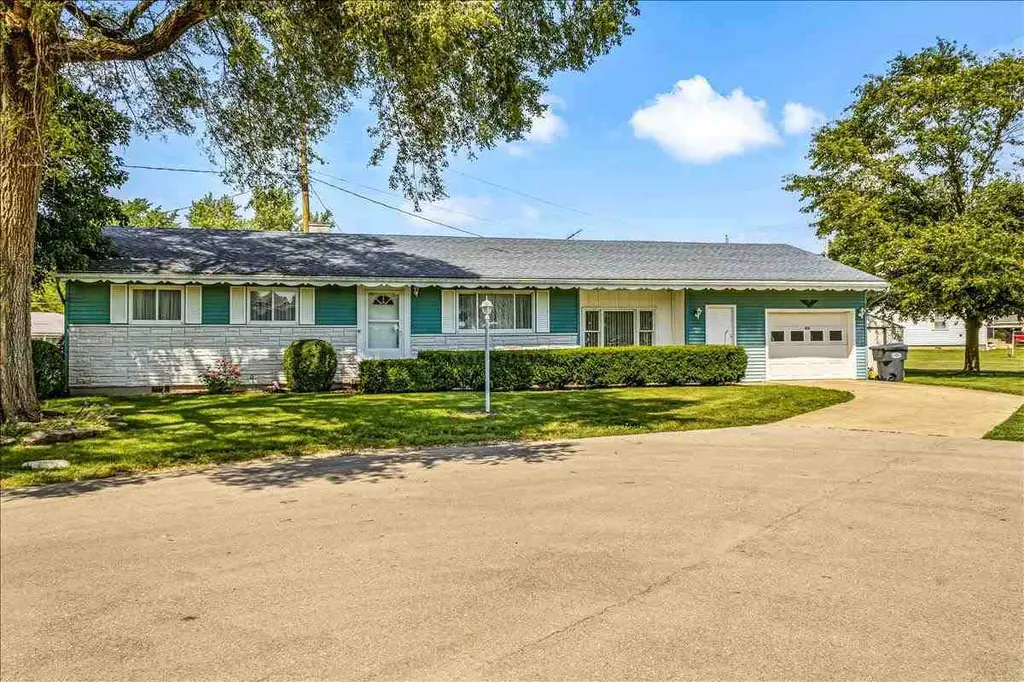
410 Cedar Ct · Union City, IN
Flood risk 1/10 · Minimal
- FEMA flood zone
- X (unshaded)
- Chance of flooding over 30 yrs
- 0.0%
- Est. flood insurance / yr
- $507 – $1,088
Fire risk 1/10 · Minimal
- Est. fire insurance / yr
- $717 – $1,331
Heat risk 3/10 · Minor
- Hot days now (above 100°F)
- 7 days/yr
- Hot days in 30 yrs
- 18 days/yr
Wind risk 2/10 · Minimal
- Chance of severe wind over 30 yrs
- 1.0%
Air-quality risk 3/10 · Minor
- Unhealthy air days now
- 2 days/yr
- Unhealthy air days in 30 yrs
- 3 days/yr
Risk factors via First Street. Map © Google.
Why this score? — see what drove the C- grade
The composite is a weighted blend of 9 inputs, each scored 0–100. Each bar is that input's sub-score; the figure is the points it added to the 100-point composite (weight × sub-score).
- Cash flow +15.5/30.0
- ARV discount +10.5/15.0
- Appreciation +10.0/10.0
- DSCR +4.8/10.0
- 1% rule +3.4/10.0
- Livability +3.2/5.0
- Rent growth +2.5/5.0
- Schools +2.5/10.0
- Condition / age +2.5/5.0
$139,900
🖨 Deal sheet 📄 Offer letter ✓ Due diligence
Listing remarks MLS
Located in Union City, this 3-bedroom, 1.5-bath home offers a functional and comfortable layout. The spacious front living room provides easy hallway access to all three bedrooms and the full bath. An open-concept dining room and kitchen flow seamlessly from the living area, complemented by a second living space filled with natural light from a large window. A half bath with utilities sits just off the kitchen, along with a door leading to the open back deck. The attached 1-car garage includes attic stairs for additional storage.
Key facts
- Second living space
- Attached garage
- Natural light
Tags
Property features AI
Finance
- Other: Residential property; Subdivision: None
Exterior
- Parking: Attached garage; Concrete and off-street parking; 1 garage space
- Utilities: Public water; Public sewer
- Home design: Single-family, site-built home; One story
- Construction: Vinyl siding; Asphalt shingle roof; Slab foundation; Built area above grade: 1,293 (value provided)
- Exterior features: Deck; No fencing; Shed(s); Located on a cul-de-sac; Lot approximately 69 x 91 (0.14 acre)
Interior
- Kitchen: No specific kitchen appliances listed
- Bedrooms: Total of 10 rooms (bedroom count not specified)
- Flooring: Carpet; Vinyl
- Bathrooms: 1 full bathroom; 1 half bathroom; 2 main-level bathrooms
- Heating & cooling: Natural gas forced-air heating; Central air conditioning
- Interior features: Gas water heater; Water heater (additional); One fireplace; Crawl space basement
- Laundry & utility: Electric dryer hookup on the main level
Neighborhood map
What this means for you Summary
Snapshot
- This is a 3-bed/1.0-bath single-family listed at $140k.
Deal economics
- At list price, monthly cash flow is $57 ($684/yr) — positive.
- The deal already cash-flows at list — no discount required.
- To meet the 1% rule (rent ≥ 1% of price), the offer needs to be $117k (16.4% below list).
- Recommended offer: $117k (16.4% below list) — sets the bar for 1% rule.
Location & tenants
- Location reads 63/100 on livability (#432 in IN) — a middle-class / working-renter tenant base. Strengths: cost of living A+, housing A+, crime A-; Watch: health & safety C-, amenities F, commute F.
- Randolph Eastern School Corporation (town): math 29% / reading 31% proficiency, ranked #246 of 301 in IN (top 82%) — families likely to look elsewhere, expect single-tenant / working-renter base with shorter leases.
- Zoned schools: North Side Elementary School (math 46% / reading 27%, grade F, #571 of 994 statewide, top 58%, 561 students, 72% FRL); Union City Community Jr/Sr High (math 9% / reading 36%, grade F, #337 of 369 statewide, top 92%, 367 students, 67% FRL) — zoned schools average 70% FRL vs 54% district-wide (15 pts higher); higher-poverty schools than district average — tighter screening recommended.
- Market conditions: 35 active listings in the ZIP; 19 units permitted in Randolph County in 2024 (0 in 5+ unit buildings).
Forward outlook
- In year one you build about $15k of equity ($967 loan paydown + $14k appreciation (10.0% local appreciation)).
- Randolph County population projected at -26% by 2050 — secular population decline; favor cash flow + early exit over multi-decade hold.
- At projected returns (10.0% appreciation + 3.0% rent growth), your $39k cash investment doubles in ~3 years — after that, you're playing with house money.
- By year 3, paydown + projected appreciation supports a ~$38k cash-out refi (75% LTV) — recoverable capital for the next deal without selling this one.
Negotiation context
- Only 6 days on market — expect competitive offers; lowballing is unlikely to land.
- 2 sale attempts with the ask held roughly flat each time — persistent listings suggest the price (not the market) is what's stuck; bring a comps-based counter.
Questions for the listing agent
- Built in 1960 — when were the roof, HVAC, electrical panel, plumbing, and water heater last replaced?
- Is there a deadline driving the sale (1031 exchange, divorce, estate, relocation)? That informs how much negotiation room exists.
- Schools are D-rated, which usually means shorter tenancies and higher turnover. Who's the typical renter profile here, and what's been the actual vacancy rate?
- What's the average days-on-market for RENTAL listings here right now (not sales)? A rising rental-DOM trend means longer vacancies and softer asking-rent achievability than the comps imply.
- What's the recent tenant-quality profile in this submarket — average credit score on applications, eviction rate, late-payment / NSF rate, and stable-employment percentage? A property-management company in the area should have these aggregated.
- How much new for-sale + rental construction is in the pipeline within 1–3 miles? Heavy new supply typically softens prices + rents 12–24 months out; constrained supply supports both.
Investment metrics
- 1% rule
- 0.84% ✗
- Cap rate
- 6.78%
- Cash-on-cash
- 1.75%
- DSCR
- 1.08
- GRM
- 10.0
CMA / ARV
- ARV (on-the-fly)
- $149,988
- Comps found
- 8
Show comp detail 8 sales within ~0.75 mi
| Address | Dist | Beds/Ba | Sqft | Sold | Price | $/sf | Match |
|---|---|---|---|---|---|---|---|
| 1229 N Plum St | 0.18mi | 3/1.0 | 1,346 (+4%) | 6mo | $119,000 | $88 | 80 |
| 522 Royale Dr | 0.30mi | 3/1.5 | 1,304 (+1%) | 6mo | $137,100 | $105 | 78 |
| 504 Leahey St | 0.11mi | 3/2.0 | 1,186 (-8%) | 2mo | $205,000 | $173 | 76 |
| 600 Glynn Ellen Dr | 0.35mi | 3/1.5 | 1,418 (+10%) | 0mo | $165,000 | $116 | 65 |
| 744 N Howard St | 0.33mi | 3/2.0 | 1,461 (+13%) | 2mo | $189,900 | $130 | 58 |
| 510 Royale Dr | 0.23mi | 3/1.0 | 1,134 (-12%) | 18mo | $119,900 | $106 | 54 |
| 384 Chatham Ct | 0.31mi | 3/2.0 | 1,452 (+12%) | 9mo | $190,000 | $131 | 53 |
| 942 W Division St | 0.63mi | 3/1.0 | 1,474 (+14%) | 20mo | $140,000 | $95 | 31 |
Match score weights: distance 35% · size 25% · config 20% · recency 20%. Top-matched comps best support the ARV.
Projected returns pro-forma
10.0% appreciation · 3.0% rent growth · sell at horizon
- IRR
- 25.5%
- Equity multiple
- 3.04×
- Total profit
- $79,781
- Equity at exit
- $126,033
- IRR
- 22.5%
- Equity multiple
- 6.92×
- Total profit
- $231,998
- Equity at exit
- $271,795
Cash invested: $39,172 (down + closing). Projections, not guarantees.
Landlord ↔ Tenant lean methodology
- Overall (STATE)
- 90 Strongly Landlord-Friendly
- State Indiana
- 90 Strongly Landlord-Friendly · R+11
- County
- — inherits STATE
- City
- — inherits STATE
ZIP-level market 47390
- Home prices YoY
- 9.1%
- Active inventory
- 35
- Price-to-rent
- 10.0×
Monthly cashflow live
- Estimated rent
- $1,169 medium interval (Pro) →
- Mortgage (P&I)
- −$734
- Tax from tax record
- −$75 /mo · $898/yr
- Insurance
- −$58
- HOA
- −$0
- Vacancy / Maint / Mgmt
- −$246
- Net cashflow
- $57
Break-even live
UW: 25.0% down · 7.5% · 30yr · 1.5% tax · 5.0% vac · 8.0% maint · 8.0% mgmt
Financing live
Cash to close
- Down payment
- $34,975
- Closing costs
- $4,197
- Reserves months
- —
- Total cash needed
- —
Loan-product check · same deal, 3 products live
Conventional
25% down · 7.5% · 30yr
- Down + closing
- —
- Monthly P&I
- —
- Monthly cashflow
- —
- DSCR
- —
- Eligible?
- —
Personal DTI + credit; lowest rate.
DSCR
20% down · 8.5% · 30yr
- Down + closing
- —
- Monthly P&I
- —
- Monthly cashflow
- —
- DSCR
- —
- Eligible?
- —
No personal income docs; deal must DSCR.
Hard money
10% down · 12.0% · 12mo
- Down + closing
- —
- Monthly P&I
- —
- Monthly cashflow
- —
- DSCR
- —
- Eligible?
- —
Short-term bridge; refi at stabilization.
Listing history 6 events
-
2026-06-18days on market $139,900 Active 6 DOM
-
2026-06-17days on market $139,900 Active 5 DOM
-
2026-06-16days on market $139,900 Active 4 DOM
-
2026-06-15days on market $139,900 Active 3 DOM
-
2026-06-12remarks 535-char remark
-
2026-06-12$139,900 Active 1 DOM
ⓘ Source: listings_history table (triggers on properties + properties_extension) + one-shot
backfill from property_details.listing_events for pre-trigger history.
Tax reassessment forecast IN · Partial reset (capped growth)
- Current annual tax
- $898 · $75/mo
- Projected year-2 tax
- $1,043 · $87/mo
- Expected delta
- +$146/yr (+$12/mo · 16.2%)
ⓘ Screening estimate from a state-policy table — verify with the county assessor before closing.
Climate risk First Street
- Flood 1/10 Low FEMA zone X (unshaded) · 0% chance over 30 yrs
- Wildfire 1/10 Low
- Heat 3/10 Moderate 7 d/yr ≥100°F today · 18 d/yr by 30 yrs out
- Wind 2/10 Low 100% chance of damaging wind over 30 yrs
- Air quality 3/10 Moderate 2 unhealthy d/yr today · 3 by 30 yrs out
Nearby sold comps map
Loading sold comps map…
Walkable amenities ~0.75 mi
Loading nearby amenities…
Taxation est. · year 1
- Rental income
- $14,032
- − Mortgage interest
- −$7,837
- − Property taxes
- −$898
- − Insurance
- −$700
- − Repairs & maintenance
- −$1,123
- − Management
- −$1,123
- − Depreciation
- −$4,070
- Taxable loss
- −$1,717
- Est. tax savings @ 24.0%
- +$412
- After-tax cash flow
- $1,096/yr
For passive investors: Depreciation is non-cash, so a rental often shows a tax loss while cash-flowing — sheltering income. Rental losses are passive: they offset passive income freely, and up to $25,000/yr can offset ordinary (W-2) income if you actively participate and your MAGI is under $100k (phasing out to $0 by $150k); unused losses carry forward. On sale, claimed depreciation is recaptured at up to 25%, and gains may owe capital-gains tax (a 1031 exchange can defer both). Figures are a year-1 estimate at your 24.0% rate — not tax advice; consult a CPA.
Schools (NCES district)
- District
- Randolph Eastern School Corporation
- NCES district ID
- 1803180
- Math proficiency
- 29% ▼ -15.00%
- Reading proficiency
- 31% ▼ -15.00%
- Median HH income
- $36,652
- Composite
- 24.92/100
- National rank
- #7570
- State rank
- #246 of 301 in IN
Livability — Union City
- Score
- 63/100
- State rank
- #432
- US rank
- #15530
Category grades
Schools grade is shown separately in the Schools card above.
Census & demographics
- Census place
- Union City, IN
- Population (ZIP)
- 5,084
Population outlook (Randolph County) Hauer SSP2
- Today (2025)
- 22,998 people
- By 2030
- 21,815 · -5.1%
- By 2040
- 19,360 · -15.8%
- By 2050
- 17,010 · -26.0%
- By 2075
- 12,491 · -45.7%
- By 2100
- 8,986 · -60.9%
Race, ethnicity, and origin ACS 2023
- Neighborhood character
- Predominantly White (79%)
- Race & ethnicity
- White 79% Hispanic / Latino 15% Two or more races 9% Black 3%
- Hispanic origin (detail)
- Mexican 10%
- Common ancestry
- Romanian 3% Portuguese 2% Italian 1%
- Foreign-born
- 6% · Canada, South Korea, Guatemala
- Languages at home
- 88% English-only · Spanish 10% Korean 1% Other Indo-European 1%
Political lean MEDSL · Randolph
- 2024 margin
- Solid R (+53.7) · D 22.3% · R 75.9% · Other 1.8%
- 2008→2024 swing
- -44.9pp toward R · 2008: -8.8pp · 2024: -53.7pp
- All cycles
- 2024: R+53.7 2020: R+52.4 2016: R+48.5 2012: R+24.1 2008: R+8.8
Not yet ingested
- Civics
- —
Market trends
- HPI YoY
- ▲ 22.82%
- Current HPI
- 273.6736
- Rent YoY
- —
- Metro
- —
- State GDP YoY
- ▲ 2.90%
- F500 in state
- 18
Industry mix (Fortune 500 HQ in IN)
| Industry | F500 HQs | Revenue |
|---|---|---|
| Industrial Machinery | 2 | $37B |
|
||
| Healthcare | 1 | $177B |
|
||
| Pharmaceuticals | 1 | $45B |
|
||
| Metals / Steel | 1 | $18B |
|
||
| Agriculture | 1 | $17B |
|
||
| Packaging | 1 | $12B |
|
||
Price history
+0.0% since first listed2 events — show timeline
- 2026-06-10 Listed $139,900 RRELMS
- 2026-06-10 Listed $139,900 IRMLS
Property tax history
+34.7%/yrLatest (2024): $898 · +7.5% YoY. Source: county tax records.
Cash-flow waterfall
monthlySold comps — $/sqft
last 12 mo · ≤1 miLoading sold comps…