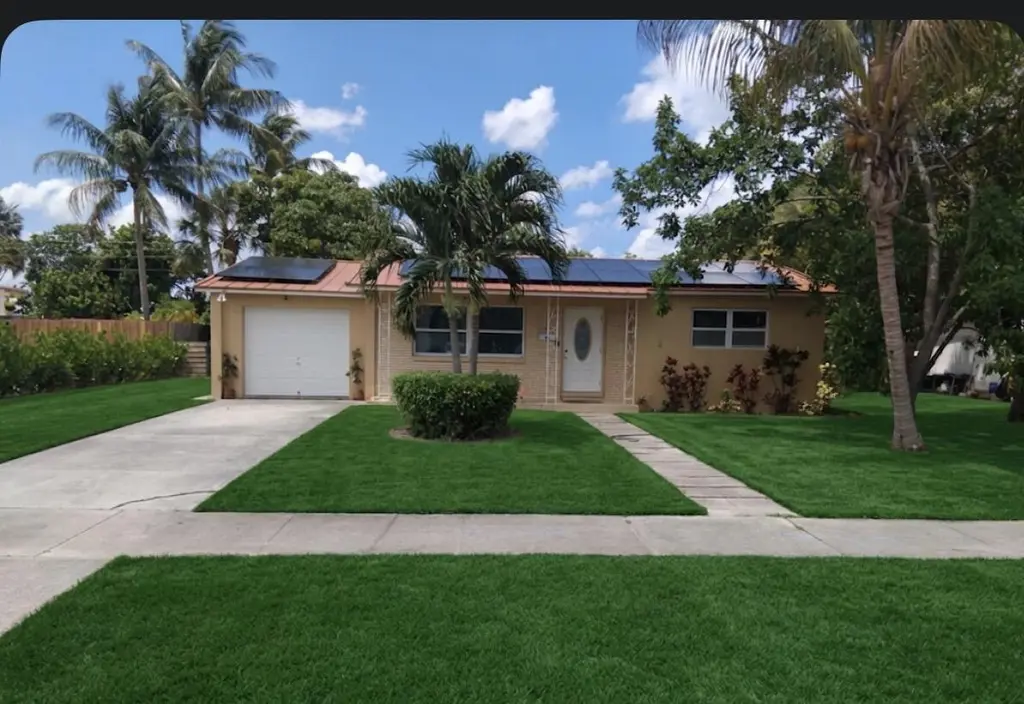
729 Ilex Ct · Lake Park, FL
Flood risk 1/10 · Minimal
- FEMA flood zone
- X (unshaded)
- Chance of flooding over 30 yrs
- 0.0%
- Est. flood insurance / yr
- $507 – $1,088
Fire risk 1/10 · Minimal
- Est. fire insurance / yr
- $947 – $1,759
Heat risk 10/10 · Severe
- Hot days now (above 106°F)
- 7 days/yr
- Hot days in 30 yrs
- 24 days/yr
Wind risk 10/10 · Severe
- Chance of severe wind over 30 yrs
- 99.0%
Air-quality risk 2/10 · Minimal
- Unhealthy air days now
- 0 days/yr
- Unhealthy air days in 30 yrs
- 1 days/yr
Risk factors via First Street. Map © Google.
Why this score? — see what drove the C grade
The composite is a weighted blend of 9 inputs, each scored 0–100. Each bar is that input's sub-score; the figure is the points it added to the 100-point composite (weight × sub-score).
- Cash flow +17.5/30.0
- ARV discount +15.0/15.0
- DSCR +5.5/10.0
- 1% rule +5.4/10.0
- Schools +4.3/10.0
- Rent growth +4.0/5.0
- Livability +3.4/5.0
- Condition / age +2.5/5.0
- Appreciation +0.0/10.0
$480,000
🖨 Deal sheet 📄 Offer letter ✓ Due diligence
Listing remarks
Discover this spacious 4-bedroom, 2-bathroom gem tucked away on a quiet cul-de-sac in the heart of the 33403 area. Spanning over 1,750 sq. ft. , this home offers the perfect blend of indoor-outdoor Florida living. The open-concept layout flows naturally toward a large, fenced backyard—your private oasis for weekend BBQs or morning coffee. Located just minutes from the vibrant Kelsey Park and the small-town charm of Park Avenue's shops and dining, you're also a short drive from the pristine sands of Singer Island and Peanut Island. With a generous lot size and a detached feel, this is the perfect canvas to create your dream South Florida lifestyle. No HOA means freedom to bring your bo
Key facts
- Detached feel
- Private oasis
- Cul-de-sac
Tags
Property features AI
Finance
- Other: Oversized lot; City street frontage; Asphalt road surface; Not waterfront
Exterior
- Parking: Attached garage (1 space); Covered parking (1 space); Driveway with additional open parking (total parking listed as 4 spaces)
- Utilities: Public water; Public sewer; Natural gas connected; Cable available; Phone available; Water connected
- Home design: Single-family residence; One story; South-facing; Resale property; Solar panels
- Construction: Built with block, brick, and stucco (CBS); Metal roof; Slab foundation; Living area approximately 1,754 sq ft; Total building area approximately 2,162 sq ft
- Exterior features: Front porch; Fenced backyard
Interior
- Kitchen: Dishwasher (ENERGY STAR qualified); Electric range; Microwave; Refrigerator (ENERGY STAR qualified)
- Bedrooms: One main-level bedroom
- Flooring: Tile
- Bathrooms: Two full bathrooms (one on the main level)
- Heating & cooling: Central heating; Central air; Ceiling fans
- Interior features: Kitchen island; Storm windows
- Laundry & utility: In-unit washer and dryer (ENERGY STAR qualified dryer and washer)
Neighborhood map
What this means for you Summary
Snapshot
- This is a 4-bed/3.0-bath single-family listed at $480k.
Deal economics
- At list price, monthly cash flow is $371 ($4k/yr) — positive.
- The deal already cash-flows at list — no discount required.
- Meets the 1% rule at list price ($5k rent vs $480k).
- Recommended offer: $473k (1.5% below list) — sets the bar for market timing.
Location & tenants
- Location reads 67/100 on livability (#542 in FL) — a middle-class / working-renter tenant base. Strengths: housing A+, health & safety A+, cost of living A-; Watch: crime F, amenities F, commute F.
- Palm Beach (suburban): math 46% / reading 53% proficiency, ranked #34 of 73 in FL (top 47%) — families likely to look elsewhere, expect single-tenant / working-renter base with shorter leases.
- Zoned schools: Lake Park Elementary School (math 57% / reading 62%, grade B-, #690 of 2,144 statewide, top 34%, 389 students, 83% FRL); Howell L. Watkins Middle School (math 18% / reading 33%, grade F, #512 of 571 statewide, top 90%, 794 students, 76% FRL); Palm Beach Gardens High School (math 19% / reading 40%, grade F, #447 of 667 statewide, top 68%, 2,570 students, 61% FRL) — zoned schools average 74% FRL vs 52% district-wide (22 pts higher); higher-poverty schools than district average — tighter screening recommended.
- Market conditions: Rents rising fast (+6.0%/yr); 134 active listings in the ZIP; 22 comparable units currently listed for rent nearby; rentals at typical pace (median 24d on market — plan ~3-4 weeks tenant-placement turnaround); 3,974 units permitted in Palm Beach County in 2024 (1,012 in 5+ unit buildings).
- At $4,980/mo this rent would consume 85% of the median local household income ($71k/yr) (locally 903% of renters already pay >50% of income on rent) — very limited rent-growth headroom before tenants either downsize or default.
Forward outlook
- Local home prices are declining (-3.0%/yr); year-one equity from $3k of loan paydown is wiped out by about $14k of value loss. Plan a longer hold.
- Palm Beach County population projected at +30% by 2050 — long-run rental-demand tailwind backs the buy-and-hold thesis.
Negotiation context
- It's been on market 27 days — a 2% lower offer ($473k) is reasonable based on typical stale-listing flexibility.
- Current owner paid $127k; list at $480k implies a 278% gain — meaningful room to come down on a strong offer.
Risks & watch-outs
- Watch-outs: built in 1957 — expect roof / HVAC / electrical / plumbing capex.
- Climate carrying-cost: severe wind risk, 99% chance of damaging wind over 30y; extreme-heat days projected 7→24/yr by 2055 (HVAC capex compounding) — expect insurance premiums to compound above CPI over the hold.
Questions for the listing agent
- Built in 1957 — when were the roof, HVAC, electrical panel, plumbing, and water heater last replaced?
- Is there a deadline driving the sale (1031 exchange, divorce, estate, relocation)? That informs how much negotiation room exists.
- Schools are B-rated — typically a magnet for longer-tenancy family renters. What's the average tenant stay here, and is there a school-zone premium baked into asking?
- Crime grade is F in this area — have there been break-ins, vandalism, or insurance claims at this property in the last 3 years? What carrier currently insures it and at what premium?
- What's the average days-on-market for RENTAL listings here right now (not sales)? A rising rental-DOM trend means longer vacancies and softer asking-rent achievability than the comps imply.
- What's the recent tenant-quality profile in this submarket — average credit score on applications, eviction rate, late-payment / NSF rate, and stable-employment percentage? A property-management company in the area should have these aggregated.
- How much new for-sale + rental construction is in the pipeline within 1–3 miles? Heavy new supply typically softens prices + rents 12–24 months out; constrained supply supports both.
Investment metrics
- 1% rule
- 1.04% ✓
- Cap rate
- 7.22%
- Cash-on-cash
- 3.32%
- DSCR
- 1.15
- GRM
- 8.0
CMA / ARV
- ARV (on-the-fly)
- $617,408
- Comps found
- 1
Show comp detail 1 sale within ~0.75 mi
| Address | Dist | Beds/Ba | Sqft | Sold | Price | $/sf | Match |
|---|---|---|---|---|---|---|---|
| 830 Seminole Blvd | 0.23mi | 3/2.5 (-1) | 1,700 (-3%) | 14mo | $599,000 | $352 | 66 |
Match score weights: distance 35% · size 25% · config 20% · recency 20%. Top-matched comps best support the ARV.
Projected returns pro-forma
-3.0% appreciation · 5.97% rent growth · sell at horizon
- IRR
- -7.5%
- Equity multiple
- 0.71×
- Total profit
- $-38,584
- Equity at exit
- $71,570
- IRR
- 5.7%
- Equity multiple
- 1.48×
- Total profit
- $64,608
- Equity at exit
- $41,502
Cash invested: $134,400 (down + closing). Projections, not guarantees.
Landlord ↔ Tenant lean methodology
- Overall (STATE)
- 87 Strongly Landlord-Friendly
- State Florida
- 87 Strongly Landlord-Friendly · R+3
- County
- — inherits STATE
- City
- — inherits STATE
ZIP-level market 33403
- Home prices YoY
- -19.6%
- Rents YoY
- 6.0%
- Active inventory
- 134
- Price-to-rent
- 8.0×
Monthly cashflow live
- Estimated rent
- $4,980 high interval (Pro) →
- Mortgage (P&I)
- −$2,517
- Tax from tax record
- −$846 /mo · $10,149/yr
- Insurance
- −$200
- HOA
- −$0
- Vacancy / Maint / Mgmt
- −$1,046
- Net cashflow
- $371
Break-even live
UW: 25.0% down · 7.5% · 30yr · 1.5% tax · 5.0% vac · 8.0% maint · 8.0% mgmt
Financing live
Cash to close
- Down payment
- $120,000
- Closing costs
- $14,400
- Reserves months
- —
- Total cash needed
- —
Loan-product check · same deal, 3 products live
Conventional
25% down · 7.5% · 30yr
- Down + closing
- —
- Monthly P&I
- —
- Monthly cashflow
- —
- DSCR
- —
- Eligible?
- —
Personal DTI + credit; lowest rate.
DSCR
20% down · 8.5% · 30yr
- Down + closing
- —
- Monthly P&I
- —
- Monthly cashflow
- —
- DSCR
- —
- Eligible?
- —
No personal income docs; deal must DSCR.
Hard money
10% down · 12.0% · 12mo
- Down + closing
- —
- Monthly P&I
- —
- Monthly cashflow
- —
- DSCR
- —
- Eligible?
- —
Short-term bridge; refi at stabilization.
Rent comps 22 comps
| Address | Beds | Baths | Sqft | Rent | $/sqft | DOM | Units | Dist |
|---|---|---|---|---|---|---|---|---|
| 301 Hawthorne Dr West Palm Beach, FL | 3.0 | 2.0 | 1402 | $3,200 | $2.28 | 24d | 1 | 0.53mi |
| 620 Southwind Cir Unit A North Palm Beach, FL | 3.0 | 2.0 | 1697 | $4,200 | $2.47 | 24d | 1 | 0.59mi |
| 624 Southwind Cir Unit 3 North Palm Beach, FL | 3.0 | 3.0 | 1316 | $5,500 | $4.18 | 24d | 1 | 0.59mi |
| 815 Silver Beach Rd Lake Park, FL | 4.0 | 3.0 | 1480 | $3,000 | $2.03 | 24d | 1 | 0.61mi |
| 250 Foresteria Dr West Palm Beach, FL | 4.0 | 3.0 | 2080 | $11,500 | $5.53 | 20d | 1 | 0.67mi |
| 549 Fairwind Dr North Palm Beach, FL | 3.0 | 2.0 | 1498 | $5,000 | $3.34 | 24d | 1 | 0.79mi |
| 2573 Conroy Dr West Palm Beach, FL | 5.0 | 3.0 | 2153 | $5,950 | $2.76 | 24d | 1 | 0.81mi |
| 517 Gulf Rd North Palm Beach, FL | 3.0 | 2.0 | 1657 | $5,500 | $3.32 | 24d | 1 | 0.86mi |
| 220 Lake Shore Dr Lake Park, FL | 1.0–3.0 | 1.5–3.5 | 1575 | $25,000 | $15.87 | 5d | 18 | 1.00mi |
| 111 W 35th St Riviera Beach, FL | 4.0 | 2.0 | 1600 | $3,000 | $1.88 | 11d | 1 | 1.02mi |
| 429 Inlet Rd North Palm Beach, FL | 3.0 | 2.5 | 1452 | $6,500 | $4.48 | 24d | 1 | 1.03mi |
| 1389 W 33rd St Riviera Beach, FL | 4.0 | 3.0 | 1737 | $3,000 | $1.73 | 24d | 1 | 1.04mi |
| 547 Marlin Rd North Palm Beach, FL | 3.0 | 2.0 | 1880 | $9,900 | $5.27 | 24d | 1 | 1.14mi |
| 708 Westwind Dr North Palm Beach, FL | 3.0 | 2.0 | 1761 | $4,000 | $2.27 | 24d | 1 | 1.16mi |
| 520 W 28th St Riviera Beach, FL | 3.0 | 1.0 | 1296 | $6,000 | $4.63 | 3d | 1 | 1.18mi |
| 712 Tradewind Dr North Palm Beach, FL | 4.0 | 3.0 | 1616 | $6,500 | $4.02 | 24d | 1 | 1.24mi |
| 908 Lighthouse Dr North Palm Beach, FL | 3.0 | 2.0 | 1478 | $4,250 | $2.88 | 24d | 1 | 1.25mi |
| 736 Prosperity Farms Rd North Palm Beach, FL | 4.0 | 2.0 | 1556 | $6,950 | $4.47 | 24d | 1 | 1.28mi |
| 735 Tradewind Dr North Palm Beach, FL | 4.0 | 2.0 | 1901 | $6,700 | $3.52 | 24d | 1 | 1.29mi |
| 2226 Oakmont Dr Riviera Beach, FL | 3.0 | 2.5 | 1972 | $2,850 | $1.45 | 24d | 1 | 1.37mi |
| 756 Cinnamon Rd North Palm Beach, FL | 4.0 | 2.0 | 1324 | $6,600 | $4.98 | 24d | 1 | 1.48mi |
| 135 E 28th St Riviera Beach, FL | 4.0 | 2.0 | 1711 | $3,200 | $1.87 | 24d | 1 | 1.49mi |
Listing history 15 events
-
2026-06-10status $480,000 Pending 27 DOM
-
2026-06-09days on market $480,000 Active 27 DOM
-
2026-06-08days on market $480,000 Active 26 DOM
-
2026-06-07days on market $480,000 Active 25 DOM
-
2026-06-04days on market $480,000 Active 22 DOM
-
2026-06-03days on market $480,000 Active 21 DOM
-
2026-06-02days on market $480,000 Active 20 DOM
-
2026-06-02price $480,000 Active 19 DOM
-
2026-06-01days on market $500,000 Active 19 DOM
-
2026-05-31days on market $500,000 Active 18 DOM
-
2026-05-13$550,000 Active
-
2003-03-05soldstatus $127,000
-
2002-02-21soldstatus $117,000
-
1998-02-10soldstatus $92,300
-
1981-10-01soldstatus $45,000
ⓘ Source: listings_history table (triggers on properties + properties_extension) + one-shot
backfill from property_details.listing_events for pre-trigger history.
Tax reassessment forecast FL · Resets to sale price
- Current annual tax
- $10,149 · $846/mo
- Projected year-2 tax
- $10,149 · $846/mo
- Expected delta
- $0/yr ($0/mo · 0.0%)
ⓘ Screening estimate from a state-policy table — verify with the county assessor before closing.
Climate risk First Street
- Flood 1/10 Low FEMA zone X (unshaded) · 0% chance over 30 yrs
- Wildfire 1/10 Low
- Heat 10/10 Extreme 7 d/yr ≥106°F today · 24 d/yr by 30 yrs out
- Wind 10/10 Extreme 99% chance of damaging wind over 30 yrs
- Air quality 2/10 Low 0 unhealthy d/yr today · 1 by 30 yrs out
Nearby sold comps map
Loading sold comps map…
Walkable amenities ~0.75 mi
Loading nearby amenities…
Taxation est. · year 1
- Rental income
- $59,760
- − Mortgage interest
- −$26,887
- − Property taxes
- −$10,149
- − Insurance
- −$2,400
- − Repairs & maintenance
- −$4,781
- − Management
- −$4,781
- − Depreciation
- −$13,964
- Taxable loss
- −$3,202
- Est. tax savings @ 24.0%
- +$768
- After-tax cash flow
- $5,224/yr
For passive investors: Depreciation is non-cash, so a rental often shows a tax loss while cash-flowing — sheltering income. Rental losses are passive: they offset passive income freely, and up to $25,000/yr can offset ordinary (W-2) income if you actively participate and your MAGI is under $100k (phasing out to $0 by $150k); unused losses carry forward. On sale, claimed depreciation is recaptured at up to 25%, and gains may owe capital-gains tax (a 1031 exchange can defer both). Figures are a year-1 estimate at your 24.0% rate — not tax advice; consult a CPA.
Schools (NCES district)
- District
- Palm Beach
- NCES district ID
- 1201500
- Math proficiency
- 46% ▼ -16.00%
- Reading proficiency
- 53% ▼ -4.00%
- Median HH income
- $53,943
- Composite
- 42.72/100
- National rank
- #3160
- State rank
- #34 of 73 in FL
Livability — Lake Park
- Score
- 67/100
- State rank
- #542
- US rank
- #10167
Category grades
Schools grade is shown separately in the Schools card above.
Census & demographics
- Census place
- Lake Park, FL
- County
- Palm Beach County · 1,438,312 people
- City population
- 14,370
- Metro
- Miami-Fort Lauderdale-Pompano Beach, FL
- Population (ZIP)
- 14,370
- Household income
- $70,646
- Rent vs Own
- Severe rent burden
- 903.0
Population outlook (Palm Beach County) Hauer SSP2
- Today (2025)
- 1,637,487 people
- By 2030
- 1,743,255 · +6.5%
- By 2040
- 1,948,712 · +19.0%
- By 2050
- 2,132,979 · +30.3%
- By 2075
- 2,530,027 · +54.5%
- By 2100
- 2,706,979 · +65.3%
Race, ethnicity, and origin ACS 2023
- Neighborhood character
- Diverse neighborhood (Simpson 0.67)
- Race & ethnicity
- Black 46% White 31% Hispanic / Latino 17% Two or more races 12% Asian 2%
- Hispanic origin (detail)
- Mexican 3% Puerto Rican 4% Cuban 5%
- Common ancestry
- Hispanic 15% Italian 2% Romanian 1%
- Foreign-born
- 26% · Canada, China, Jamaica
- Languages at home
- 69% English-only · French/Haitian/Cajun 17% Spanish 12% Chinese 1%
Political lean MEDSL · Palm Beach
- 2024 margin
- Toss-up / Even · D 50.0% · R 49.2%
- 2008→2024 swing
- -22.1pp toward R · 2008: 22.9pp · 2024: 0.8pp
- All cycles
- 2024: D+0.8 2020: D+12.8 2016: D+15.3 2012: D+17.0 2008: D+22.9
Not yet ingested
- Civics
- —
Market trends
- HPI YoY
- ▼ -112.30%
- Current HPI
- 461.4045
- Rent YoY
- ▲ 5.97%
- Metro
- Miami-Fort Lauderdale-Pompano Beach, FL
- State GDP YoY
- ▲ 3.28%
- F500 in state
- 36
Industry mix (Fortune 500 HQ in FL)
| Industry | F500 HQs | Revenue |
|---|---|---|
| Industrial Technology | 2 | $29B |
|
||
| Insurance | 2 | $17B |
|
||
| Retail | 1 | $60B |
|
||
| Technology Distribution | 1 | $58B |
|
||
| Homebuilding | 1 | $35B |
|
||
| Technology Manufacturing | 1 | $35B |
|
||
Price history
+1122.2% since first listed5 events — show timeline
- 2026-05-13 Listed $550,000 Beaches MLS
- 2003-03-05 Sold (Public Records) $127,000 Public Records
- 2002-02-21 Sold (Public Records) $117,000 Public Records
- 1998-02-10 Sold (Public Records) $92,300 Public Records
- 1981-10-01 Sold (Public Records) $45,000 Public Records
Property tax history
+12.4%/yrLatest (2025): $10,149 · +276.4% YoY. Source: county tax records.
Cash-flow waterfall
monthlySold comps — $/sqft
last 12 mo · ≤1 miLoading sold comps…