 Duplex
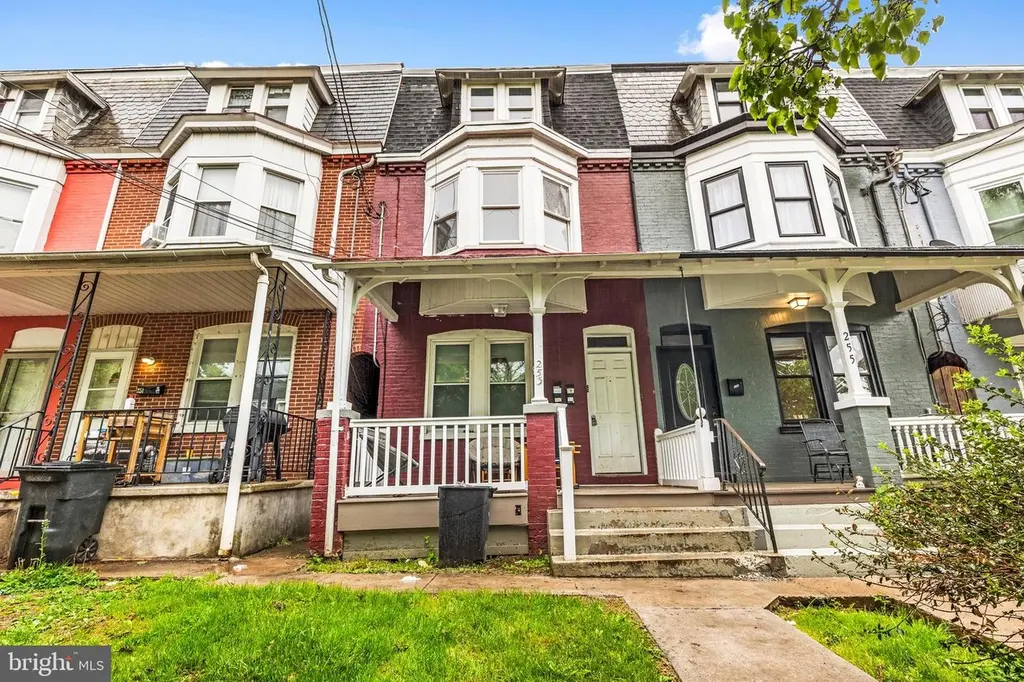
253 S Ann St · Lancaster, PA
Flood risk 1/10 · Minimal
- FEMA flood zone
- X (unshaded)
- Chance of flooding over 30 yrs
- 0.0%
- Est. flood insurance / yr
- $473 – $860
Fire risk 1/10 · Minimal
- Est. fire insurance / yr
- $511 – $949
Heat risk 6/10 · Moderate
- Hot days now (above 101°F)
- 7 days/yr
- Hot days in 30 yrs
- 15 days/yr
Wind risk 4/10 · Minor
- Chance of severe wind over 30 yrs
- 16.0%
Air-quality risk 4/10 · Minor
- Unhealthy air days now
- 4 days/yr
- Unhealthy air days in 30 yrs
- 7 days/yr
Risk factors via First Street. Map © Google.
Why this score? — see what drove the C grade
The composite is a weighted blend of 9 inputs, each scored 0–100. Each bar is that input's sub-score; the figure is the points it added to the 100-point composite (weight × sub-score).
- Cash flow +26.9/30.0
- DSCR +9.3/10.0
- 1% rule +6.9/10.0
- ARV discount +5.4/15.0
- Livability +4.2/5.0
- Rent growth +2.8/5.0
- Condition / age +2.5/5.0
- Schools +1.6/10.0
- Appreciation +0.0/10.0
$259,900
🖨 Deal sheet 📄 Offer letter ✓ Due diligence
Multi-family units
County records classify this as Multi-Family (2-4 Unit). Listing-text estimate: 2 units. confirmed
Listing remarks MLS
Two unit investment property in Lancaster city! Newer flooring and fresh paint throughout! Check it out while it is still available!
Key facts
- 2,178 sq ft lot
- 2 parking spots
- Built 1905
Property features AI
Finance
- Other: Ground rent payable annually
- Financial info: Existing leases on a month-to-month basis; Rent control not in effect
Exterior
- Parking: Off-street parking for 2 vehicles (total 2 parking spaces)
- Utilities: Public water; Public sewer; Natural gas available; Electric available; Cable TV available; Phone service available
- Home design: Interior townhouse / rowhouse; Fee simple ownership
- Construction: Brick and masonry construction; Brick/mortar foundation; Assessor-recorded year built
- Exterior features: Above-grade and below-grade structures noted
Interior
- Kitchen: Refrigerator; Stove
- Bedrooms: One 1-bedroom unit; One 3-bedroom unit
- Heating & cooling: Radiator heating; Hot water heating; Electric baseboard heating; Natural gas fuel for heating and hot water
- Interior features: Unfinished basement; Two residential units (multi-family)
Neighborhood map
What this means for you Summary
Snapshot
- This is a 1×2bd/1ba + 1×3bd/1ba units multifamily listed at $260k.
Deal economics
- At list price, monthly cash flow is $716 ($9k/yr) — positive. Per door: $358/mo.
- The deal already cash-flows at list — no discount required.
- Meets the 1% rule at list price ($3k rent vs $260k).
- Recommended offer: $252k (3.0% below list) — sets the bar for market timing.
- Cap rate 9.6% vs local median 4.2% in Lancaster — top-decile yield for the area; either an underpriced asset or a hidden risk that comps aren't pricing in. Stress-test before assuming the spread holds.
Location & tenants
- Location reads 85/100 on livability (#71 in PA, #498 nationally) — a professional / high-income tenant draw. Strengths: amenities A+, commute A+, cost of living A+; Watch: crime C-, employment C-.
- Lancaster SD (urban): math 12% / reading 25% proficiency, ranked #500 of 539 in PA (top 93%) — low school quality limits family demand, transient renter base, plan for 1-2y turnover; 72% free/reduced lunch — lower-income household profile, screen leases tightly.
- Market conditions: Rents rising (+1.2%/yr); 161 active listings in the ZIP; 31 comparable units currently listed for rent nearby; rentals at typical pace (median 23d on market — plan ~3-4 weeks tenant-placement turnaround); 45% of comp listings sitting > 30 days — soft ceiling on asking rent; solid renter incomes; 1,093 units permitted in Lancaster County in 2024 (201 in 5+ unit buildings).
- At $3,083/mo this rent would consume 49% of the median local household income ($76k/yr) (locally 1556% of renters already pay >50% of income on rent) — very limited rent-growth headroom before tenants either downsize or default.
Forward outlook
- Local home prices are declining (-3.0%/yr); year-one equity from $2k of loan paydown is wiped out by about $8k of value loss. Plan a longer hold.
- Lancaster County population projected at +5% by 2050 — modest demand growth; plan on rents tracking national, not racing it.
Negotiation context
- It's been on market 52 days — a 3% lower offer ($252k) is reasonable based on typical stale-listing flexibility.
- 4 sale attempts since 5y ago with the ask held roughly flat each time — persistent listings suggest the price (not the market) is what's stuck; bring a comps-based counter.
- Current owner paid $210k; 24% above their basis — modest negotiation headroom, anchor on the comps not their cost.
Risks & watch-outs
- Watch-outs: built in 1905 — expect roof / HVAC / electrical / plumbing capex.
- Climate carrying-cost: extreme-heat days projected 7→15/yr by 2055 (HVAC capex compounding) — expect insurance premiums to compound above CPI over the hold.
Questions for the listing agent
- It's been on market 52 days. Have you received any prior offers? Is the seller open to a 3% concession, seller financing, or rate buy-down credit?
- Can we see the unit-by-unit rent roll, current vacancy, and any below-market leases? What's the average tenancy length?
- What capital expenditures (roof, boiler, parking lot, exteriors) have been made in the last 5 years, and what's planned in the next 2?
- Built in 1905 — when were the roof, HVAC, electrical panel, plumbing, and water heater last replaced?
- Is there a deadline driving the sale (1031 exchange, divorce, estate, relocation)? That informs how much negotiation room exists.
- What's the average days-on-market for RENTAL listings here right now (not sales)? A rising rental-DOM trend means longer vacancies and softer asking-rent achievability than the comps imply.
- What's the recent tenant-quality profile in this submarket — average credit score on applications, eviction rate, late-payment / NSF rate, and stable-employment percentage? A property-management company in the area should have these aggregated.
- How much new apartment / multifamily construction is in the pipeline within 1–3 miles? Heavy new supply (>2% of stock underway) typically softens rents 12–24 months out; light construction supports rent growth.
Investment metrics
- 1% rule
- 1.19% ✓
- Cap rate
- 9.60%
- Cash-on-cash
- 11.80%
- DSCR
- 1.53
- GRM
- 7.0
CMA / ARV
- ARV (median comp)
- $248,572
- List price
- $259,900
- Delta
- 4.56%
- Verdict
- FAIR
- Comps
- 20 within 1.0 mi
Show comp detail 6 sales within ~0.75 mi
| Address | Dist | Beds/Ba | Sqft | Sold | Price | $/sf | Match |
|---|---|---|---|---|---|---|---|
| 320 S Ann St | 0.06mi | 4/2.0 (+1) | 1,538 (+2%) | 6mo | $350,000 | $228 | 83 |
| 350 S Ann St | 0.10mi | 4/2.0 (+1) | 1,574 (+5%) | 15mo | $370,000 | $235 | 70 |
| 347 N Reservoir St N | 0.75mi | 2/— (-1) | 1,518 (+1%) | 16mo | $300,000 | $198 | 45 |
| 742 E Marion St | 0.49mi | 2/2.0 (-1) | 1,290 (-14%) | 16mo | $228,000 | $177 | 35 |
| 114 S Prince St | 0.72mi | 4/2.0 (+1) | 1,708 (+14%) | 6mo | $249,000 | $146 | 34 |
| 344-346 Beaver St | 0.67mi | 4/— (+1) | 1,342 (-11%) | 17mo | $214,000 | $159 | 32 |
Match score weights: distance 35% · size 25% · config 20% · recency 20%. Top-matched comps best support the ARV.
Projected returns pro-forma
-3.0% appreciation · 1.2% rent growth · sell at horizon
- IRR
- -0.7%
- Equity multiple
- 0.97×
- Total profit
- $-2,015
- Equity at exit
- $38,752
- IRR
- 7.0%
- Equity multiple
- 1.48×
- Total profit
- $35,233
- Equity at exit
- $22,471
Cash invested: $72,772 (down + closing). Projections, not guarantees.
Landlord ↔ Tenant lean methodology
- Overall (STATE)
- 62 Landlord-Friendly
- State Pennsylvania
- 62 Landlord-Friendly · EVEN
- County
- — inherits STATE
- City
- — inherits STATE
ZIP-level market 17602
- Rents YoY
- 1.2%
- Active inventory
- 161
- Price-to-rent
- 14.8×
Monthly cashflow live
- Estimated rent
- $3,083 high interval (Pro) →
- Mortgage (P&I)
- −$1,363
- Tax from tax record
- −$249 /mo · $2,983/yr
- Insurance
- −$108
- HOA
- −$0
- Vacancy / Maint / Mgmt
- −$647
- Net cashflow
- $716
Break-even live
2-unit breakdown (identical units grouped — click to expand)
| Units | Beds | Baths | Est. rent |
|---|---|---|---|
| 1× unit | 2 | 1 | $1,460 |
| 1× unit | 3 | 1 | $1,623 |
| Total (2 units) | $3,083 | ||
UW: 25.0% down · 7.5% · 30yr · 1.5% tax · 5.0% vac · 8.0% maint · 8.0% mgmt
Financing live
Cash to close
- Down payment
- $64,975
- Closing costs
- $7,797
- Reserves months
- —
- Total cash needed
- —
Loan-product check · same deal, 3 products live
Conventional
25% down · 7.5% · 30yr
- Down + closing
- —
- Monthly P&I
- —
- Monthly cashflow
- —
- DSCR
- —
- Eligible?
- —
Personal DTI + credit; lowest rate.
DSCR
20% down · 8.5% · 30yr
- Down + closing
- —
- Monthly P&I
- —
- Monthly cashflow
- —
- DSCR
- —
- Eligible?
- —
No personal income docs; deal must DSCR.
Hard money
10% down · 12.0% · 12mo
- Down + closing
- —
- Monthly P&I
- —
- Monthly cashflow
- —
- DSCR
- —
- Eligible?
- —
Short-term bridge; refi at stabilization.
Rent comps 31 comps
| Address | Beds | Baths | Sqft | Rent | $/sqft | DOM | Units | Dist |
|---|---|---|---|---|---|---|---|---|
| 708 S Lime St Unit 3 Lancaster, PA | 4.0 | 1.0 | 1742 | $1,850 | $1.06 | 43d | 1 | 0.16mi |
| 225 E King St Unit 2 Lancaster, PA | 2.0 | 2.5 | 1075 | $2,600 | $2.42 | 43d | 1 | 0.42mi |
| 537 Woodward St Lancaster, PA | 3.0 | 2.0 | 1288 | $1,650 | $1.28 | 23d | 1 | 0.46mi |
| 549 Howard Ave Lancaster, PA | 4.0 | 1.0 | 1439 | $1,700 | $1.18 | 43d | 1 | 0.57mi |
| 231 N Shippen St #224 Lancaster, PA | 2.0 | 2.0 | 1155 | $2,285 | $1.98 | 13d | 1 | 0.62mi |
| 345 1/2 Beaver St Lancaster, PA | 4.0 | 1.0 | 1382 | $2,095 | $1.52 | 43d | 1 | 0.65mi |
| 49 W Farnum St Lancaster, PA | 3.0 | 1.0 | 1820 | $1,650 | $0.91 | 43d | 1 | 0.68mi |
| 738 E Madison St Lancaster, PA | 3.0 | 1.0 | 1102 | $1,750 | $1.59 | 43d | 1 | 0.70mi |
| 214 W Strawberry St Lancaster, PA | 3.0 | 1.0 | 1175 | $1,345 | $1.14 | 21d | 1 | 0.82mi |
| 118 N Prince St Lancaster, PA | 1.0–3.0 | 1.0–3.0 | 1274 | $4,703 | $3.69 | 13d | 48 | 0.84mi |
| 403 N Queen St Lancaster, PA | 3.0 | 2.0 | 1950 | $3,500 | $1.79 | 13d | 1 | 0.94mi |
| 513 Poplar St Lancaster, PA | 3.0 | 1.5 | 1184 | $1,695 | $1.43 | 43d | 1 | 0.94mi |
| 1216 Clark St Lancaster, PA | 4.0 | 1.5 | 1270 | $2,195 | $1.73 | 13d | 1 | 0.95mi |
| 128 N Mulberry St Unit 1 Lancaster, PA | 2.0 | 2.0 | 1500 | $2,250 | $1.50 | 23d | 1 | 0.98mi |
| 425 N Prince St Apt 206 Lancaster, PA | 2.0 | 2.0 | 1138 | $1,995 | $1.75 | 43d | 1 | 1.02mi |
| 609 Saint Joseph St Lancaster, PA | 4.0 | 2.0 | 1523 | $1,695 | $1.11 | 43d | 1 | 1.03mi |
| 631 E Frederick St Lancaster, PA | 3.0 | 1.0 | 1830 | $1,850 | $1.01 | 43d | 1 | 1.09mi |
| 766 New Holland Ave Lancaster, PA | 3.0 | 1.0 | 1152 | $1,795 | $1.56 | 13d | 1 | 1.10mi |
| 529 Manor St Lancaster, PA | 3.0 | 1.0 | 1434 | $1,635 | $1.14 | 13d | 1 | 1.11mi |
| 1013 Willow Street Pike Lancaster, PA | 2.0 | 1.0 | 1144 | $1,499 | $1.31 | 13d | 1 | 1.13mi |
| 337 W Lemon St Unit 2 Lancaster, PA | 3.0 | 1.0 | 1588 | $1,895 | $1.19 | 13d | 1 | 1.19mi |
| 836 N Plum St Lancaster, PA | 3.0 | 2.0 | 1602 | $2,150 | $1.34 | 13d | 1 | 1.20mi |
| 2500 Hickory Dr Lancaster, PA | 2.0 | 2.5 | 1711 | $2,650 | $1.55 | 13d | 1 | 1.26mi |
| 14 Coral St Lancaster, PA | 3.0 | 1.5 | 1355 | $1,525 | $1.13 | 43d | 1 | 1.30mi |
| 701 Martha Ave Lancaster, PA | 2.0 | 1.0–2.0 | 1096 | $2,600 | $2.37 | 13d | 1 | 1.31mi |
| 741 Manor St Lancaster, PA | 3.0 | 1.0 | 1200 | $1,695 | $1.41 | 43d | 1 | 1.32mi |
| 40 Fairview Ave Lancaster, PA | 3.0 | 1.0 | 1152 | $1,700 | $1.48 | 13d | 1 | 1.34mi |
| 1635 Old Philadelphia Pike Lancaster, PA | 2.0 | 2.0 | 1160 | $1,845 | $1.59 | 13d | 1 | 1.37mi |
| 678 1/2 Columbia Ave Apt 2 Lancaster, PA | 3.0 | 1.0 | 1100 | $1,495 | $1.36 | 13d | 1 | 1.37mi |
| 860 N Market St Lancaster, PA | 3.0 | 2.0 | 1514 | $1,850 | $1.22 | 43d | 1 | 1.40mi |
| 520 W Frederick St Lancaster, PA | 4.0 | 1.0 | 1713 | $1,895 | $1.11 | 43d | 1 | 1.44mi |
Listing history 25 events
-
2026-06-18days on market $259,900 Active 52 DOM
-
2026-06-17days on market $259,900 Active 51 DOM
-
2026-06-16days on market $259,900 Active 50 DOM
-
2026-06-15days on market $259,900 Active 49 DOM
-
2026-06-14days on market $259,900 Active 47 DOM
-
2026-06-13days on market $259,900 Active 46 DOM
-
2026-06-10days on market $259,900 Active 44 DOM
-
2026-06-09days on market $259,900 Active 43 DOM
-
2026-06-08days on market $259,900 Active 42 DOM
-
2026-06-07days on market $259,900 Active 41 DOM
-
2026-06-03days on market $259,900 Active 37 DOM
-
2026-06-02days on market $259,900 Active 36 DOM
-
2026-06-01days on market $259,900 Active 35 DOM
-
2026-05-31days on market $259,900 Active 34 DOM
-
2026-05-30days on market $259,900 Active 33 DOM
-
2026-04-27$262,000 Active 599-char remark
-
2023-05-23soldstatus $210,000 132-char remark
Show marketing remark (132 chars)
Two unit investment property in Lancaster city! Newer flooring and fresh paint throughout! Check it out while it is still available!
-
2023-05-23$210,000 132-char remark
Show marketing remark (132 chars)
Two unit investment property in Lancaster city! Newer flooring and fresh paint throughout! Check it out while it is still available!
-
2021-07-12historical
-
2021-07-02$185,000 Active
-
2021-06-15historical
-
2021-06-02price $189,999
-
2021-05-27$194,999 Active
-
2018-09-26soldstatus $42,000
-
1989-01-10soldstatus $22,000
ⓘ Source: listings_history table (triggers on properties + properties_extension) + one-shot
backfill from property_details.listing_events for pre-trigger history.
Tax reassessment forecast PA · Partial reset (capped growth)
- Current annual tax
- $2,983 · $249/mo
- Projected year-2 tax
- $3,545 · $295/mo
- Expected delta
- +$562/yr (+$47/mo · 18.8%)
ⓘ Screening estimate from a state-policy table — verify with the county assessor before closing.
Climate risk First Street
- Flood 1/10 Low FEMA zone X (unshaded) · 0% chance over 30 yrs
- Wildfire 1/10 Low
- Heat 6/10 Major 7 d/yr ≥101°F today · 15 d/yr by 30 yrs out
- Wind 4/10 Moderate 16% chance of damaging wind over 30 yrs
- Air quality 4/10 Moderate 4 unhealthy d/yr today · 7 by 30 yrs out
Nearby sold comps map
Loading sold comps map…
Walkable amenities ~0.75 mi
Loading nearby amenities…
Taxation est. · year 1
- Rental income
- $36,996
- − Mortgage interest
- −$14,558
- − Property taxes
- −$2,983
- − Insurance
- −$1,300
- − Repairs & maintenance
- −$2,960
- − Management
- −$2,960
- − Depreciation
- −$7,561
- Taxable income
- $4,675
- Est. tax owed @ 24.0%
- −$1,122
- After-tax cash flow
- $7,467/yr
For passive investors: Depreciation is non-cash, so a rental often shows a tax loss while cash-flowing — sheltering income. Rental losses are passive: they offset passive income freely, and up to $25,000/yr can offset ordinary (W-2) income if you actively participate and your MAGI is under $100k (phasing out to $0 by $150k); unused losses carry forward. On sale, claimed depreciation is recaptured at up to 25%, and gains may owe capital-gains tax (a 1031 exchange can defer both). Figures are a year-1 estimate at your 24.0% rate — not tax advice; consult a CPA.
Schools (NCES district)
- District
- Lancaster SD
- NCES district ID
- 4213140
- Math proficiency
- 12% ▼ -10.00%
- Reading proficiency
- 25% ▼ -13.00%
- Median HH income
- $38,500
- Composite
- 15.52/100
- National rank
- #9301
- State rank
- #500 of 539 in PA
Livability — Lancaster
- Score
- 85/100
- State rank
- #71
- US rank
- #498
Category grades
Schools grade is shown separately in the Schools card above.
Census & demographics
- Census place
- Lancaster, PA
- County
- Lancaster County · 390,309 people
- City population
- 176,170
- Metro
- Lancaster, PA
- Population (ZIP)
- 52,217
- Household income
- $75,862
- Rent vs Own
- Severe rent burden
- 1556.0
Population outlook (Lancaster County) Hauer SSP2
- Today (2025)
- 561,011 people
- By 2030
- 570,969 · +1.8%
- By 2040
- 585,929 · +4.4%
- By 2050
- 591,056 · +5.4%
- By 2075
- 594,747 · +6.0%
- By 2100
- 558,850 · -0.4%
Race, ethnicity, and origin ACS 2023
- Neighborhood character
- Diverse neighborhood (Simpson 0.61)
- Race & ethnicity
- White 52% Hispanic / Latino 32% Two or more races 12% Black 11% Asian 2%
- Hispanic origin (detail)
- Mexican 2% Puerto Rican 21% Cuban 1% Dominican 4%
- Common ancestry
- Romanian 2% Italian 1% Lithuanian 1%
- Foreign-born
- 13% · Canada, Vietnam, South Korea
- Languages at home
- 70% English-only · Spanish 22% German/W. Germanic 2% French/Haitian/Cajun 1%
Political lean MEDSL · Lancaster
- 2024 margin
- R (+15.9) · D 41.5% · R 57.5%
- 2008→2024 swing
- -4.1pp toward R · 2008: -11.8pp · 2024: -15.9pp
- All cycles
- 2024: R+15.9 2020: R+15.8 2016: R+19.7 2012: R+19.2 2008: R+11.8
Not yet ingested
- Civics
- —
Market trends
- HPI YoY
- ▼ -248.05%
- Current HPI
- 288.9141
- Rent YoY
- ▲ 1.20%
- Metro
- Lancaster, PA
- State GDP YoY
- ▲ 1.68%
- F500 in state
- 34
Industry mix (Fortune 500 HQ in PA)
| Industry | F500 HQs | Revenue |
|---|---|---|
| Healthcare | 2 | $309B |
|
||
| Insurance | 2 | $27B |
|
||
| Telecommunications / Media | 1 | $124B |
|
||
| Industrial Distribution | 1 | $22B |
|
||
| Financial Services | 1 | $20B |
|
||
| Chemicals / Materials | 1 | $18B |
|
||
Price history
+1081.4% since first listed11 events — show timeline
- 2026-05-20 Price Changed $259,900 BRIGHT MLS
- 2026-04-27 Listed $262,000 BRIGHT MLS
- 2023-05-23 Listed $210,000 BRIGHT MLS
- 2023-05-23 Sold (MLS) $210,000 BRIGHT MLS
- 2021-07-12 Listing Removed — BRIGHT MLS
- 2021-07-02 Listed $185,000 BRIGHT MLS
- 2021-06-15 Listing Removed — BRIGHT MLS
- 2021-06-02 Price Changed $189,999 BRIGHT MLS
- 2021-05-27 Listed $194,999 BRIGHT MLS
- 2018-09-26 Sold (Public Records) $42,000 Public Records
- 1989-01-10 Sold (Public Records) $22,000 Public Records
Property tax history
+2.9%/yrLatest (2026): $2,983 · +3.3% YoY. Source: county tax records.
Cash-flow waterfall
monthlySold comps — $/sqft
last 12 mo · ≤1 miLoading sold comps…