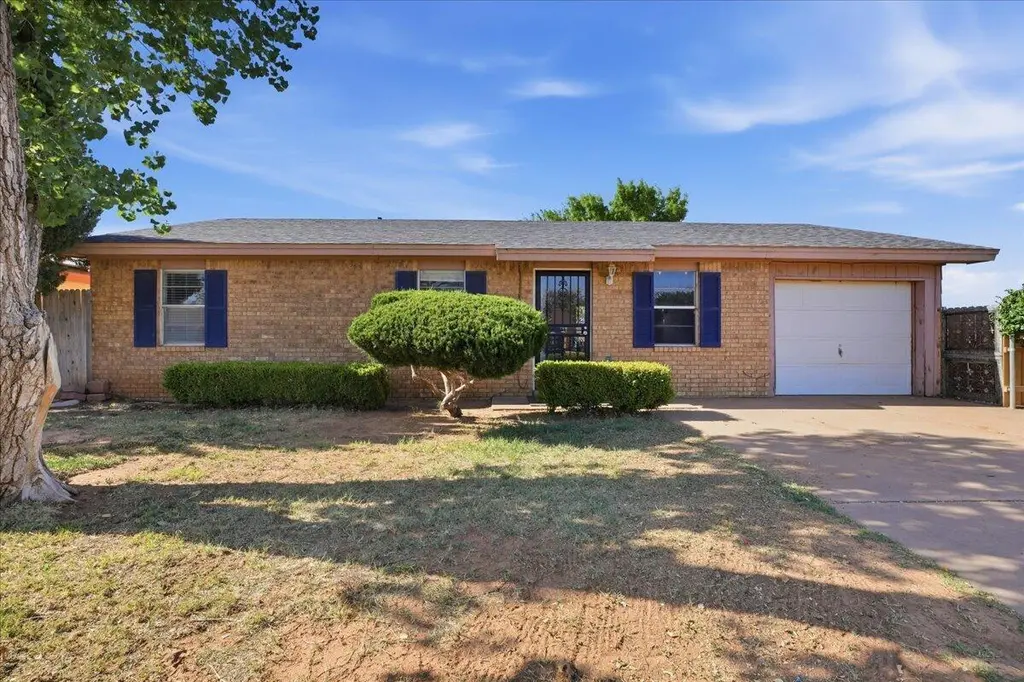
804 E 79th St · Lubbock, TX
Flood risk 2/10 · Minimal
- FEMA flood zone
- X (unshaded)
- Chance of flooding over 30 yrs
- 0.05%
- Est. flood insurance / yr
- $507 – $1,088
Fire risk 2/10 · Minimal
- Est. fire insurance / yr
- $1,222 – $2,270
Heat risk 5/10 · Moderate
- Hot days now (above 99°F)
- 7 days/yr
- Hot days in 30 yrs
- 21 days/yr
Wind risk 2/10 · Minimal
- Chance of severe wind over 30 yrs
- 1.0%
Air-quality risk 1/10 · Minimal
- Unhealthy air days now
- 0 days/yr
- Unhealthy air days in 30 yrs
- 0 days/yr
Risk factors via First Street. Map © Google.
Why this score? — see what drove the A- grade
The composite is a weighted blend of 9 inputs, each scored 0–100. Each bar is that input's sub-score; the figure is the points it added to the 100-point composite (weight × sub-score).
- Cash flow +28.9/30.0
- ARV discount +15.0/15.0
- DSCR +10.0/10.0
- 1% rule +8.2/10.0
- Appreciation +6.6/10.0
- Livability +4.0/5.0
- Schools +3.1/10.0
- Rent growth +2.5/5.0
- Condition / age +2.5/5.0
$115,000
🖨 Deal sheet (PDF) 📄 Offer letter ✓ Due diligence
Listing remarks MLS
Awesome home, 3 Bedroom 2 Bathroom 1 car Garage, New flooring, fresh paint, gorgeous backyard , Close to shoppings and retail centers, Owner Finance available
Key facts
- Spacious backyard
- 6,600 sq ft lot
- Built 1984
Tags
Property features AI
Exterior
- Parking: Concrete parking
- Security: Smoke detectors
- Home design: Single-family residence; Single-story; Updated / Remodeled
- Construction: Brick construction; Composition roof; Slab foundation; Built on a 0.15-acre lot
- Exterior features: Private yard; Storage; Fenced backyard with wood fencing; Asphalt-paved road access
Interior
- Kitchen: Oven; Refrigerator
- Bathrooms: 1 full bathroom; 1 half bathroom
- Heating & cooling: Central heating; Central air; Ceiling fans
- Interior features: Ceiling fans
- Laundry & utility: Gas water heater
Neighborhood map
What this means for you Summary
Snapshot
- This is a 3-bed/2.0-bath single-family listed at $115k.
Deal economics
- At list price, monthly cash flow is $390 ($5k/yr) — positive.
- The deal already cash-flows at list — no discount required.
- Meets the 1% rule at list price ($2k rent vs $115k).
Location & tenants
- Location reads 80/100 on livability (#37 in TX, #1,749 nationally) — a professional / high-income tenant draw. Strengths: commute A+, cost of living A+, housing A+; Watch: employment C-, crime F.
- Lubbock ISD (urban): math 36% / reading 39% proficiency, ranked #481 of 826 in TX (top 58%) — families likely to look elsewhere, expect single-tenant / working-renter base with shorter leases; 60% free/reduced lunch — lower-income household profile, screen leases tightly.
- Zoned schools: Hodges El (math 27% / reading 27%, grade F, #2,791 of 4,322 statewide, top 68%, 255 students, 98% FRL, charter); Dunbar College Preparatory Academy (math 16% / reading 20%, grade F, #1,491 of 1,662 statewide, top 91%, 430 students, 97% FRL, charter); Estacado H S (math 26% / reading 29%, grade F, #1,183 of 1,632 statewide, top 73%, 897 students, 90% FRL) — zoned schools average 95% FRL vs 60% district-wide (35 pts higher); higher-poverty schools than district average — tighter screening recommended.
- Zoned-school proficiency averages 24% at this address vs 38% district-wide (-13 pts) — the specific schools serving this property underperform the Lubbock ISD average; the district grade overstates school quality for this exact location.
- Market conditions: 93 active listings in the ZIP; 25 comparable units currently listed for rent nearby; rentals at typical pace (median 23d on market — plan ~3-4 weeks tenant-placement turnaround); 44% of comp listings sitting > 30 days — soft ceiling on asking rent; 2,219 units permitted in Lubbock County in 2024 (252 in 5+ unit buildings).
- This rent runs 35% of the median local income ($52k/yr) — at the standard rent-burdened threshold; future hikes will face affordability resistance.
Forward outlook
- In year one you build about $5k of equity ($795 loan paydown + $4k appreciation (3.2% local appreciation)).
- Lubbock County population projected at +39% by 2050 — long-run rental-demand tailwind backs the buy-and-hold thesis.
- At projected returns (3.2% appreciation + 3.0% rent growth), your $32k cash investment doubles in ~4 years — after that, you're playing with house money.
- By year 8, paydown + projected appreciation supports a ~$33k cash-out refi (75% LTV) — recoverable capital for the next deal without selling this one.
Negotiation context
- Only 3 days on market — expect competitive offers; lowballing is unlikely to land.
- 2 sale attempts since 8y ago with the ask held roughly flat each time — persistent listings suggest the price (not the market) is what's stuck; bring a comps-based counter.
Risks & watch-outs
- Climate carrying-cost: extreme-heat days projected 7→21/yr by 2055 (HVAC capex compounding) — expect insurance premiums to compound above CPI over the hold.
Questions for the listing agent
- Is there a deadline driving the sale (1031 exchange, divorce, estate, relocation)? That informs how much negotiation room exists.
- Schools are D-rated, which usually means shorter tenancies and higher turnover. Who's the typical renter profile here, and what's been the actual vacancy rate?
- Crime grade is F in this area — have there been break-ins, vandalism, or insurance claims at this property in the last 3 years? What carrier currently insures it and at what premium?
- What's the average days-on-market for RENTAL listings here right now (not sales)? A rising rental-DOM trend means longer vacancies and softer asking-rent achievability than the comps imply.
- What's the recent tenant-quality profile in this submarket — average credit score on applications, eviction rate, late-payment / NSF rate, and stable-employment percentage? A property-management company in the area should have these aggregated.
- How much new for-sale + rental construction is in the pipeline within 1–3 miles? Heavy new supply typically softens prices + rents 12–24 months out; constrained supply supports both.
Investment metrics
- 1% rule
- 1.32% ✓
- Cap rate
- 10.37%
- Cash-on-cash
- 14.54%
- DSCR
- 1.65
- GRM
- 6.3
CMA / ARV
- ARV (median comp)
- $151,122
- List price
- $115,000
- Delta
- -23.90%
- Verdict
- UNDERPRICED
- Comps
- 2 within 2.0 mi
Projected returns pro-forma
3.22% appreciation · 3.0% rent growth · sell at horizon
- IRR
- 21.7%
- Equity multiple
- 2.25×
- Total profit
- $40,108
- Equity at exit
- $53,162
- IRR
- 22.5%
- Equity multiple
- 4.30×
- Total profit
- $106,332
- Equity at exit
- $83,076
Cash invested: $32,200 (down + closing). Projections, not guarantees.
Landlord ↔ Tenant lean methodology
- Overall (STATE)
- 87 Strongly Landlord-Friendly
- State Texas
- 87 Strongly Landlord-Friendly · R+5
- County
- — inherits STATE
- City
- — inherits STATE
ZIP-level market 79404
- Home prices YoY
- 2.0%
- Active inventory
- 93
- Price-to-rent
- 6.3×
Monthly cashflow live
- Estimated rent
- $1,521 high interval (Pro) →
- Mortgage (P&I)
- −$603
- Tax from tax record
- −$160 /mo · $1,924/yr
- Insurance
- −$48
- HOA
- −$0
- Vacancy / Maint / Mgmt
- −$319
- Net cashflow
- $390
Break-even live
Sensitivity live
| Price | -10% $455 | -5% $423 | +0% $390 | +5% $358 | +10% $325 |
|---|---|---|---|---|---|
| Rent | -10% $270 | -5% $330 | +0% $390 | +5% $450 | +10% $510 |
| Rate | -1.0pp $448 | -0.5pp $420 | base $390 | +0.5pp $360 | +1.0pp $330 |
UW: 25.0% down · 7.5% · 30yr · 1.5% tax · 5.0% vac · 8.0% maint · 8.0% mgmt
Financing live
Cash to close
- Down payment
- $28,750
- Closing costs
- $3,450
- Reserves months
- —
- Total cash needed
- —
Loan-product check · same deal, 3 products live
Conventional
25% down · 7.5% · 30yr
- Down + closing
- —
- Monthly P&I
- —
- Monthly cashflow
- —
- DSCR
- —
- Eligible?
- —
Personal DTI + credit; lowest rate.
DSCR
20% down · 8.5% · 30yr
- Down + closing
- —
- Monthly P&I
- —
- Monthly cashflow
- —
- DSCR
- —
- Eligible?
- —
No personal income docs; deal must DSCR.
Hard money
10% down · 12.0% · 12mo
- Down + closing
- —
- Monthly P&I
- —
- Monthly cashflow
- —
- DSCR
- —
- Eligible?
- —
Short-term bridge; refi at stabilization.
Rent comps 25 comps
| Address | Beds | Baths | Sqft | Rent | $/sqft | DOM | Units | Dist |
|---|---|---|---|---|---|---|---|---|
| 7704 Elm Ave Lubbock, TX | 3.0 | 2.0 | 1310 | $1,599 | $1.22 | 15d | 1 | 0.23mi |
| 7702 Elm Ave Lubbock, TX | 3.0 | 2.0 | 1470 | $1,600 | $1.09 | 15d | 1 | 0.23mi |
| 7723 Date Ave Lubbock, TX | 3.0 | 2.0 | 1310 | $1,599 | $1.22 | 22d | 1 | 0.24mi |
| 7717 Date Ave Lubbock, TX | 3.0 | 2.0 | 1430 | $1,899 | $1.33 | 15d | 1 | 0.24mi |
| 7715 Date Ave Lubbock, TX | 3.0 | 2.0 | 1430 | $1,599 | $1.12 | 22d | 1 | 0.24mi |
| 8011 Date Ave Lubbock, TX | 3.0 | 2.0 | 1310 | $1,599 | $1.22 | 22d | 1 | 0.27mi |
| 312 E 77th St Lubbock, TX | 3.0 | 2.0 | 1310 | $1,619 | $1.24 | 45d | 1 | 0.28mi |
| 320 E 76th St Lubbock, TX | 3.0 | 2.0 | 1310 | $1,599 | $1.22 | 15d | 1 | 0.28mi |
| 8015 Date Ave Lubbock, TX | 3.0 | 2.0 | 1310 | $1,599 | $1.22 | 22d | 1 | 0.28mi |
| 8017 Date Ave Lubbock, TX | 3.0 | 2.0 | 1382 | $1,599 | $1.16 | 15d | 1 | 0.28mi |
| 8030 Elm Ave Lubbock, TX | 3.0 | 2.0 | 1310 | $1,599 | $1.22 | 15d | 1 | 0.29mi |
| 312 E 76th St Lubbock, TX | 3.0 | 2.0 | 1430 | $1,599 | $1.12 | 15d | 1 | 0.31mi |
| 110 E 82nd St Unit 2 Lubbock, TX | 3.0 | 2.0 | 1113 | $1,150 | $1.03 | 45d | 1 | 0.55mi |
| 914 82nd St Unit B Lubbock, TX | 2.0 | 1.0 | 932 | $900 | $0.97 | 45d | 1 | 1.06mi |
| 1106 82nd St Unit B Lubbock, TX | 3.0 | 2.0 | 1243 | $950 | $0.76 | 45d | 1 | 1.12mi |
| 1108 82nd St Unit A Lubbock, TX | 3.0 | 2.0 | 1243 | $950 | $0.76 | 45d | 1 | 1.13mi |
| 1112 82nd St Unit B Lubbock, TX | 3.0 | 2.0 | 1243 | $950 | $0.76 | 45d | 1 | 1.15mi |
| 1116 82nd St Unit B Lubbock, TX | 3.0 | 2.0 | 1243 | $950 | $0.76 | 45d | 1 | 1.17mi |
| 1113 80th St Unit A Lubbock, TX | 3.0 | 2.0 | 1443 | $1,250 | $0.87 | 45d | 1 | 1.17mi |
| 1118 82nd St Unit A Lubbock, TX | 3.0 | 2.0 | 1243 | $950 | $0.76 | 45d | 1 | 1.19mi |
| 1115 80th St Unit A Lubbock, TX | 3.0 | 2.0 | 1443 | $1,250 | $0.87 | 45d | 1 | 1.19mi |
| 1508 82nd St Unit A Lubbock, TX | 2.0 | 1.0 | 960 | $750 | $0.78 | 45d | 1 | 1.37mi |
| 1512 82nd St Unit B Lubbock, TX | 2.0 | 1.0 | 900 | $750 | $0.83 | 22d | 1 | 1.39mi |
| 5614 Avenue A Unit A Lubbock, TX | 3.0 | 1.0 | 1129 | $695 | $0.62 | 22d | 1 | 1.47mi |
| 1303 65th St Lubbock, TX | 2.0 | 1.0 | 850 | $595 | $0.70 | 22d | 1 | 1.48mi |
Listing history 8 events
-
2026-05-04status Pending 272-char remark
-
2026-04-21$115,000 Active 272-char remark
-
2022-04-21soldstatus
-
2018-10-04soldstatus
-
2018-10-02soldstatus 158-char remark
Show marketing remark (158 chars)
Awesome home, 3 Bedroom 2 Bathroom 1 car Garage, New flooring, fresh paint, gorgeous backyard , Close to shoppings and retail centers, Owner Finance available
-
2018-05-18$99,900 158-char remark
Show marketing remark (158 chars)
Awesome home, 3 Bedroom 2 Bathroom 1 car Garage, New flooring, fresh paint, gorgeous backyard , Close to shoppings and retail centers, Owner Finance available
-
2018-04-27soldstatus
-
1992-09-01soldstatus
ⓘ Source: listings_history table (triggers on properties + properties_extension) + one-shot
backfill from property_details.listing_events for pre-trigger history.
Tax reassessment forecast TX · Resets to sale price
- Current annual tax
- $1,924 · $160/mo
- Projected year-2 tax
- $2,104 · $175/mo
- Expected delta
- +$181/yr (+$15/mo · 9.4%)
ⓘ Screening estimate from a state-policy table — verify with the county assessor before closing.
Climate risk First Street
- Flood 2/10 Low FEMA zone X (unshaded) · 5% chance over 30 yrs
- Wildfire 2/10 Low
- Heat 5/10 Major 7 d/yr ≥99°F today · 21 d/yr by 30 yrs out
- Wind 2/10 Low 100% chance of damaging wind over 30 yrs
- Air quality 1/10 Low 0 unhealthy d/yr today · 0 by 30 yrs out
Nearby sold comps map
Loading sold comps map…
Walkable amenities ~0.75 mi
Loading nearby amenities…
Taxation est. · year 1
- Rental income
- $18,252
- − Mortgage interest
- −$6,442
- − Property taxes
- −$1,924
- − Insurance
- −$575
- − Repairs & maintenance
- −$1,460
- − Management
- −$1,460
- − Depreciation
- −$3,345
- Taxable income
- $3,045
- Est. tax owed @ 24.0%
- −$731
- After-tax cash flow
- $3,952/yr
For passive investors: Depreciation is non-cash, so a rental often shows a tax loss while cash-flowing — sheltering income. Rental losses are passive: they offset passive income freely, and up to $25,000/yr can offset ordinary (W-2) income if you actively participate and your MAGI is under $100k (phasing out to $0 by $150k); unused losses carry forward. On sale, claimed depreciation is recaptured at up to 25%, and gains may owe capital-gains tax (a 1031 exchange can defer both). Figures are a year-1 estimate at your 24.0% rate — not tax advice; consult a CPA.
Schools (NCES district)
- District
- Lubbock ISD
- NCES district ID
- 4828500
- Math proficiency
- 36% ▼ -8.00%
- Reading proficiency
- 39% ▼ -1.00%
- Median HH income
- $39,820
- Composite
- 31.44/100
- National rank
- #5984
- State rank
- #481 of 826 in TX
Livability — Lubbock
- Score
- 80/100
- State rank
- #37
- US rank
- #1749
Category grades
Schools grade is shown separately in the Schools card above.
Census & demographics
- Census place
- Lubbock, TX
- County
- Lubbock County · 293,542 people
- City population
- 283,030
- Metro
- Lubbock, TX
- Population (ZIP)
- 8,529
- Household income
- $51,630
- Rent vs Own
- Severe rent burden
- 366.0
Population outlook (Lubbock County) Hauer SSP2
- Today (2025)
- 345,960 people
- By 2030
- 371,449 · +7.4%
- By 2040
- 424,539 · +22.7%
- By 2050
- 481,150 · +39.1%
- By 2075
- 633,467 · +83.1%
- By 2100
- 746,853 · +115.9%
Race, ethnicity, and origin ACS 2023
- Neighborhood character
- Diverse neighborhood (Simpson 0.60)
- Race & ethnicity
- Hispanic / Latino 55% Black 22% White 20% Two or more races 17% Native American 2%
- Hispanic origin (detail)
- Mexican 46%
- Common ancestry
- Romanian 1% Lithuanian 0%
- Foreign-born
- 5% · Canada
- Languages at home
- 64% English-only · Spanish 36%
Political lean MEDSL · Lubbock
- 2024 margin
- Solid R (+39.5) · D 29.7% · R 69.2% · Other 1.0%
- 2008→2024 swing
- -2.8pp toward R · 2008: -36.7pp · 2024: -39.5pp
- All cycles
- 2024: R+39.5 2020: R+32.2 2016: R+38.4 2012: R+40.9 2008: R+36.7
Not yet ingested
- Civics
- —
Market trends
- HPI YoY
- ▲ 3.22%
- Current HPI
- 163.854
- Rent YoY
- —
- Metro
- Lubbock, TX
- State GDP YoY
- ▲ 3.95%
- F500 in state
- 110
Industry mix (Fortune 500 HQ in TX)
| Industry | F500 HQs | Revenue |
|---|---|---|
| Energy | 16 | $1,198B |
|
||
| Technology | 5 | $198B |
|
||
| Engineering / Construction | 4 | $72B |
|
||
| Energy Services | 3 | $60B |
|
||
| Utilities | 3 | $41B |
|
||
| Healthcare | 2 | $330B |
|
||
Price history
+15.1% since first listed9 events — show timeline
- 2026-06-02 Sold (MLS) — LARMLS
- 2026-05-04 Pending — LARMLS
- 2026-04-21 Listed $115,000 LARMLS
- 2022-04-21 Sold (Public Records) — Public Records
- 2018-10-04 Sold (Public Records) — Public Records
- 2018-10-02 Sold (MLS) — LARMLS
- 2018-05-18 Listed $99,900 LARMLS
- 2018-04-27 Sold (Public Records) — Public Records
- 1992-09-01 Sold (Public Records) — Public Records
Property tax history
+5.6%/yrLatest (2025): $1,924 · +7.2% YoY. Source: county tax records.
Cash-flow waterfall
monthlySold comps — $/sqft
last 12 mo · ≤1 miLoading sold comps…