 🏷️ Likely Rental
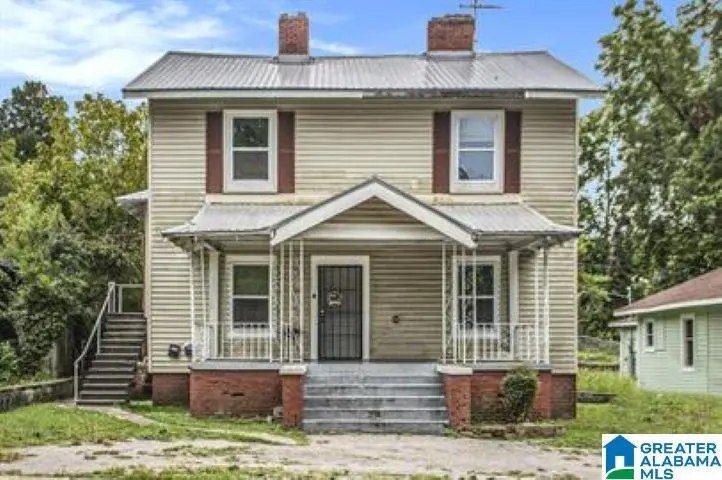
3827 40th Ave N · Birmingham, AL
Flood risk 1/10 · Minimal
- FEMA flood zone
- X (unshaded)
- Chance of flooding over 30 yrs
- 0.0%
- Est. flood insurance / yr
- $507 – $1,088
Fire risk 3/10 · Minor
- Est. fire insurance / yr
- $916 – $1,700
Heat risk 6/10 · Moderate
- Hot days now (above 106°F)
- 7 days/yr
- Hot days in 30 yrs
- 20 days/yr
Wind risk 6/10 · Moderate
- Chance of severe wind over 30 yrs
- 27.0%
Air-quality risk 5/10 · Moderate
- Unhealthy air days now
- 9 days/yr
- Unhealthy air days in 30 yrs
- 10 days/yr
Risk factors via First Street. Map © Google.
Why this score? — see what drove the B+ grade
The composite is a weighted blend of 9 inputs, each scored 0–100. Each bar is that input's sub-score; the figure is the points it added to the 100-point composite (weight × sub-score).
- Cash flow +30.0/30.0
- ARV discount +15.0/15.0
- 1% rule +10.0/10.0
- DSCR +10.0/10.0
- Rent growth +3.4/5.0
- Livability +3.4/5.0
- Condition / age +2.5/5.0
- Schools +0.9/10.0
- Appreciation +0.0/10.0
$95,000
🖨 Deal sheet 📄 Offer letter ✓ Due diligence
Multi-family units
County records classify this as Multi-Family (2-4 Unit). Listing-text estimate: 2 units. confirmed
Listing remarks MLS
Motivated Seller!! Great investment opportunity to add to your rental portfolio! This income-producing duplex features two units with current tenants in place, offering immediate cash flow and long-term potential. Unit A is occupied with a Section 8 lease through July 31, 2026, generating $825 per month with a 100% voucher. This unit offers 2 bedrooms and 1 full bathroom with some updates. Unit B is occupied by a straight-pay tenant on a month-to-month lease, currently renting for $500 per month, and also features 2 bedrooms and 1 bathroom. Both units include carpet in living areas and bedrooms, with vinyl plank flooring in the kitchen, laundry area, and bathroom. Kitchens are equipped with an electric stove and refrigerator, and bathrooms feature a tub/shower combination. Additional features include a flat backyard, off-street parking, and certified contractor repair estimates available upon request. Solid opportunity for investors seeking stable income with upside.
Key facts
- Off street parking
- Current tenants
- Flat backyard
Tags
Neighborhood map
What this means for you Summary
Snapshot
- This is a 2 × 2-bed/1-bath units multifamily listed at $95k.
Deal economics
- At list price, monthly cash flow is $902 ($11k/yr) — positive. Per door: $451/mo.
- The deal already cash-flows at list — no discount required.
- Meets the 1% rule at list price ($2k rent vs $95k).
- Recommended offer: $86k (9.0% below list) — sets the bar for market timing.
- Cap rate 17.7% vs local median 6.2% in Birmingham — top-decile yield for the area; either an underpriced asset or a hidden risk that comps aren't pricing in. Stress-test before assuming the spread holds.
Location & tenants
- Location reads 67/100 on livability (#78 in AL) — a middle-class / working-renter tenant base. Strengths: commute A+, cost of living A+, housing A+; Watch: amenities C-, schools F, crime F.
- Birmingham City (urban): math 4% / reading 20% proficiency, ranked #116 of 129 in AL (top 90%) — low school quality limits family demand, transient renter base, plan for 1-2y turnover; 82% free/reduced lunch — lower-income household profile, screen leases tightly.
- Market conditions: Rents rising (+3.6%/yr); 94 active listings in the ZIP; 22 comparable units currently listed for rent nearby; rentals lingering (median 44d on market — plan ~5-8 weeks vacancy on turnover, expect pricing pressure); 50% of comp listings sitting > 30 days — soft ceiling on asking rent; lower-income renter base — watch delinquency; 2,114 units permitted in Jefferson County in 2024 (556 in 5+ unit buildings).
- At $1,996/mo this rent would consume 59% of the median local household income ($40k/yr) (locally 594% of renters already pay >50% of income on rent) — very limited rent-growth headroom before tenants either downsize or default.
Forward outlook
- Local home prices are declining (-3.0%/yr); year-one equity from $657 of loan paydown is wiped out by about $3k of value loss. Plan a longer hold.
- Jefferson County population projected to shrink 4% by 2050 — rents likely to lag national; underwrite the cash flow, not the appreciation.
- At projected returns (-3.0% appreciation + 3.6% rent growth), your $27k cash investment doubles in ~3 years — after that, you're playing with house money.
Negotiation context
- It's been on market 111 days — a 9% lower offer ($86k) is reasonable based on typical stale-listing flexibility.
- 6 sale attempts since 9y ago; this cycle's ask has dropped $25k (21%) from the opening price — seller is motivated, your offer sets the floor, not the list.
Risks & watch-outs
- Watch-outs: built in 1920 — expect roof / HVAC / electrical / plumbing capex.
- Climate carrying-cost: major wind risk, 27% chance of damaging wind over 30y; extreme-heat days projected 7→20/yr by 2055 (HVAC capex compounding) — expect insurance premiums to compound above CPI over the hold.
Questions for the listing agent
- It's been on market 111 days. Have you received any prior offers? Is the seller open to a 9% concession, seller financing, or rate buy-down credit?
- Can we see the unit-by-unit rent roll, current vacancy, and any below-market leases? What's the average tenancy length?
- What capital expenditures (roof, boiler, parking lot, exteriors) have been made in the last 5 years, and what's planned in the next 2?
- Built in 1920 — when were the roof, HVAC, electrical panel, plumbing, and water heater last replaced?
- Why hasn't it sold? Are there any deal-killer items the seller is aware of (foundation, flood, title, zoning, code violations)?
- Is there a deadline driving the sale (1031 exchange, divorce, estate, relocation)? That informs how much negotiation room exists.
- Schools are F-rated, which usually means shorter tenancies and higher turnover. Who's the typical renter profile here, and what's been the actual vacancy rate?
- Crime grade is F in this area — have there been break-ins, vandalism, or insurance claims at this property in the last 3 years? What carrier currently insures it and at what premium?
- What's the average days-on-market for RENTAL listings here right now (not sales)? A rising rental-DOM trend means longer vacancies and softer asking-rent achievability than the comps imply.
- What's the recent tenant-quality profile in this submarket — average credit score on applications, eviction rate, late-payment / NSF rate, and stable-employment percentage? A property-management company in the area should have these aggregated.
- How much new apartment / multifamily construction is in the pipeline within 1–3 miles? Heavy new supply (>2% of stock underway) typically softens rents 12–24 months out; light construction supports rent growth.
Investment metrics
- 1% rule
- 2.10% ✓
- Cap rate
- 17.68%
- Cash-on-cash
- 40.67%
- DSCR
- 2.81
- GRM
- 4.0
CMA / ARV
- ARV (median comp)
- $137,746
- List price
- $95,000
- Delta
- -31.03%
- Verdict
- UNDERPRICED
- Comps
- 5 within 2.0 mi
Projected returns pro-forma
-3.0% appreciation · 3.58% rent growth · sell at horizon
- IRR
- 37.8%
- Equity multiple
- 2.63×
- Total profit
- $43,240
- Equity at exit
- $14,165
- IRR
- 44.7%
- Equity multiple
- 5.38×
- Total profit
- $116,624
- Equity at exit
- $8,214
Cash invested: $26,600 (down + closing). Projections, not guarantees.
Landlord ↔ Tenant lean methodology
- Overall (STATE)
- 90 Strongly Landlord-Friendly
- State Alabama
- 90 Strongly Landlord-Friendly · R+15
- County
- — inherits STATE
- City
- — inherits STATE
ZIP-level market 35217
- Rents YoY
- 3.6%
- Active inventory
- 94
- Price-to-rent
- 7.9×
Monthly cashflow live
- Estimated rent
- $1,996 high interval (Pro) →
- Mortgage (P&I)
- −$498
- Tax from tax record
- −$138 /mo · $1,650/yr
- Insurance
- −$40
- HOA
- −$0
- Vacancy / Maint / Mgmt
- −$419
- Net cashflow
- $902
Break-even live
2-unit breakdown (identical units grouped — click to expand)
| Units | Beds | Baths | Est. rent |
|---|---|---|---|
| 2× units | 2 | 1 | $1,996 |
| #1 | 2 | 1 | $998 |
| #2 | 2 | 1 | $998 |
| Total (2 units) | $1,996 | ||
UW: 25.0% down · 7.5% · 30yr · 1.5% tax · 5.0% vac · 8.0% maint · 8.0% mgmt
Financing live
Cash to close
- Down payment
- $23,750
- Closing costs
- $2,850
- Reserves months
- —
- Total cash needed
- —
Loan-product check · same deal, 3 products live
Conventional
25% down · 7.5% · 30yr
- Down + closing
- —
- Monthly P&I
- —
- Monthly cashflow
- —
- DSCR
- —
- Eligible?
- —
Personal DTI + credit; lowest rate.
DSCR
20% down · 8.5% · 30yr
- Down + closing
- —
- Monthly P&I
- —
- Monthly cashflow
- —
- DSCR
- —
- Eligible?
- —
No personal income docs; deal must DSCR.
Hard money
10% down · 12.0% · 12mo
- Down + closing
- —
- Monthly P&I
- —
- Monthly cashflow
- —
- DSCR
- —
- Eligible?
- —
Short-term bridge; refi at stabilization.
Rent comps 22 comps
| Address | Beds | Baths | Sqft | Rent | $/sqft | DOM | Units | Dist |
|---|---|---|---|---|---|---|---|---|
| 3823 43rd Ave N Birmingham, AL | 3.0 | 2.0 | 1500 | $1,200 | $0.80 | 43d | 1 | 0.19mi |
| 3823 43rd Ave N Birmingham, AL | 3.0 | 2.0 | 1500 | $1,200 | $0.80 | 23d | 1 | 0.19mi |
| 1303 Main St Birmingham, AL | 4.0 | 2.0 | 1432 | $1,300 | $0.91 | 43d | 1 | 0.44mi |
| 4329 Pulaski St Birmingham, AL | 3.0 | 2.0 | 1240 | $1,353 | $1.09 | 23d | 1 | 0.50mi |
| 4344 Pulaski St Birmingham, AL | 3.0 | 1.0 | 1268 | $1,050 | $0.83 | 43d | 1 | 0.50mi |
| 4231 40th Ave N Birmingham, AL | 3.0 | 1.0 | 1272 | $850 | $0.67 | 19d | 1 | 0.52mi |
| 4329 Harmon St Birmingham, AL | 3.0 | 1.0 | 1227 | $950 | $0.77 | 3d | 1 | 0.54mi |
| 4329 Harmon St Birmingham, AL | 3.0 | 1.0 | 1227 | $950 | $0.77 | 43d | 1 | 0.54mi |
| 619 Bell Ave Birmingham, AL | 3.0 | 1.0 | 1550 | $1,075 | $0.69 | 43d | 1 | 0.60mi |
| 4418 43rd St N Birmingham, AL | 3.0 | 1.0 | 1710 | $925 | $0.54 | 23d | 1 | 0.61mi |
| 732 Fulton Ave Birmingham, AL | 4.0 | 2.0 | 1320 | $1,450 | $1.10 | 43d | 1 | 0.76mi |
| 4212 50th Ave N Birmingham, AL | 4.0 | 2.0 | 1517 | $1,595 | $1.05 | 1d | 1 | 0.85mi |
| 5015 42nd Pl N Birmingham, AL | 3.0 | 2.0 | 1500 | $1,200 | $0.80 | 43d | 1 | 0.89mi |
| 4925 43rd Way N Birmingham, AL | 3.0 | 2.0 | 1232 | $1,461 | $1.19 | 1d | 1 | 0.92mi |
| 1043 Jackson Blvd Birmingham, AL | 4.0 | 2.0 | 1300 | $1,095 | $0.84 | 14d | 1 | 1.06mi |
| 1236 Elm Ave Birmingham, AL | 3.0 | 1.0 | 1888 | $950 | $0.50 | 43d | 1 | 1.12mi |
| 2807 34th St N Birmingham, AL | 4.0 | 2.0 | 1556 | $1,100 | $0.71 | 43d | 1 | 1.19mi |
| 1249 Waverly St Birmingham, AL | 3.0 | 1.0 | 1260 | $1,000 | $0.79 | 43d | 1 | 1.30mi |
| 1434 Thomason Ave Birmingham, AL | 4.0 | 2.0 | 1644 | $1,100 | $0.67 | 43d | 1 | 1.34mi |
| 1304 46th St N Birmingham, AL | 3.0 | 1.0 | 1683 | $670 | $0.40 | 16d | 1 | 1.40mi |
| 1224 Sloan Ave Birmingham, AL | 3.0 | 2.0 | 2164 | $1,200 | $0.55 | 3d | 1 | 1.41mi |
| 1601 48th St N Birmingham, AL | 3.0 | 1.0 | 1313 | $1,200 | $0.91 | 23d | 1 | 1.45mi |
Listing history 27 events
-
2026-05-07status Pending 981-char remark
Show marketing remark (981 chars)
Motivated Seller!! Great investment opportunity to add to your rental portfolio! This income-producing duplex features two units with current tenants in place, offering immediate cash flow and long-term potential. Unit A is occupied with a Section 8 lease through July 31, 2026, generating $825 per month with a 100% voucher. This unit offers 2 bedrooms and 1 full bathroom with some updates. Unit B is occupied by a straight-pay tenant on a month-to-month lease, currently renting for $500 per month, and also features 2 bedrooms and 1 bathroom. Both units include carpet in living areas and bedrooms, with vinyl plank flooring in the kitchen, laundry area, and bathroom. Kitchens are equipped with an electric stove and refrigerator, and bathrooms feature a tub/shower combination. Additional features include a flat backyard, off-street parking, and certified contractor repair estimates available upon request. Solid opportunity for investors seeking stable income with upside.
-
2026-04-30price $95,000 981-char remark
Show marketing remark (981 chars)
Motivated Seller!! Great investment opportunity to add to your rental portfolio! This income-producing duplex features two units with current tenants in place, offering immediate cash flow and long-term potential. Unit A is occupied with a Section 8 lease through July 31, 2026, generating $825 per month with a 100% voucher. This unit offers 2 bedrooms and 1 full bathroom with some updates. Unit B is occupied by a straight-pay tenant on a month-to-month lease, currently renting for $500 per month, and also features 2 bedrooms and 1 bathroom. Both units include carpet in living areas and bedrooms, with vinyl plank flooring in the kitchen, laundry area, and bathroom. Kitchens are equipped with an electric stove and refrigerator, and bathrooms feature a tub/shower combination. Additional features include a flat backyard, off-street parking, and certified contractor repair estimates available upon request. Solid opportunity for investors seeking stable income with upside.
-
2026-04-07price $110,000 981-char remark
Show marketing remark (981 chars)
Motivated Seller!! Great investment opportunity to add to your rental portfolio! This income-producing duplex features two units with current tenants in place, offering immediate cash flow and long-term potential. Unit A is occupied with a Section 8 lease through July 31, 2026, generating $825 per month with a 100% voucher. This unit offers 2 bedrooms and 1 full bathroom with some updates. Unit B is occupied by a straight-pay tenant on a month-to-month lease, currently renting for $500 per month, and also features 2 bedrooms and 1 bathroom. Both units include carpet in living areas and bedrooms, with vinyl plank flooring in the kitchen, laundry area, and bathroom. Kitchens are equipped with an electric stove and refrigerator, and bathrooms feature a tub/shower combination. Additional features include a flat backyard, off-street parking, and certified contractor repair estimates available upon request. Solid opportunity for investors seeking stable income with upside.
-
2026-01-16$120,000 Active 981-char remark
Show marketing remark (981 chars)
Motivated Seller!! Great investment opportunity to add to your rental portfolio! This income-producing duplex features two units with current tenants in place, offering immediate cash flow and long-term potential. Unit A is occupied with a Section 8 lease through July 31, 2026, generating $825 per month with a 100% voucher. This unit offers 2 bedrooms and 1 full bathroom with some updates. Unit B is occupied by a straight-pay tenant on a month-to-month lease, currently renting for $500 per month, and also features 2 bedrooms and 1 bathroom. Both units include carpet in living areas and bedrooms, with vinyl plank flooring in the kitchen, laundry area, and bathroom. Kitchens are equipped with an electric stove and refrigerator, and bathrooms feature a tub/shower combination. Additional features include a flat backyard, off-street parking, and certified contractor repair estimates available upon request. Solid opportunity for investors seeking stable income with upside.
-
2025-05-14price $114,900
-
2025-04-09price $119,500
-
2024-10-17price $115,000
-
2023-07-13soldstatus $105,000 Sold
-
2023-07-13soldstatus $105,000
-
2023-06-17historical Contingent
-
2023-04-27status Active
-
2023-04-21historical Contingent
-
2023-04-07$130,000 Active
-
2020-12-15soldstatus $103,500
-
2020-12-10soldstatus $103,500 Sold
-
2020-12-07status Pending
-
2020-11-02historical Contingent
-
2020-09-23$115,000 Active
-
2018-04-19soldstatus $68,000
-
2018-04-17price $68,000
-
2018-04-16price $78,000
-
2018-04-16soldstatus $68,000 Sold
-
2018-04-04historical
-
2018-02-25historical Contingent
-
2018-02-22status Active
-
2018-02-21historical
-
2017-12-01$78,000 Active
ⓘ Source: listings_history table (triggers on properties + properties_extension) + one-shot
backfill from property_details.listing_events for pre-trigger history.
Tax reassessment forecast AL · Resets to sale price
- Current annual tax
- $1,650 · $138/mo
- Projected year-2 tax
- $1,650 · $138/mo
- Expected delta
- $0/yr ($0/mo · 0.0%)
ⓘ Screening estimate from a state-policy table — verify with the county assessor before closing.
Climate risk First Street
- Flood 1/10 Low FEMA zone X (unshaded) · 0% chance over 30 yrs
- Wildfire 3/10 Moderate
- Heat 6/10 Major 7 d/yr ≥106°F today · 20 d/yr by 30 yrs out
- Wind 6/10 Major 27% chance of damaging wind over 30 yrs
- Air quality 5/10 Major 9 unhealthy d/yr today · 10 by 30 yrs out
Nearby sold comps map
Loading sold comps map…
Walkable amenities ~0.75 mi
Loading nearby amenities…
Taxation est. · year 1
- Rental income
- $23,952
- − Mortgage interest
- −$5,321
- − Property taxes
- −$1,650
- − Insurance
- −$475
- − Repairs & maintenance
- −$1,916
- − Management
- −$1,916
- − Depreciation
- −$2,764
- Taxable income
- $9,909
- Est. tax owed @ 24.0%
- −$2,378
- After-tax cash flow
- $8,440/yr
For passive investors: Depreciation is non-cash, so a rental often shows a tax loss while cash-flowing — sheltering income. Rental losses are passive: they offset passive income freely, and up to $25,000/yr can offset ordinary (W-2) income if you actively participate and your MAGI is under $100k (phasing out to $0 by $150k); unused losses carry forward. On sale, claimed depreciation is recaptured at up to 25%, and gains may owe capital-gains tax (a 1031 exchange can defer both). Figures are a year-1 estimate at your 24.0% rate — not tax advice; consult a CPA.
Schools (NCES district)
- District
- Birmingham City
- NCES district ID
- 0100390
- Math proficiency
- 4% ▼ -17.00%
- Reading proficiency
- 20% ▼ -4.00%
- Median HH income
- $31,988
- Composite
- 9.49/100
- National rank
- #9850
- State rank
- #116 of 129 in AL
Livability — Birmingham
- Score
- 67/100
- State rank
- #78
- US rank
- #10412
Category grades
Schools grade is shown separately in the Schools card above.
Census & demographics
- Census place
- Birmingham, AL
- County
- Jefferson County · 527,445 people
- City population
- 210,422
- Metro
- Birmingham-Hoover, AL
- Population (ZIP)
- 12,240
- Household income
- $40,486
- Rent vs Own
- Severe rent burden
- 594.0
Population outlook (Jefferson County) Hauer SSP2
- Today (2025)
- 669,185 people
- By 2030
- 669,694 · +0.1%
- By 2040
- 661,388 · -1.2%
- By 2050
- 643,086 · -3.9%
- By 2075
- 577,267 · -13.7%
- By 2100
- 474,758 · -29.1%
Race, ethnicity, and origin ACS 2023
- Neighborhood character
- Diverse neighborhood (Simpson 0.58)
- Race & ethnicity
- Black 57% White 27% Hispanic / Latino 14% Two or more races 6%
- Hispanic origin (detail)
- Mexican 9%
- Common ancestry
- Slovak 3% Italian 1%
- Foreign-born
- 7% · Canada, Guatemala
- Languages at home
- 86% English-only · Spanish 13%
Political lean MEDSL · Jefferson
- 2024 margin
- D (+10.4) · D 54.6% · R 44.2% · Other 1.2%
- 2008→2024 swing
- +5.4pp toward D · 2008: 5.1pp · 2024: 10.4pp
- All cycles
- 2024: D+10.4 2020: D+13.2 2016: D+7.2 2012: D+6.0 2008: D+5.1
Not yet ingested
- Civics
- —
Market trends
- HPI YoY
- ▼ -74.54%
- Current HPI
- 117.416
- Rent YoY
- ▲ 3.58%
- Metro
- Birmingham-Hoover, AL
- State GDP YoY
- ▲ 2.94%
- F500 in state
- 4
Industry mix (Fortune 500 HQ in AL)
| Industry | F500 HQs | Revenue |
|---|---|---|
| Financial Services | 1 | $8B |
|
||
| Healthcare | 1 | $5B |
|
||
Price history
+21.8% since first listed27 events — show timeline
- 2026-05-07 Pending — Greater Alabama MLS
- 2026-04-30 Price Changed $95,000 Greater Alabama MLS
- 2026-04-07 Price Changed $110,000 Greater Alabama MLS
- 2026-01-16 Listed $120,000 Greater Alabama MLS
- 2025-05-14 Price Changed $114,900 Greater Alabama MLS
- 2025-04-09 Price Changed $119,500 Greater Alabama MLS
- 2024-10-17 Price Changed $115,000 Greater Alabama MLS
- 2023-07-13 Sold (Public Records) $105,000 Public Records
- 2023-07-13 Sold (MLS) $105,000 Greater Alabama MLS
- 2023-06-17 Contingent — Greater Alabama MLS
- 2023-04-27 Relisted — Greater Alabama MLS
- 2023-04-21 Contingent — Greater Alabama MLS
- 2023-04-07 Listed $130,000 Greater Alabama MLS
- 2020-12-15 Sold (Public Records) $103,500 Public Records
- 2020-12-10 Sold (MLS) $103,500 Greater Alabama MLS
- 2020-12-07 Pending — Greater Alabama MLS
- 2020-11-02 Contingent — Greater Alabama MLS
- 2020-09-23 Listed $115,000 Greater Alabama MLS
- 2018-04-19 Sold (Public Records) $68,000 Public Records
- 2018-04-17 Price Changed $68,000 Greater Alabama MLS
- 2018-04-16 Price Changed $78,000 Greater Alabama MLS
- 2018-04-16 Sold (MLS) $68,000 Greater Alabama MLS
- 2018-04-04 Delisted — Greater Alabama MLS
- 2018-02-25 Contingent — Greater Alabama MLS
- 2018-02-22 Relisted — Greater Alabama MLS
- 2018-02-21 Delisted — Greater Alabama MLS
- 2017-12-01 Listed $78,000 Greater Alabama MLS
Property tax history
+27.1%/yrLatest (2025): $1,650 · +0.0% YoY. Source: county tax records.
Cash-flow waterfall
monthlySold comps — $/sqft
last 12 mo · ≤1 miLoading sold comps…