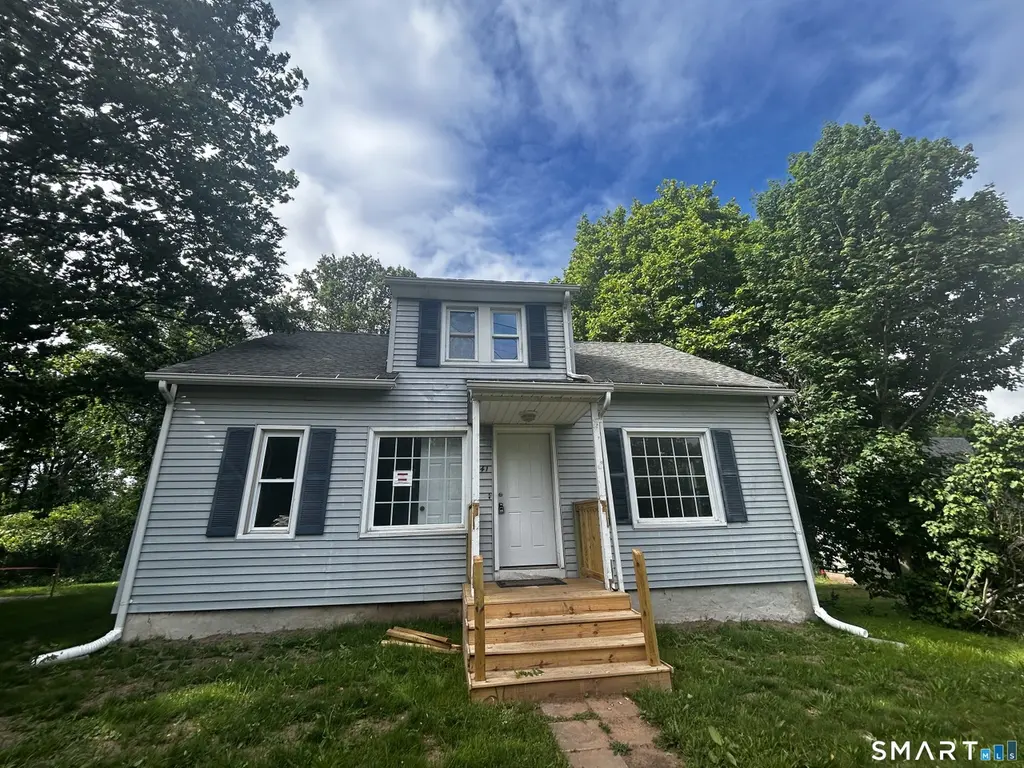
741 Norton Rd · Kensington, CT
Flood risk 1/10 · Minimal
- FEMA flood zone
- X (unshaded)
- Chance of flooding over 30 yrs
- 0.0%
- Est. flood insurance / yr
- $473 – $860
Fire risk 2/10 · Minimal
- Est. fire insurance / yr
- $829 – $1,539
Heat risk 5/10 · Moderate
- Hot days now (above 98°F)
- 7 days/yr
- Hot days in 30 yrs
- 15 days/yr
Wind risk 6/10 · Moderate
- Chance of severe wind over 30 yrs
- 27.0%
Air-quality risk 3/10 · Minor
- Unhealthy air days now
- 3 days/yr
- Unhealthy air days in 30 yrs
- 4 days/yr
Risk factors via First Street. Map © Google.
Why this score? — see what drove the C- grade
The composite is a weighted blend of 9 inputs, each scored 0–100. Each bar is that input's sub-score; the figure is the points it added to the 100-point composite (weight × sub-score).
- ARV discount +15.0/15.0
- Cash flow +14.4/30.0
- Schools +4.8/10.0
- DSCR +4.4/10.0
- Livability +4.0/5.0
- 1% rule +3.7/10.0
- Rent growth +2.5/5.0
- Condition / age +2.5/5.0
- Appreciation +0.0/10.0
$299,900
🖨 Deal sheet (PDF) 📄 Offer letter ✓ Due diligence
Listing remarks MLS
Beautiful 3 bedroom 2 bath cape. Home has new roof,newer windows, new first floor bath, refinished hardwood floors, new carpeting in upstairs bedrooms and freshly painted interior.
Key facts
- 0.23 acre lot
- Built 1920
- Listed 9 days
Property features AI
Exterior
- Utilities: Public water connected; Septic sewer system; Natural gas hot water; Oil available for heating
- Home design: Single-family home
- Construction: Gable roof; Frame construction; Concrete foundation; Built with vinyl siding
- Exterior features: Deck; Level lot; Vinyl siding
Interior
- Kitchen: Gas range; Refrigerator; Dishwasher
- Bedrooms: 3 bedrooms
- Bathrooms: 2 full bathrooms
- Heating & cooling: Hot air heating; Natural gas and oil fuel for heating; 40-gallon natural gas hot water tank; Fuel tank located in the basement
- Interior features: 6 total rooms; Full basement with hatchway
- Laundry & utility: Laundry hookups in the upstairs full bathroom; Laundry area on upper level
Neighborhood map
What this means for you Summary
Snapshot
- This is a 3-bed/2.0-bath single-family listed at $300k.
Deal economics
- At list price, monthly cash flow is $63 ($754/yr) — positive.
- The deal already cash-flows at list — no discount required.
- To meet the 1% rule (rent ≥ 1% of price), the offer needs to be $262k (12.6% below list).
- Recommended offer: $262k (12.6% below list) — sets the bar for 1% rule.
- Cap rate 6.5% vs local median 3.3% in Kensington — top-decile yield for the area; either an underpriced asset or a hidden risk that comps aren't pricing in. Stress-test before assuming the spread holds.
Location & tenants
- Location reads 81/100 on livability (#20 in CT, #1,490 nationally) — a professional / high-income tenant draw. Strengths: crime A+, employment A+, housing A+; Watch: cost of living C-, amenities D-, commute F.
- Berlin School District (suburban): math 47% / reading 58% proficiency, ranked #69 of 153 in CT (top 45%) — acceptable for families but not a draw, mixed tenant base, ~2y average lease; only 10% free/reduced lunch — higher-income household profile.
- Zoned schools: Emma Hart Willard School (math 47% / reading 57%, grade C-, #213 of 553 statewide, top 41%, 437 students, 32% FRL); Catherine M. Mcgee Middle School (math 44% / reading 53%, grade C-, #84 of 175 statewide, top 49%, 582 students, 22% FRL); Berlin High School (math 38% / reading 69%, grade C-, #78 of 194 statewide, top 40%, 858 students, 18% FRL).
- Market conditions: 62 active listings in the ZIP; 2 comparable units currently listed for rent nearby; high-income renter base; 1,867 units permitted in Capitol Planning Region in 2024 (1,399 in 5+ unit buildings).
Forward outlook
- Local home prices are declining (-3.0%/yr); year-one equity from $2k of loan paydown is wiped out by about $9k of value loss. Plan a longer hold.
Negotiation context
- Only 9 days on market — expect competitive offers; lowballing is unlikely to land.
- 4 sale attempts since 26y ago; this cycle's ask is 67% above the opening price — seller raised mid-cycle; expect resistance to lowballs.
- Current owner paid $182k; list at $300k implies a 65% gain — meaningful room to come down on a strong offer.
Risks & watch-outs
- Watch-outs: built in 1920 — expect roof / HVAC / electrical / plumbing capex.
- Climate carrying-cost: major wind risk, 27% chance of damaging wind over 30y; extreme-heat days projected 7→15/yr by 2055 (HVAC capex compounding) — expect insurance premiums to compound above CPI over the hold.
Questions for the listing agent
- Built in 1920 — when were the roof, HVAC, electrical panel, plumbing, and water heater last replaced?
- Is there a deadline driving the sale (1031 exchange, divorce, estate, relocation)? That informs how much negotiation room exists.
- Schools are B-rated — typically a magnet for longer-tenancy family renters. What's the average tenant stay here, and is there a school-zone premium baked into asking?
- What's the average days-on-market for RENTAL listings here right now (not sales)? A rising rental-DOM trend means longer vacancies and softer asking-rent achievability than the comps imply.
- What's the recent tenant-quality profile in this submarket — average credit score on applications, eviction rate, late-payment / NSF rate, and stable-employment percentage? A property-management company in the area should have these aggregated.
- How much new for-sale + rental construction is in the pipeline within 1–3 miles? Heavy new supply typically softens prices + rents 12–24 months out; constrained supply supports both.
Investment metrics
- 1% rule
- 0.87% ✗
- Cap rate
- 6.54%
- Cash-on-cash
- 0.90%
- DSCR
- 1.04
- GRM
- 9.5
CMA / ARV
- ARV (on-the-fly)
- $373,200
- Comps found
- 3
Show comp detail 3 sales within ~0.75 mi
| Address | Dist | Beds/Ba | Sqft | Sold | Price | $/sf | Match |
|---|---|---|---|---|---|---|---|
| 644 Four Rod Rd | 0.10mi | 3/1.5 | 1,267 (+2%) | 4mo | $380,000 | $300 | 87 |
| 473 Lower Ln | 0.71mi | 3/2.0 | 1,376 (+11%) | 10mo | $340,000 | $247 | 41 |
| 165 Ridgewood Ln | 0.55mi | 3/1.5 | 1,156 (-7%) | 24mo | $400,000 | $346 | 41 |
Match score weights: distance 35% · size 25% · config 20% · recency 20%. Top-matched comps best support the ARV.
Projected returns pro-forma
-3.0% appreciation · 3.0% rent growth · sell at horizon
- IRR
- -14.9%
- Equity multiple
- 0.47×
- Total profit
- $-44,594
- Equity at exit
- $44,716
- IRR
- -6.2%
- Equity multiple
- 0.60×
- Total profit
- $-33,677
- Equity at exit
- $25,930
Cash invested: $83,972 (down + closing). Projections, not guarantees.
Landlord ↔ Tenant lean methodology
- Overall (STATE)
- 27 Tenant-Leaning
- State Connecticut
- 27 Tenant-Leaning · D+7
- County
- — inherits STATE
- City
- — inherits STATE
ZIP-level market 06037
- Home prices YoY
- -32.9%
- Active inventory
- 62
- Price-to-rent
- 9.5×
Monthly cashflow live
- Estimated rent
- $2,623 medium interval (Pro) →
- Mortgage (P&I)
- −$1,573
- Tax from tax record
- −$311 /mo · $3,736/yr
- Insurance
- −$125
- HOA
- −$0
- Vacancy / Maint / Mgmt
- −$551
- Net cashflow
- $63
Break-even live
Sensitivity live
| Price | -10% $233 | -5% $148 | +0% $63 | +5% $-22 | +10% $-107 |
|---|---|---|---|---|---|
| Rent | -10% $-144 | -5% $-41 | +0% $63 | +5% $166 | +10% $270 |
| Rate | -1.0pp $214 | -0.5pp $139 | base $63 | +0.5pp $-15 | +1.0pp $-94 |
UW: 25.0% down · 7.5% · 30yr · 1.5% tax · 5.0% vac · 8.0% maint · 8.0% mgmt
Financing live
Cash to close
- Down payment
- $74,975
- Closing costs
- $8,997
- Reserves months
- —
- Total cash needed
- —
Loan-product check · same deal, 3 products live
Conventional
25% down · 7.5% · 30yr
- Down + closing
- —
- Monthly P&I
- —
- Monthly cashflow
- —
- DSCR
- —
- Eligible?
- —
Personal DTI + credit; lowest rate.
DSCR
20% down · 8.5% · 30yr
- Down + closing
- —
- Monthly P&I
- —
- Monthly cashflow
- —
- DSCR
- —
- Eligible?
- —
No personal income docs; deal must DSCR.
Hard money
10% down · 12.0% · 12mo
- Down + closing
- —
- Monthly P&I
- —
- Monthly cashflow
- —
- DSCR
- —
- Eligible?
- —
Short-term bridge; refi at stabilization.
Rent comps 2 comps
| Address | Beds | Baths | Sqft | Rent | $/sqft | DOM | Units | Dist |
|---|---|---|---|---|---|---|---|---|
| 883 Worthington Rdg Unit 2nd Floor Kensington, CT | 2.0 | 1.0 | 800 | $2,200 | $2.75 | 45d | 1 | 1.15mi |
| 1044 Farmington Ave Berlin, CT | 2.0 | 1.0 | 978 | $2,150 | $2.20 | 45d | 1 | 1.21mi |
Listing history 12 events
-
2026-06-16statusdays on market $299,900 Under Contract 9 DOM
-
2026-06-15days on market $299,900 Active 8 DOM
-
2026-06-13days on market $299,900 Active 6 DOM
-
2026-06-13days on market $299,900 Active 5 DOM
-
2026-06-10days on market $299,900 Active 3 DOM
-
2026-06-09days on market $299,900 Active 2 DOM
-
2026-06-08statusdays on market $299,900 Active 1 DOM
-
2026-06-07days on market $299,900 Coming Soon 6 DOM
-
2026-06-05days on market $299,900 Coming Soon 3 DOM
-
2026-06-03days on market $299,900 Coming Soon 2 DOM
-
2026-06-01remarks 699-char remark
-
2026-06-01$299,900 Coming Soon 1 DOM
ⓘ Source: listings_history table (triggers on properties + properties_extension) + one-shot
backfill from property_details.listing_events for pre-trigger history.
Tax reassessment forecast CT · Partial reset (capped growth)
- Current annual tax
- $3,736 · $311/mo
- Projected year-2 tax
- $5,077 · $423/mo
- Expected delta
- +$1,341/yr (+$112/mo · 35.9%)
ⓘ Screening estimate from a state-policy table — verify with the county assessor before closing.
Climate risk First Street
- Flood 1/10 Low FEMA zone X (unshaded) · 0% chance over 30 yrs
- Wildfire 2/10 Low
- Heat 5/10 Major 7 d/yr ≥98°F today · 15 d/yr by 30 yrs out
- Wind 6/10 Major 27% chance of damaging wind over 30 yrs
- Air quality 3/10 Moderate 3 unhealthy d/yr today · 4 by 30 yrs out
Nearby sold comps map
Loading sold comps map…
Walkable amenities ~0.75 mi
Loading nearby amenities…
Taxation est. · year 1
- Rental income
- $31,471
- − Mortgage interest
- −$16,799
- − Property taxes
- −$3,736
- − Insurance
- −$1,500
- − Repairs & maintenance
- −$2,518
- − Management
- −$2,518
- − Depreciation
- −$8,724
- Taxable loss
- −$4,323
- Est. tax savings @ 24.0%
- +$1,038
- After-tax cash flow
- $1,792/yr
For passive investors: Depreciation is non-cash, so a rental often shows a tax loss while cash-flowing — sheltering income. Rental losses are passive: they offset passive income freely, and up to $25,000/yr can offset ordinary (W-2) income if you actively participate and your MAGI is under $100k (phasing out to $0 by $150k); unused losses carry forward. On sale, claimed depreciation is recaptured at up to 25%, and gains may owe capital-gains tax (a 1031 exchange can defer both). Figures are a year-1 estimate at your 24.0% rate — not tax advice; consult a CPA.
Schools (NCES district)
- District
- Berlin School District
- NCES district ID
- 0900210
- Math proficiency
- 47% ▼ -12.00%
- Reading proficiency
- 58% ▼ -8.00%
- Median HH income
- $87,497
- Composite
- 48.4/100
- National rank
- #2136
- State rank
- #69 of 153 in CT
Livability — Kensington
- Score
- 81/100
- State rank
- #20
- US rank
- #1490
Category grades
Schools grade is shown separately in the Schools card above.
Census & demographics
- Census place
- Kensington, CT
- County
- Hartford County · 754,208 people
- Metro
- Hartford-East Hartford-Middletown, CT
- Population (ZIP)
- 19,173
- Household income
- $116,042
- Rent vs Own
- Severe rent burden
- 294.0
Population outlook (Capitol County) Hauer SSP2
- By 2040
- 1,063,519
Race, ethnicity, and origin ACS 2023
- Neighborhood character
- Predominantly White (86%)
- Race & ethnicity
- White 86% Hispanic / Latino 7% Two or more races 5% Asian 5%
- Hispanic origin (detail)
- Puerto Rican 2% Cuban 2%
- Common ancestry
- Romanian 23% Lithuanian 8% Danish 2%
- Foreign-born
- 10% · Canada, China
- Languages at home
- 85% English-only · Russian/Polish/Slavic 6% Spanish 3% Other Indo-European 2%
Political lean MEDSL · Capitol
- 2024 margin
- Strong D (+21.9) · D 60.1% · R 38.2% · Other 1.7%
- All cycles
- 2024: D+21.9
Not yet ingested
- Civics
- —
Market trends
- HPI YoY
- ▼ -145.47%
- Current HPI
- 296.2808
- Rent YoY
- —
- Metro
- Hartford-East Hartford-Middletown, CT
- State GDP YoY
- ▲ 1.06%
- F500 in state
- 38
Industry mix (Fortune 500 HQ in CT)
| Industry | F500 HQs | Revenue |
|---|---|---|
| Industrial Machinery | 4 | $38B |
|
||
| Insurance | 3 | $71B |
|
||
| Financial Services | 2 | $25B |
|
||
| Transportation / Logistics | 2 | $18B |
|
||
| Healthcare | 1 | $247B |
|
||
| Telecommunications | 1 | $55B |
|
||
Price history
+233.6% since first listed11 events — show timeline
- 2026-06-01 Coming Soon $299,900 Smart MLS
- 2011-07-18 Sold (Public Records) $181,900 Public Records
- 2011-07-15 Sold (MLS) $181,900 Smart MLS
- 2011-06-06 Listed $179,900 Smart MLS
- 2010-11-22 Sold (MLS) $99,900 Smart MLS
- 2010-10-31 Listed $99,900 Smart MLS
- 2004-11-01 Sold (Public Records) $176,000 Public Records
- 2004-10-29 Sold (MLS) $176,000 Smart MLS
- 2004-06-16 Listed $169,900 Smart MLS
- 2000-09-27 Sold (MLS) $80,000 Smart MLS
- 2000-08-21 Listed $89,900 Smart MLS
Property tax history
+1.1%/yrLatest (2025): $3,736 · +1.4% YoY. Source: county tax records.
Cash-flow waterfall
monthlySold comps — $/sqft
last 12 mo · ≤1 miLoading sold comps…