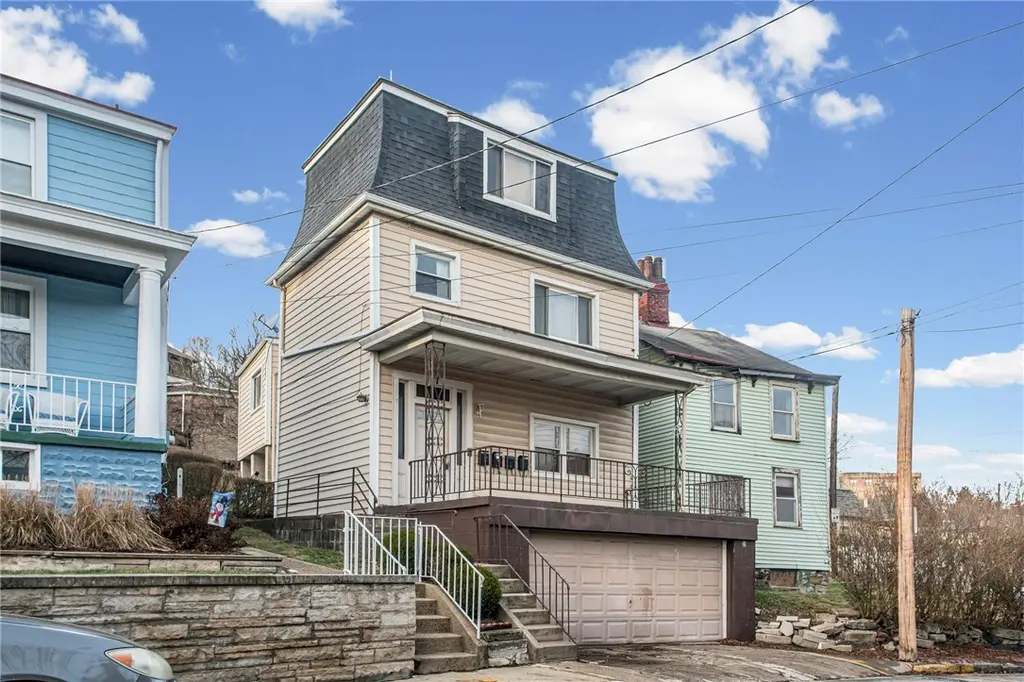
17 Locust St · Etna, PA
Flood risk 4/10 · Minor
- FEMA flood zone
- X (unshaded)
- Chance of flooding over 30 yrs
- 0.23%
- Est. flood insurance / yr
- $473 – $860
Fire risk 1/10 · Minimal
- Est. fire insurance / yr
- $511 – $949
Heat risk 4/10 · Minor
- Hot days now (above 98°F)
- 7 days/yr
- Hot days in 30 yrs
- 19 days/yr
Wind risk 2/10 · Minimal
- Chance of severe wind over 30 yrs
- —
Air-quality risk 4/10 · Minor
- Unhealthy air days now
- 5 days/yr
- Unhealthy air days in 30 yrs
- 7 days/yr
Risk factors via First Street. Map © Google.
Why this score? — see what drove the D- grade
The composite is a weighted blend of 9 inputs, each scored 0–100. Each bar is that input's sub-score; the figure is the points it added to the 100-point composite (weight × sub-score).
- ARV discount +13.2/15.0
- Cash flow +6.3/30.0
- Schools +4.1/10.0
- Livability +4.0/5.0
- Rent growth +2.5/5.0
- Condition / age +2.5/5.0
- 1% rule +2.0/10.0
- DSCR +0.6/10.0
- Appreciation +0.0/10.0
$309,000
🖨 Deal sheet (PDF) 📄 Offer letter ✓ Due diligence
Listing remarks MLS
Four unit multifamily in Etna with long term tenants. Just a short walk to Etna's growing business district. Shops and dining close by. Easy access to Rt. 28 and downtown Pittsburgh. Property features a spacious yard and attached integral garage. Ideal for investors or owner-occupants.
Key facts
- 3,188 sq ft lot
- Garage
- Built 1900
Neighborhood map
What this means for you Summary
Snapshot
- This is a 4-bed/4.0-bath other listed at $309k.
Deal economics
- At list price, monthly cash flow is $-552 ($-7k/yr) — negative.
- To cash-flow at today's rent, offer at most $212k (31.5% below list).
- To meet the 1% rule (rent ≥ 1% of price), the offer needs to be $215k (30.3% below list).
- Recommended offer: $212k (31.5% below list) — sets the bar for cash-flow.
Location & tenants
- Location reads 81/100 on livability (#172 in PA, #1,441 nationally) — a professional / high-income tenant draw. Strengths: crime A+, commute A+, cost of living A+; Watch: employment C-, amenities D.
- Shaler Area SD (suburban): math 36% / reading 59% proficiency, ranked #208 of 539 in PA (top 39%) — families likely to look elsewhere, expect single-tenant / working-renter base with shorter leases.
- Zoned schools: Shaler Area Hs (math 61% / reading 10%, grade F, #308 of 437 statewide, top 71%, 1,225 students, 36% FRL).
- Zoned-school proficiency averages 36% at this address vs 48% district-wide (-12 pts) — the specific schools serving this property underperform the Shaler Area SD average; the district grade overstates school quality for this exact location.
- Market conditions: 23 active listings in the ZIP; 2 comparable units currently listed for rent nearby; 2,996 units permitted in Allegheny County in 2024 (1,588 in 5+ unit buildings).
- This rent runs 42% of the median local income ($61k/yr) — at the standard rent-burdened threshold; future hikes will face affordability resistance.
Forward outlook
- Local home prices are declining (-3.0%/yr); year-one equity from $2k of loan paydown is wiped out by about $9k of value loss. Plan a longer hold.
Negotiation context
- It's been on market 68 days — a 6% lower offer ($290k) is reasonable based on typical stale-listing flexibility.
- 4 sale attempts since 23y ago with the ask held roughly flat each time — persistent listings suggest the price (not the market) is what's stuck; bring a comps-based counter.
- Current owner paid $225k; 37% above their basis — modest negotiation headroom, anchor on the comps not their cost.
Risks & watch-outs
- Watch-outs: built in 1900 — expect roof / HVAC / electrical / plumbing capex.
Questions for the listing agent
- What do current leases actually rent for vs. the listed asking? Can we see a recent rent roll and the last 12 months of T-12 income?
- It's been on market 68 days. Have you received any prior offers? Is the seller open to a 32% concession, seller financing, or rate buy-down credit?
- Built in 1900 — when were the roof, HVAC, electrical panel, plumbing, and water heater last replaced?
- Why hasn't it sold? Are there any deal-killer items the seller is aware of (foundation, flood, title, zoning, code violations)?
- Is there a deadline driving the sale (1031 exchange, divorce, estate, relocation)? That informs how much negotiation room exists.
- Schools are D-rated, which usually means shorter tenancies and higher turnover. Who's the typical renter profile here, and what's been the actual vacancy rate?
- The area grade is low — what's the realistic commute time and amenity access for the typical tenant pool here? Any planned neighborhood developments (good or bad) we should know about?
- What's the average days-on-market for RENTAL listings here right now (not sales)? A rising rental-DOM trend means longer vacancies and softer asking-rent achievability than the comps imply.
- What's the recent tenant-quality profile in this submarket — average credit score on applications, eviction rate, late-payment / NSF rate, and stable-employment percentage? A property-management company in the area should have these aggregated.
- How much new for-sale + rental construction is in the pipeline within 1–3 miles? Heavy new supply typically softens prices + rents 12–24 months out; constrained supply supports both.
Investment metrics
- 1% rule
- 0.70% ✗
- Cap rate
- 4.15%
- Cash-on-cash
- -7.65%
- DSCR
- 0.66
- GRM
- 12.0
CMA / ARV
- ARV (median comp)
- $353,458
- List price
- $309,000
- Delta
- -12.58%
- Verdict
- UNDERPRICED
- Comps
- 1 within 2.0 mi
Projected returns pro-forma
-3.0% appreciation · 3.0% rent growth · sell at horizon
- IRR
- -29.6%
- Equity multiple
- 0.02×
- Total profit
- $-85,101
- Equity at exit
- $46,073
- IRR
- -30.3%
- Equity multiple
- -0.37×
- Total profit
- $-118,920
- Equity at exit
- $26,717
Cash invested: $86,520 (down + closing). Projections, not guarantees.
Landlord ↔ Tenant lean methodology
- Overall (STATE)
- 62 Landlord-Friendly
- State Pennsylvania
- 62 Landlord-Friendly · EVEN
- County
- — inherits STATE
- City
- — inherits STATE
ZIP-level market 15223
- Home prices YoY
- -28.0%
- Active inventory
- 23
- Price-to-rent
- 12.0×
Monthly cashflow live
- Estimated rent
- $2,154 medium interval (Pro) →
- Mortgage (P&I)
- −$1,620
- Tax from tax record
- −$504 /mo · $6,049/yr
- Insurance
- −$129
- HOA
- −$0
- Vacancy / Maint / Mgmt
- −$452
- Net cashflow
- $-552
Break-even live
Sensitivity live
| Price | -10% $-377 | -5% $-464 | +0% $-552 | +5% $-639 | +10% $-727 |
|---|---|---|---|---|---|
| Rent | -10% $-722 | -5% $-637 | +0% $-552 | +5% $-467 | +10% $-381 |
| Rate | -1.0pp $-396 | -0.5pp $-473 | base $-552 | +0.5pp $-632 | +1.0pp $-713 |
UW: 25.0% down · 7.5% · 30yr · 1.5% tax · 5.0% vac · 8.0% maint · 8.0% mgmt
Financing live
Cash to close
- Down payment
- $77,250
- Closing costs
- $9,270
- Reserves months
- —
- Total cash needed
- —
Loan-product check · same deal, 3 products live
Conventional
25% down · 7.5% · 30yr
- Down + closing
- —
- Monthly P&I
- —
- Monthly cashflow
- —
- DSCR
- —
- Eligible?
- —
Personal DTI + credit; lowest rate.
DSCR
20% down · 8.5% · 30yr
- Down + closing
- —
- Monthly P&I
- —
- Monthly cashflow
- —
- DSCR
- —
- Eligible?
- —
No personal income docs; deal must DSCR.
Hard money
10% down · 12.0% · 12mo
- Down + closing
- —
- Monthly P&I
- —
- Monthly cashflow
- —
- DSCR
- —
- Eligible?
- —
Short-term bridge; refi at stabilization.
Rent comps 2 comps
| Address | Beds | Baths | Sqft | Rent | $/sqft | DOM | Units | Dist |
|---|---|---|---|---|---|---|---|---|
| 212 8th St Sharpsburg, PA | 4.0 | 2.0 | 2240 | $2,100 | $0.94 | 19d | 1 | 0.61mi |
| 6026 Sawyer St Unit NA Pittsburgh, PA | 3.0 | 2.0 | 2231 | $2,500 | $1.12 | 20d | 1 | 0.70mi |
Listing history 25 events
-
2026-06-21days on market $309,000 Active 68 DOM
-
2026-06-18days on market $309,000 Active 65 DOM
-
2026-06-17days on market $309,000 Active 64 DOM
-
2026-06-16days on market $309,000 Active 63 DOM
-
2026-06-15days on market $309,000 Active 62 DOM
-
2026-06-13days on market $309,000 Active 60 DOM
-
2026-06-13days on market $309,000 Active 59 DOM
-
2026-06-09days on market $309,000 Active 56 DOM
-
2026-06-08days on market $309,000 Active 55 DOM
-
2026-06-07days on market $309,000 Active 54 DOM
-
2026-06-03days on market $309,000 Active 50 DOM
-
2026-06-02days on market $309,000 Active 49 DOM
-
2026-06-01days on market $309,000 Active 48 DOM
-
2026-05-31days on market $309,000 Active 47 DOM
-
2026-04-14$309,000 Active 286-char remark
Show marketing remark (286 chars)
Four unit multifamily in Etna with long term tenants. Just a short walk to Etna's growing business district. Shops and dining close by. Easy access to Rt. 28 and downtown Pittsburgh. Property features a spacious yard and attached integral garage. Ideal for investors or owner-occupants.
-
2026-03-31historical Expired 312-char remark
Show marketing remark (312 chars)
Four-unit multifamily in Etna with long term tenants near the business district. Convenient location close to shops, dining, and transportation. Property features a spacious yard and attached garage with off-street parking. Ideal for investors or owner-occupants. Easy access to Route 28 and downtown Pittsburgh.
-
2026-02-05$309,000 Active 312-char remark
Show marketing remark (312 chars)
Four-unit multifamily in Etna with long term tenants near the business district. Convenient location close to shops, dining, and transportation. Property features a spacious yard and attached garage with off-street parking. Ideal for investors or owner-occupants. Easy access to Route 28 and downtown Pittsburgh.
-
2022-06-30soldstatus $225,000
-
2022-06-24soldstatus $225,000 Closed
-
2022-05-14status Pending
-
2022-05-11$219,900 Active
-
2004-04-21soldstatus $93,000
-
2004-04-14soldstatus $93,000
-
2003-11-21$99,900
-
1977-05-23soldstatus $30,000
ⓘ Source: listings_history table (triggers on properties + properties_extension) + one-shot
backfill from property_details.listing_events for pre-trigger history.
Tax reassessment forecast PA · Partial reset (capped growth)
- Current annual tax
- $6,049 · $504/mo
- Projected year-2 tax
- $6,049 · $504/mo
- Expected delta
- $0/yr ($0/mo · 0.0%)
ⓘ Screening estimate from a state-policy table — verify with the county assessor before closing.
Climate risk First Street
- Flood 4/10 Moderate FEMA zone X (unshaded) · 23% chance over 30 yrs
- Wildfire 1/10 Low
- Heat 4/10 Moderate 7 d/yr ≥98°F today · 19 d/yr by 30 yrs out
- Wind 2/10 Low
- Air quality 4/10 Moderate 5 unhealthy d/yr today · 7 by 30 yrs out
Nearby sold comps map
Loading sold comps map…
Walkable amenities ~0.75 mi
Loading nearby amenities…
Taxation est. · year 1
- Rental income
- $25,847
- − Mortgage interest
- −$17,309
- − Property taxes
- −$6,049
- − Insurance
- −$1,545
- − Repairs & maintenance
- −$2,068
- − Management
- −$2,068
- − Depreciation
- −$8,989
- Taxable loss
- −$12,180
- Est. tax savings @ 24.0%
- +$2,923
- After-tax cash flow
- $-3,697/yr
For passive investors: Depreciation is non-cash, so a rental often shows a tax loss while cash-flowing — sheltering income. Rental losses are passive: they offset passive income freely, and up to $25,000/yr can offset ordinary (W-2) income if you actively participate and your MAGI is under $100k (phasing out to $0 by $150k); unused losses carry forward. On sale, claimed depreciation is recaptured at up to 25%, and gains may owe capital-gains tax (a 1031 exchange can defer both). Figures are a year-1 estimate at your 24.0% rate — not tax advice; consult a CPA.
Schools (NCES district)
- District
- Shaler Area SD
- NCES district ID
- 4221200
- Math proficiency
- 36% ▼ -16.00%
- Reading proficiency
- 59% ▼ -15.00%
- Median HH income
- $57,411
- Composite
- 41.33/100
- National rank
- #3506
- State rank
- #208 of 539 in PA
Livability — Etna
- Score
- 81/100
- State rank
- #172
- US rank
- #1441
Category grades
Schools grade is shown separately in the Schools card above.
Census & demographics
- Census place
- Etna, PA
- County
- Allegheny County · 1,022,028 people
- City population
- 6,255
- Metro
- Pittsburgh, PA
- Population (ZIP)
- 6,255
- Household income
- $61,083
- Rent vs Own
- Severe rent burden
- 266.0
Population outlook (Allegheny County) Hauer SSP2
- Today (2025)
- 1,250,282 people
- By 2030
- 1,256,482 · +0.5%
- By 2040
- 1,256,318 · +0.5%
- By 2050
- 1,244,169 · -0.5%
- By 2075
- 1,197,693 · -4.2%
- By 2100
- 1,093,187 · -12.6%
Race, ethnicity, and origin ACS 2023
- Neighborhood character
- Predominantly White (89%)
- Race & ethnicity
- White 89% Two or more races 7% Hispanic / Latino 2% Black 2%
- Common ancestry
- Romanian 15% Lithuanian 4% Italian 4%
- Foreign-born
- 2% · Canada
- Languages at home
- 96% English-only · Russian/Polish/Slavic 2% Spanish 1%
Political lean MEDSL · Allegheny
- 2024 margin
- Strong D (+20.3) · D 59.7% · R 39.4%
- 2008→2024 swing
- +4.8pp toward D · 2008: 15.5pp · 2024: 20.3pp
- All cycles
- 2024: D+20.3 2020: D+20.4 2016: D+16.4 2012: D+14.4 2008: D+15.5
Not yet ingested
- Civics
- —
Market trends
- HPI YoY
- ▼ -98.96%
- Current HPI
- 254.2648
- Rent YoY
- —
- Metro
- Pittsburgh, PA
- State GDP YoY
- ▲ 1.68%
- F500 in state
- 34
Industry mix (Fortune 500 HQ in PA)
| Industry | F500 HQs | Revenue |
|---|---|---|
| Healthcare | 2 | $309B |
|
||
| Insurance | 2 | $27B |
|
||
| Telecommunications / Media | 1 | $124B |
|
||
| Industrial Distribution | 1 | $22B |
|
||
| Financial Services | 1 | $20B |
|
||
| Chemicals / Materials | 1 | $18B |
|
||
Price history
+930.0% since first listed11 events — show timeline
- 2026-04-14 Listed $309,000 West Penn MLS
- 2026-03-31 Delisted — West Penn MLS
- 2026-02-05 Listed $309,000 West Penn MLS
- 2022-06-30 Sold (Public Records) $225,000 Public Records
- 2022-06-24 Sold (MLS) $225,000 West Penn MLS
- 2022-05-14 Pending — West Penn MLS
- 2022-05-11 Listed $219,900 West Penn MLS
- 2004-04-21 Sold (Public Records) $93,000 Public Records
- 2004-04-14 Sold (MLS) $93,000 West Penn MLS
- 2003-11-21 Listed $99,900 West Penn MLS
- 1977-05-23 Sold (Public Records) $30,000 Public Records
Property tax history
+6.1%/yrLatest (2026): $6,049 · +0.0% YoY. Source: county tax records.
Cash-flow waterfall
monthlySold comps — $/sqft
last 12 mo · ≤1 miLoading sold comps…